Download to read offline
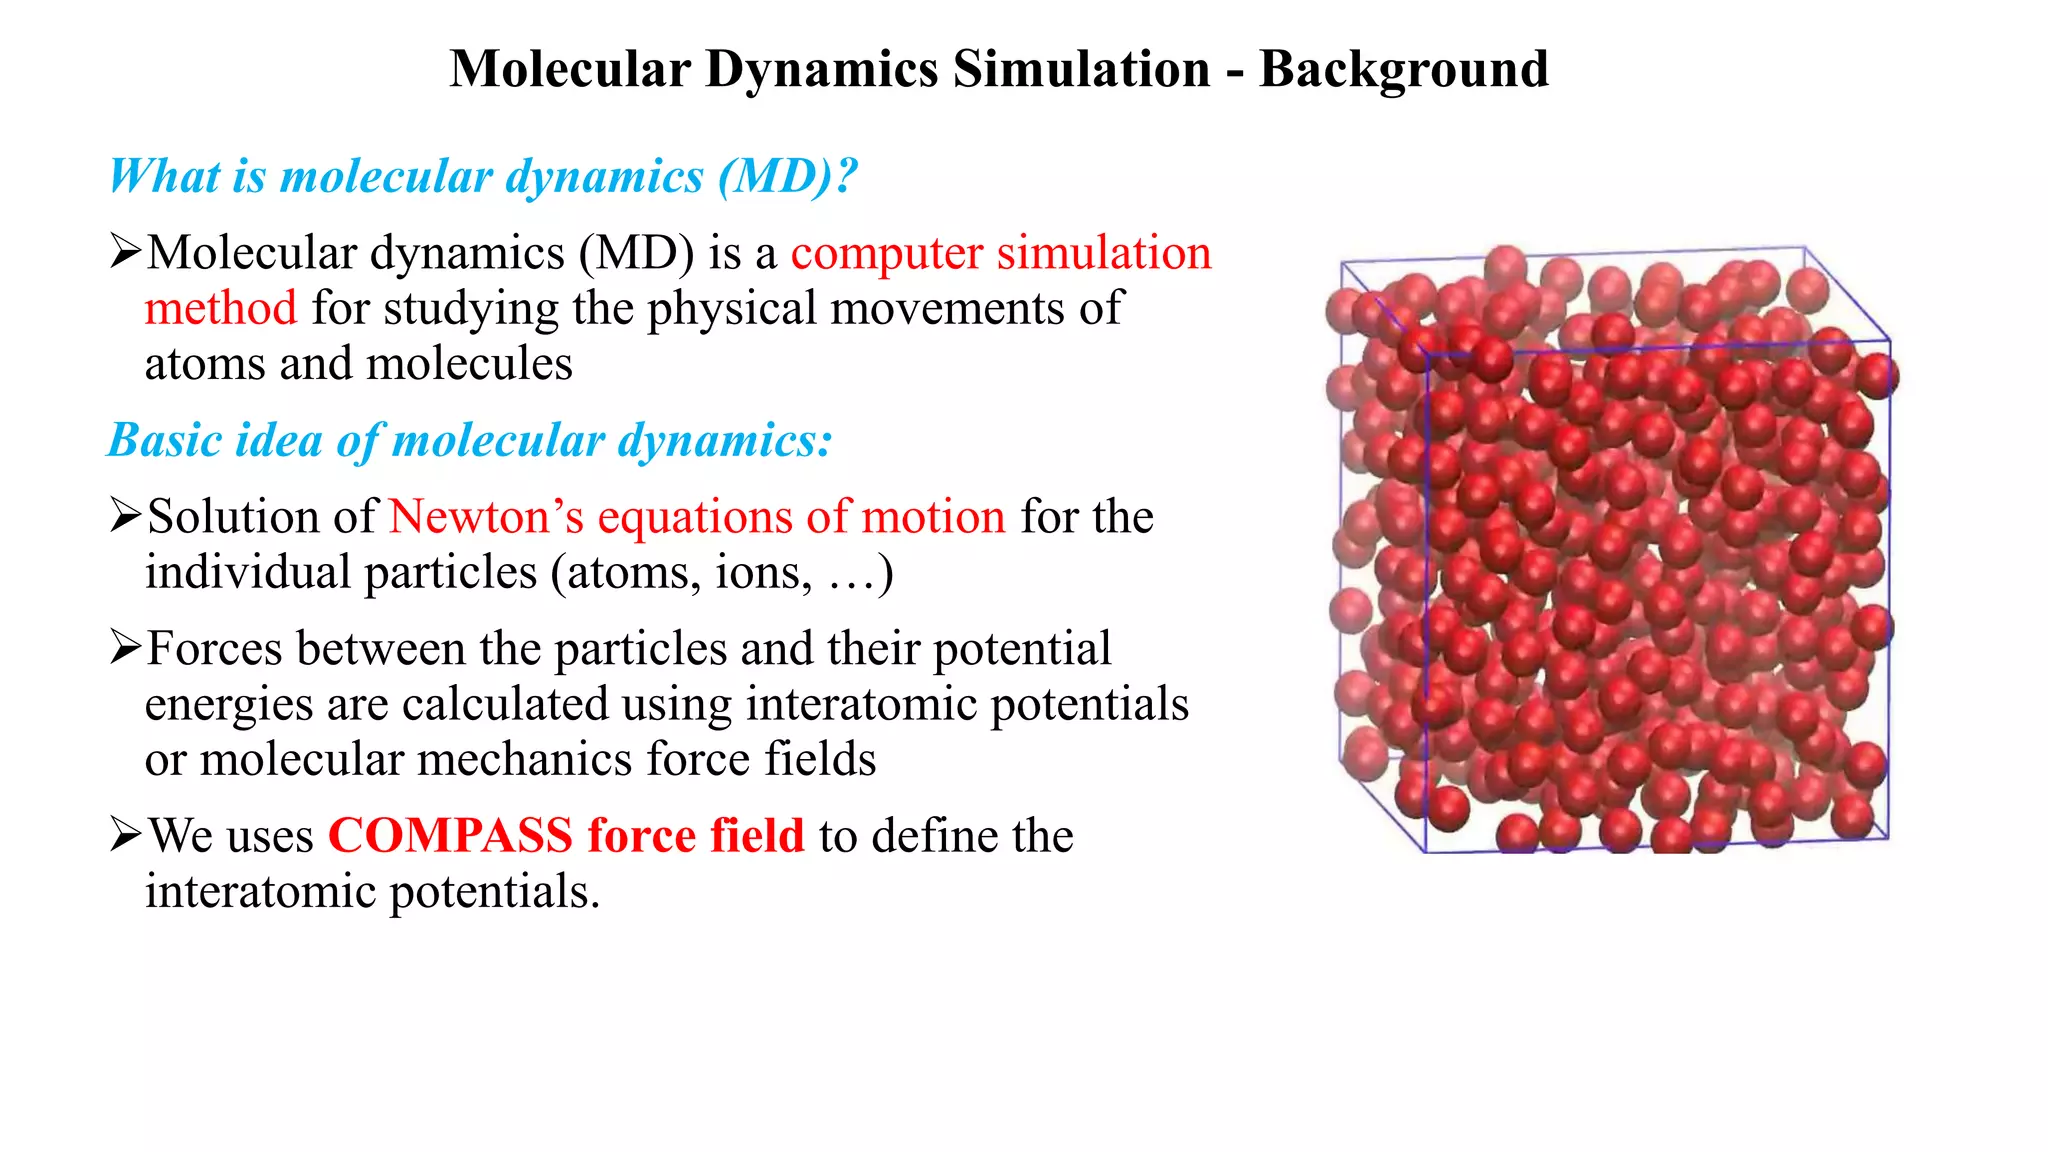
![Molecular dynamics simulation - Background
Derive the force term from its gradient of its potential energy function
8/7/2021
9
Extract the acceleration using Newton’s law
To find the position of an atom at t+ Δt, use taylor’s expansion
When adding the two formulas, the first and third derivatives cancel out:
And we can express the next timestep in terms of the previous position and the current acceleration:
)
(
)
(
)
(
2
)
(
)
( 4
2
t
O
t
t
a
t
r
t
t
r
t
t
r
)
(
)
(
)
(
)
(
2
)
( 4
2
t
O
t
t
a
t
t
r
t
r
t
t
r
)
(
)]
(
)
(
[
2
1
)
( 2
t
O
t
t
r
t
t
r
t
t
v
Velocity of an atom can be calculated using the finite difference method](https://image.slidesharecdn.com/phddefenserajmohanmuthaiah07252021-210807052838/75/Ph-d-defense_rajmohan_muthaiah_University_of_oklahoma_07_28_2021-9-2048.jpg)
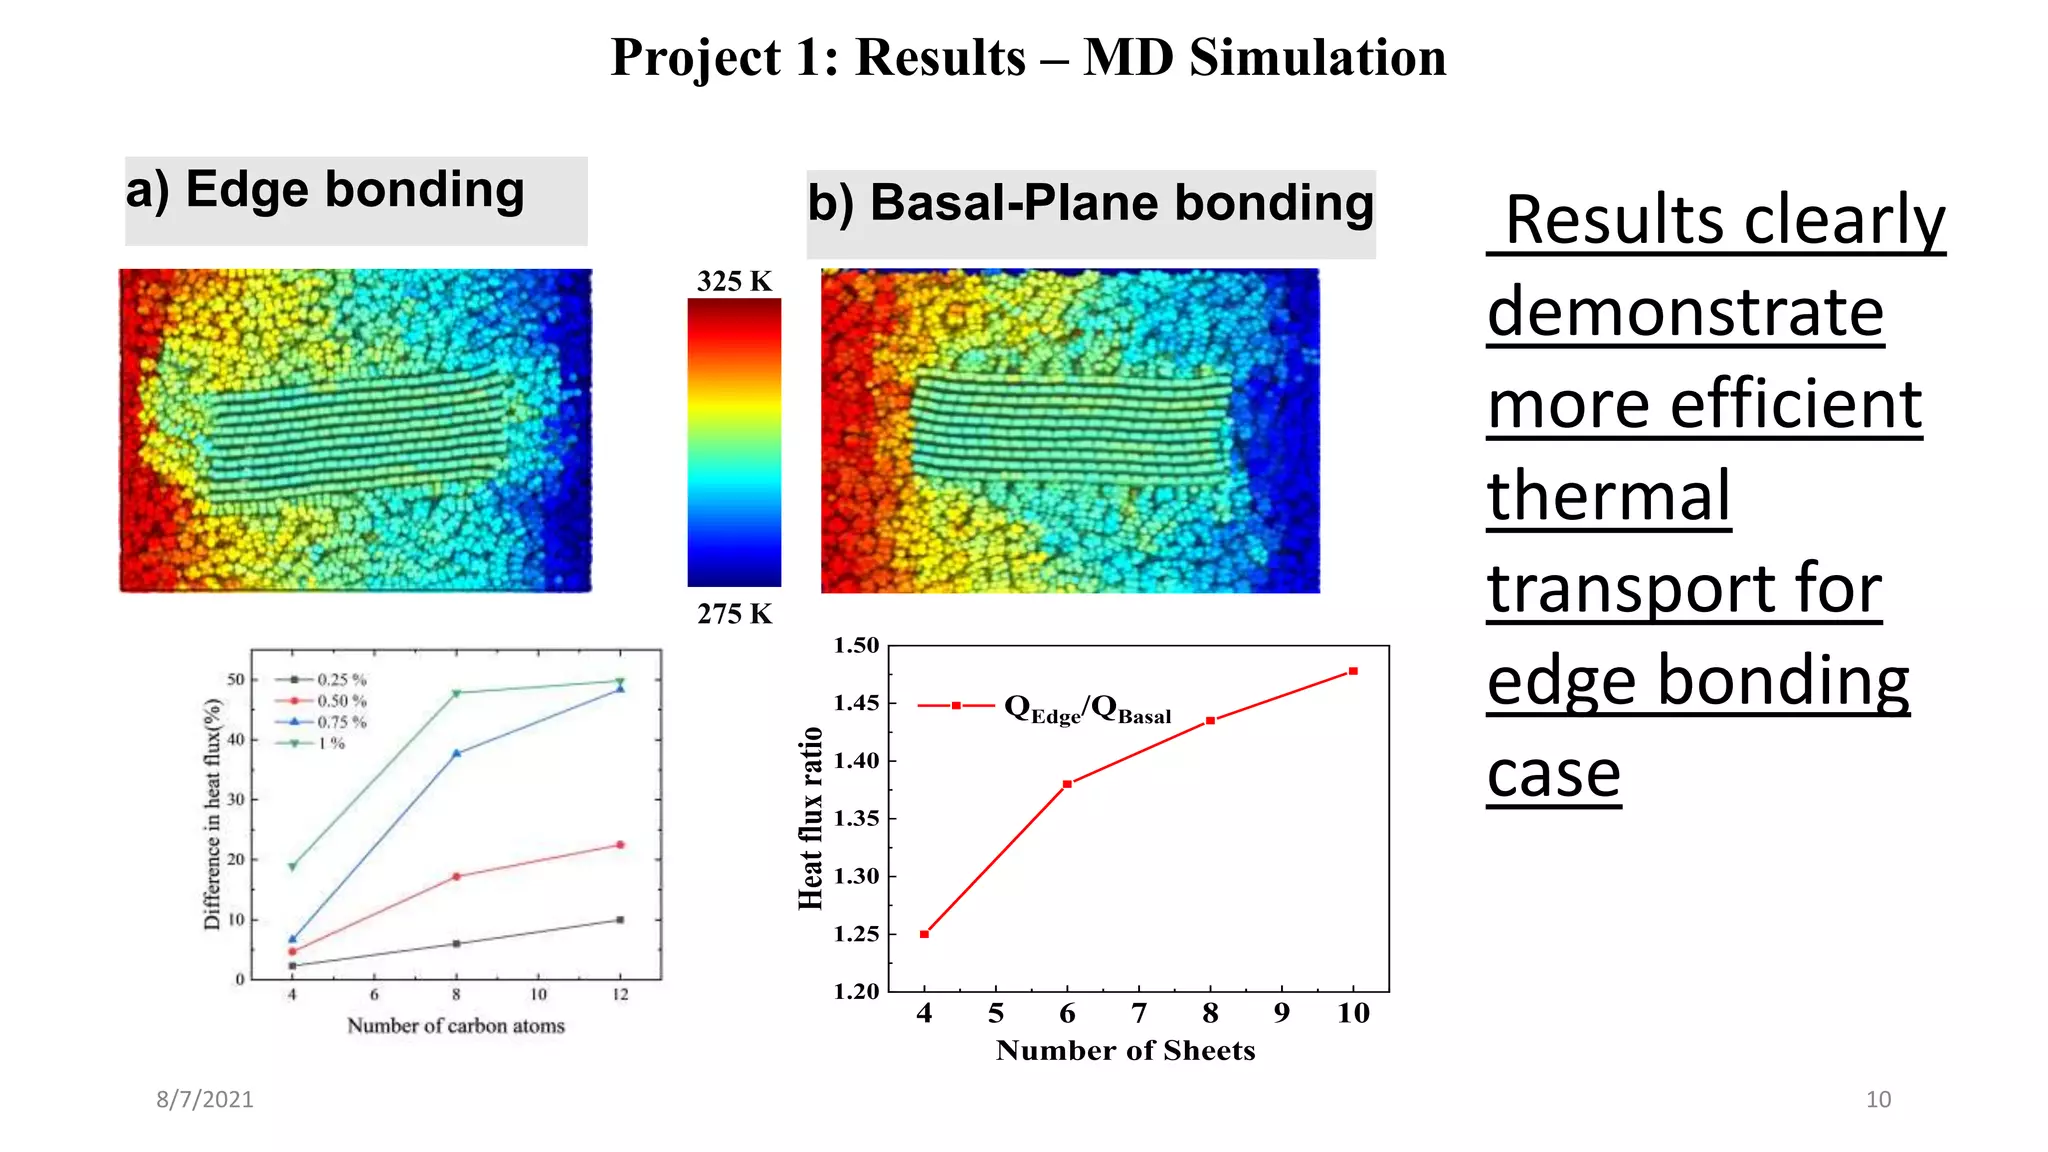
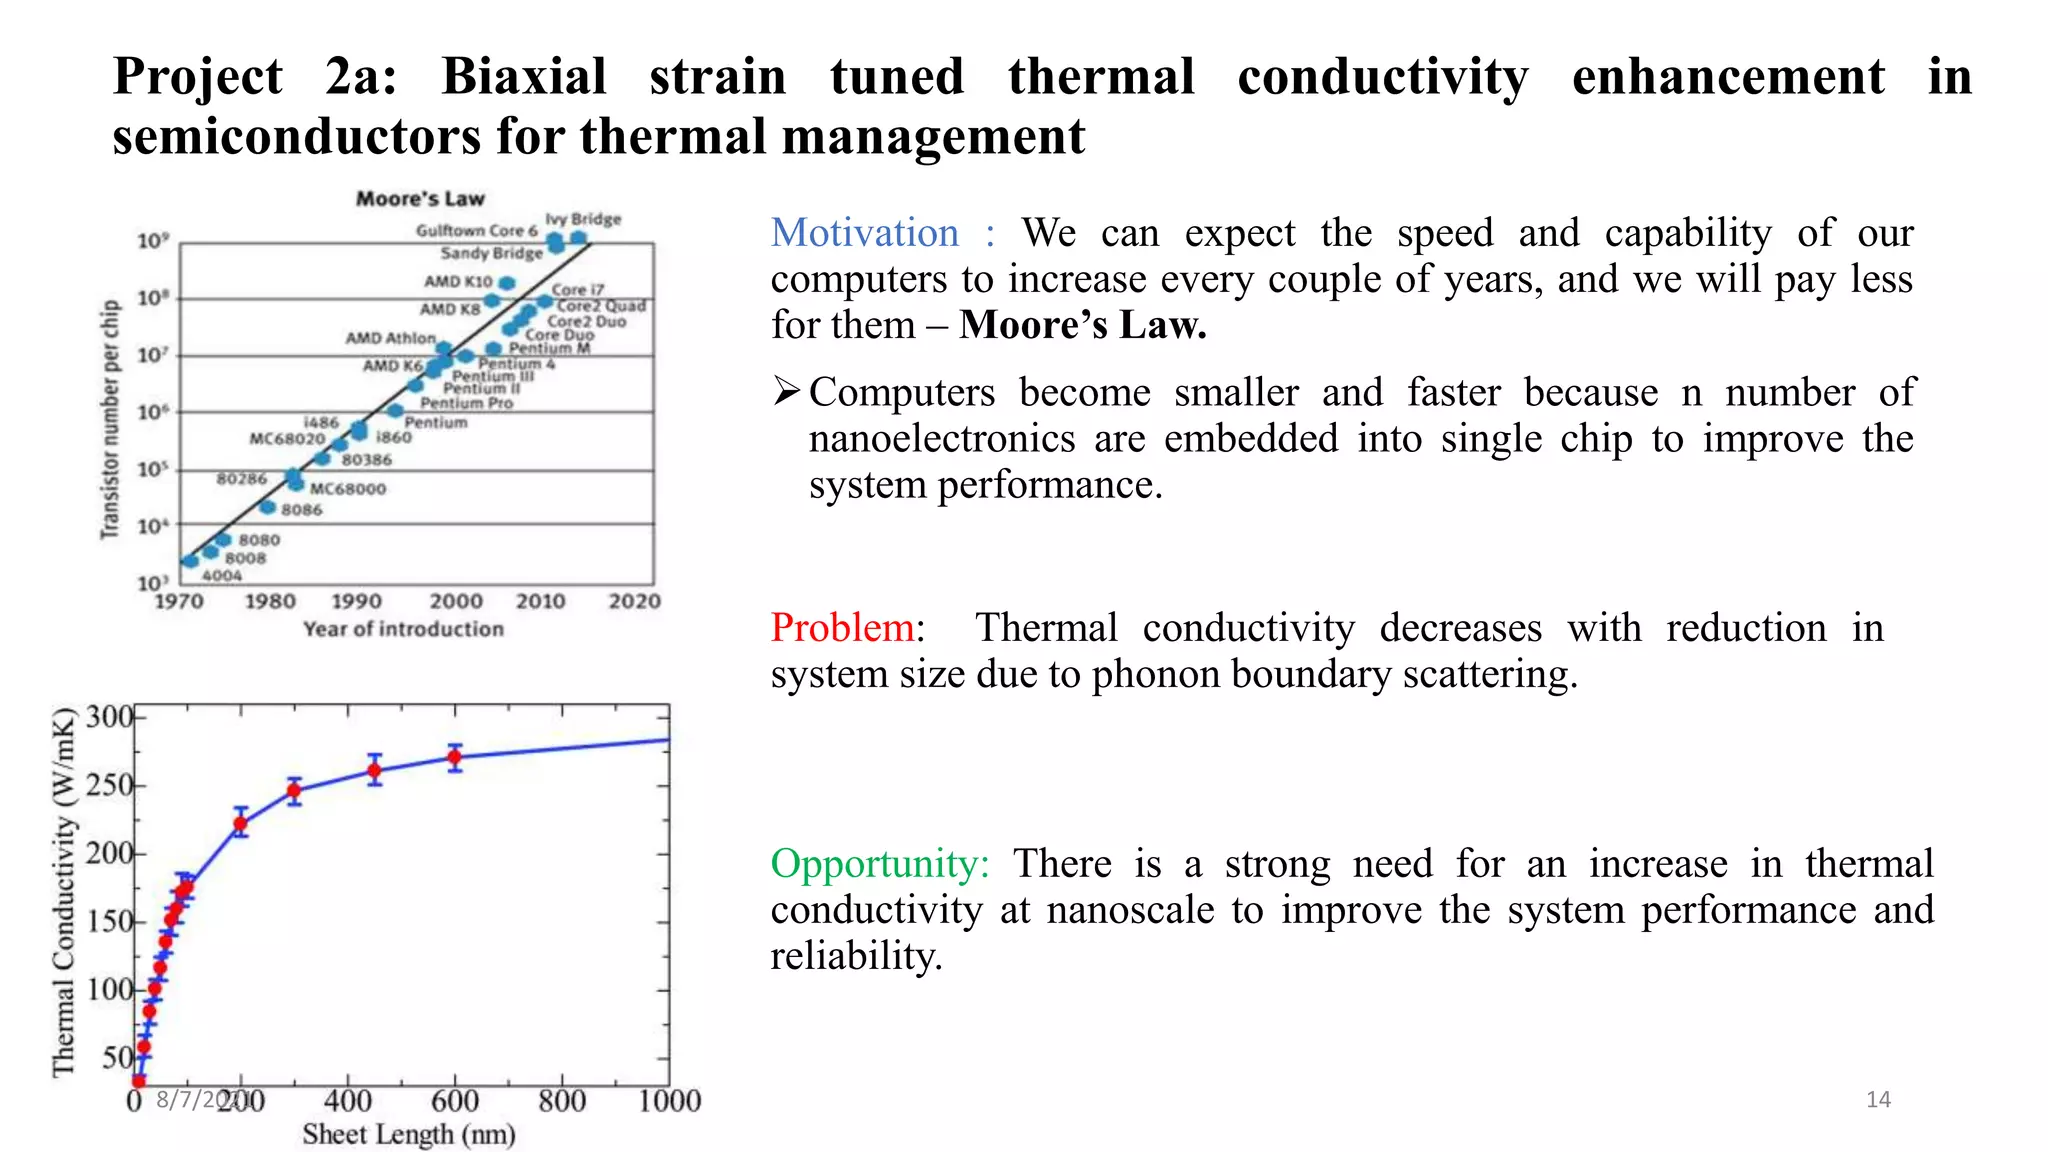
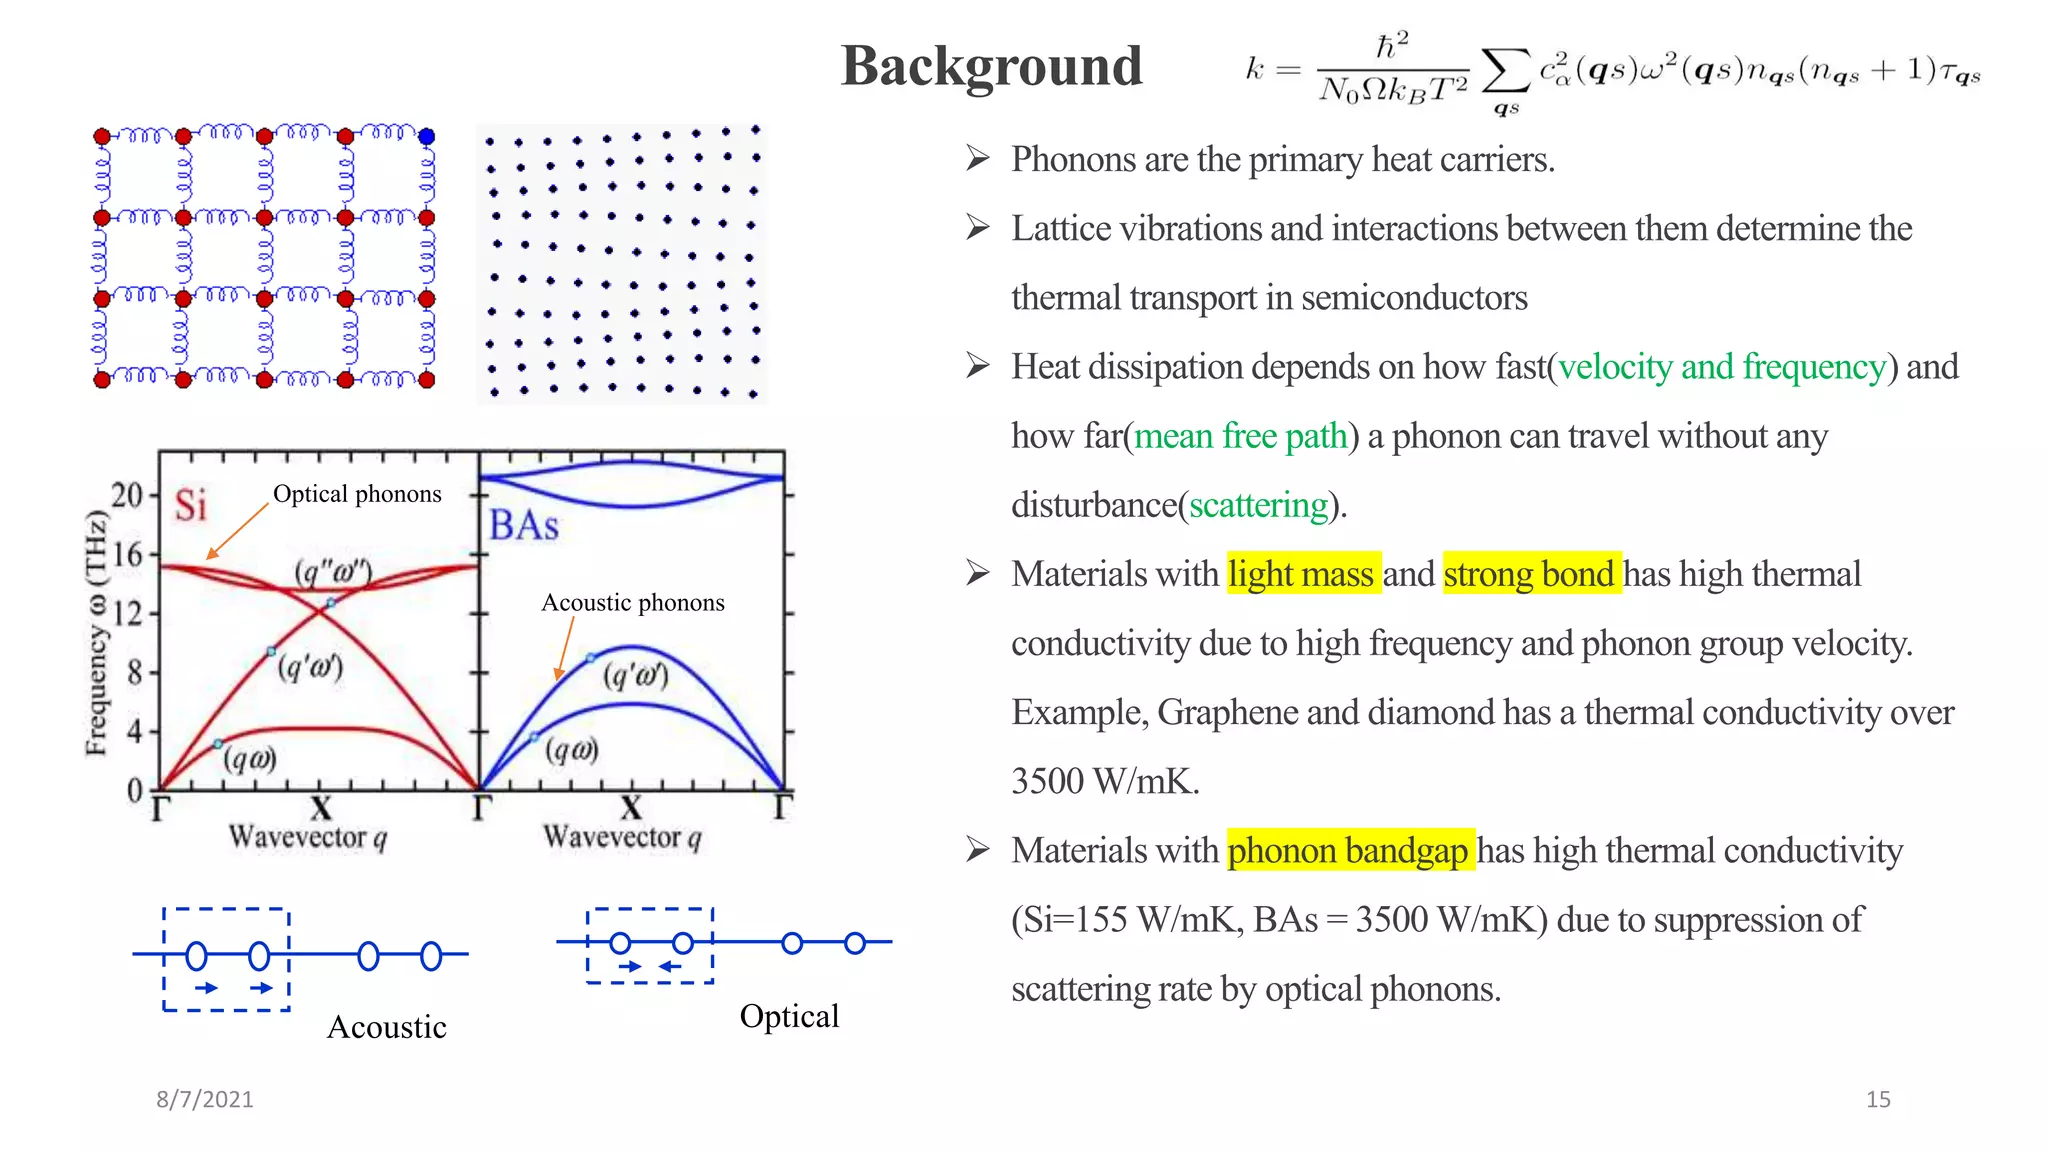

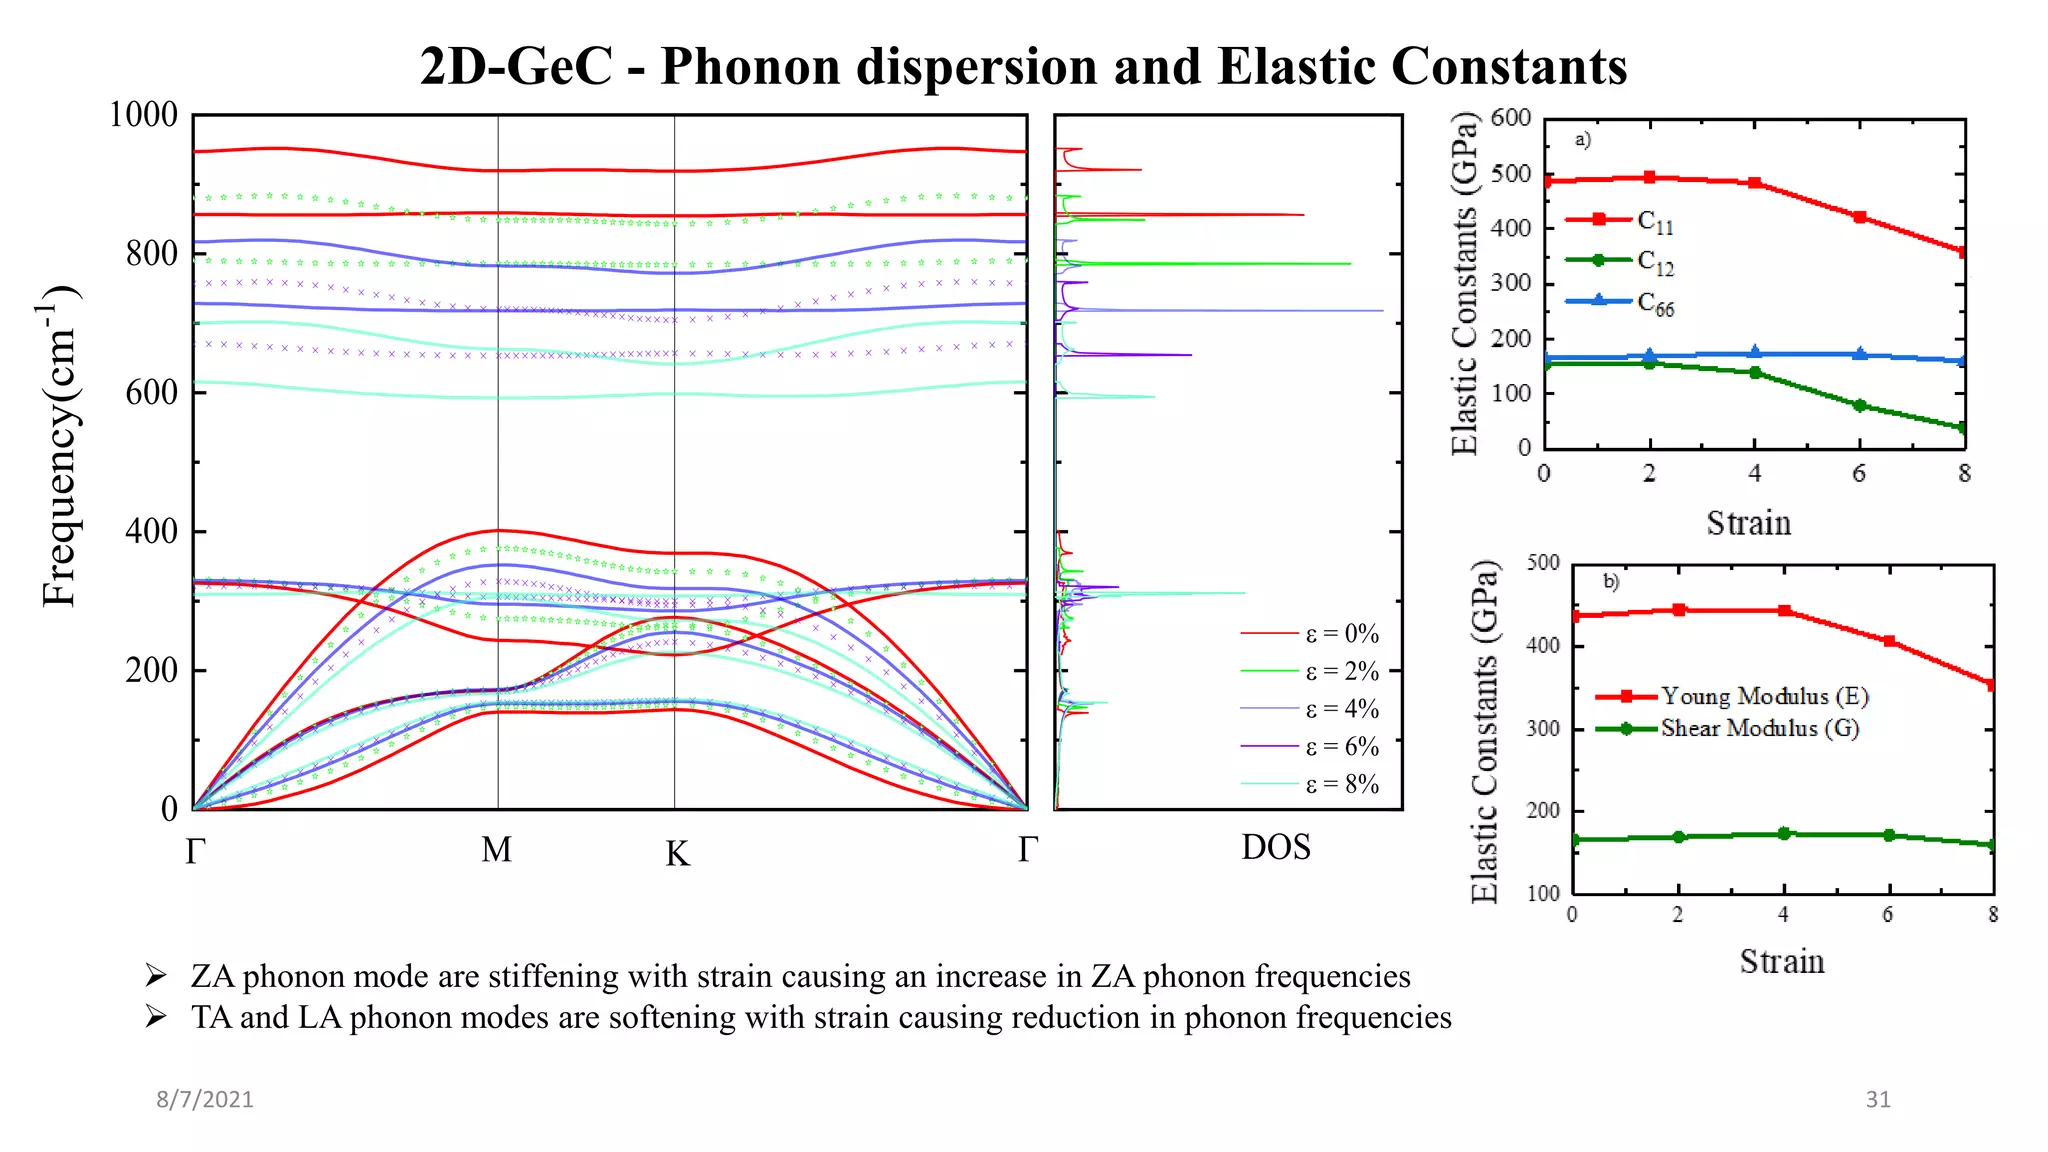


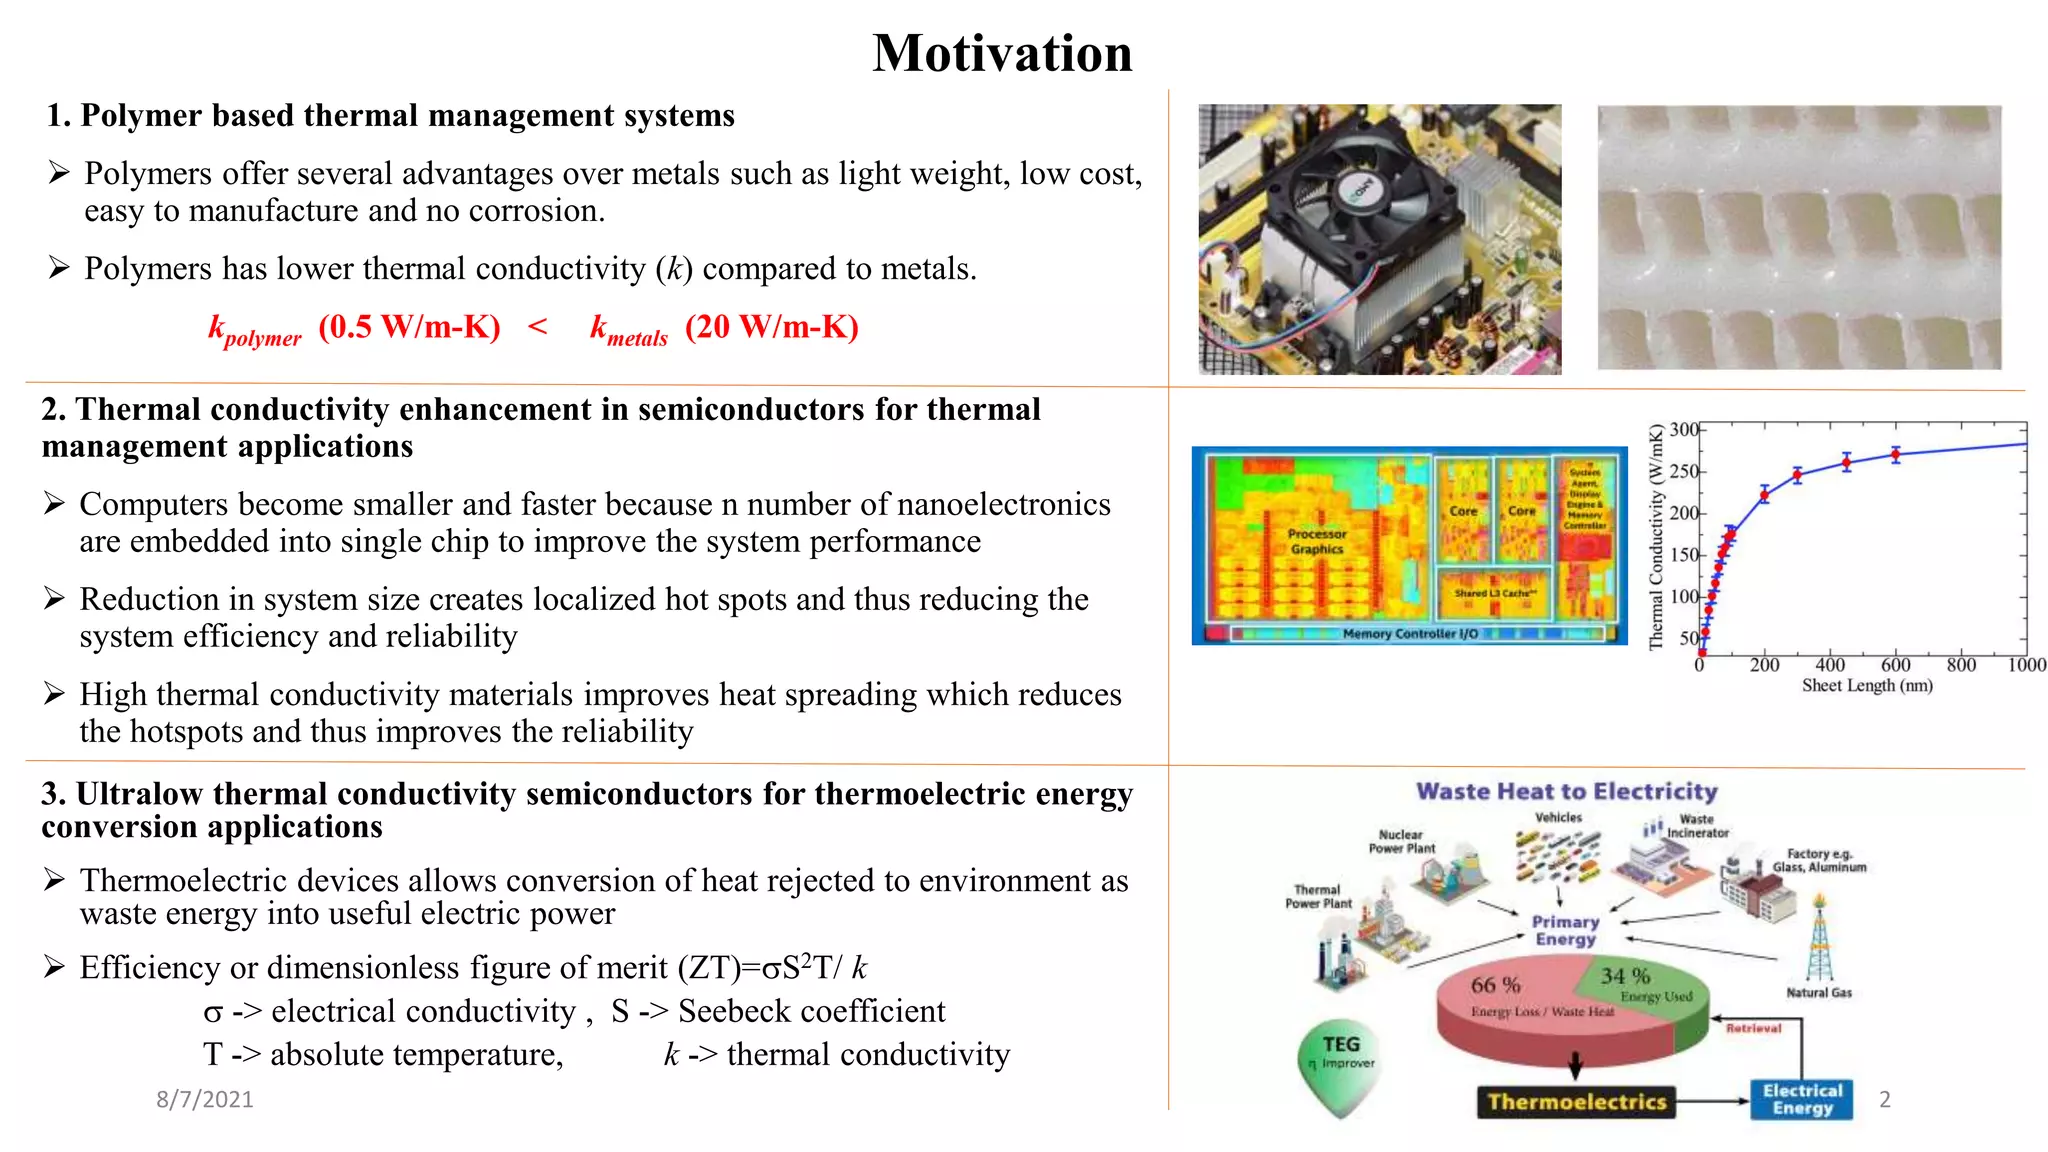
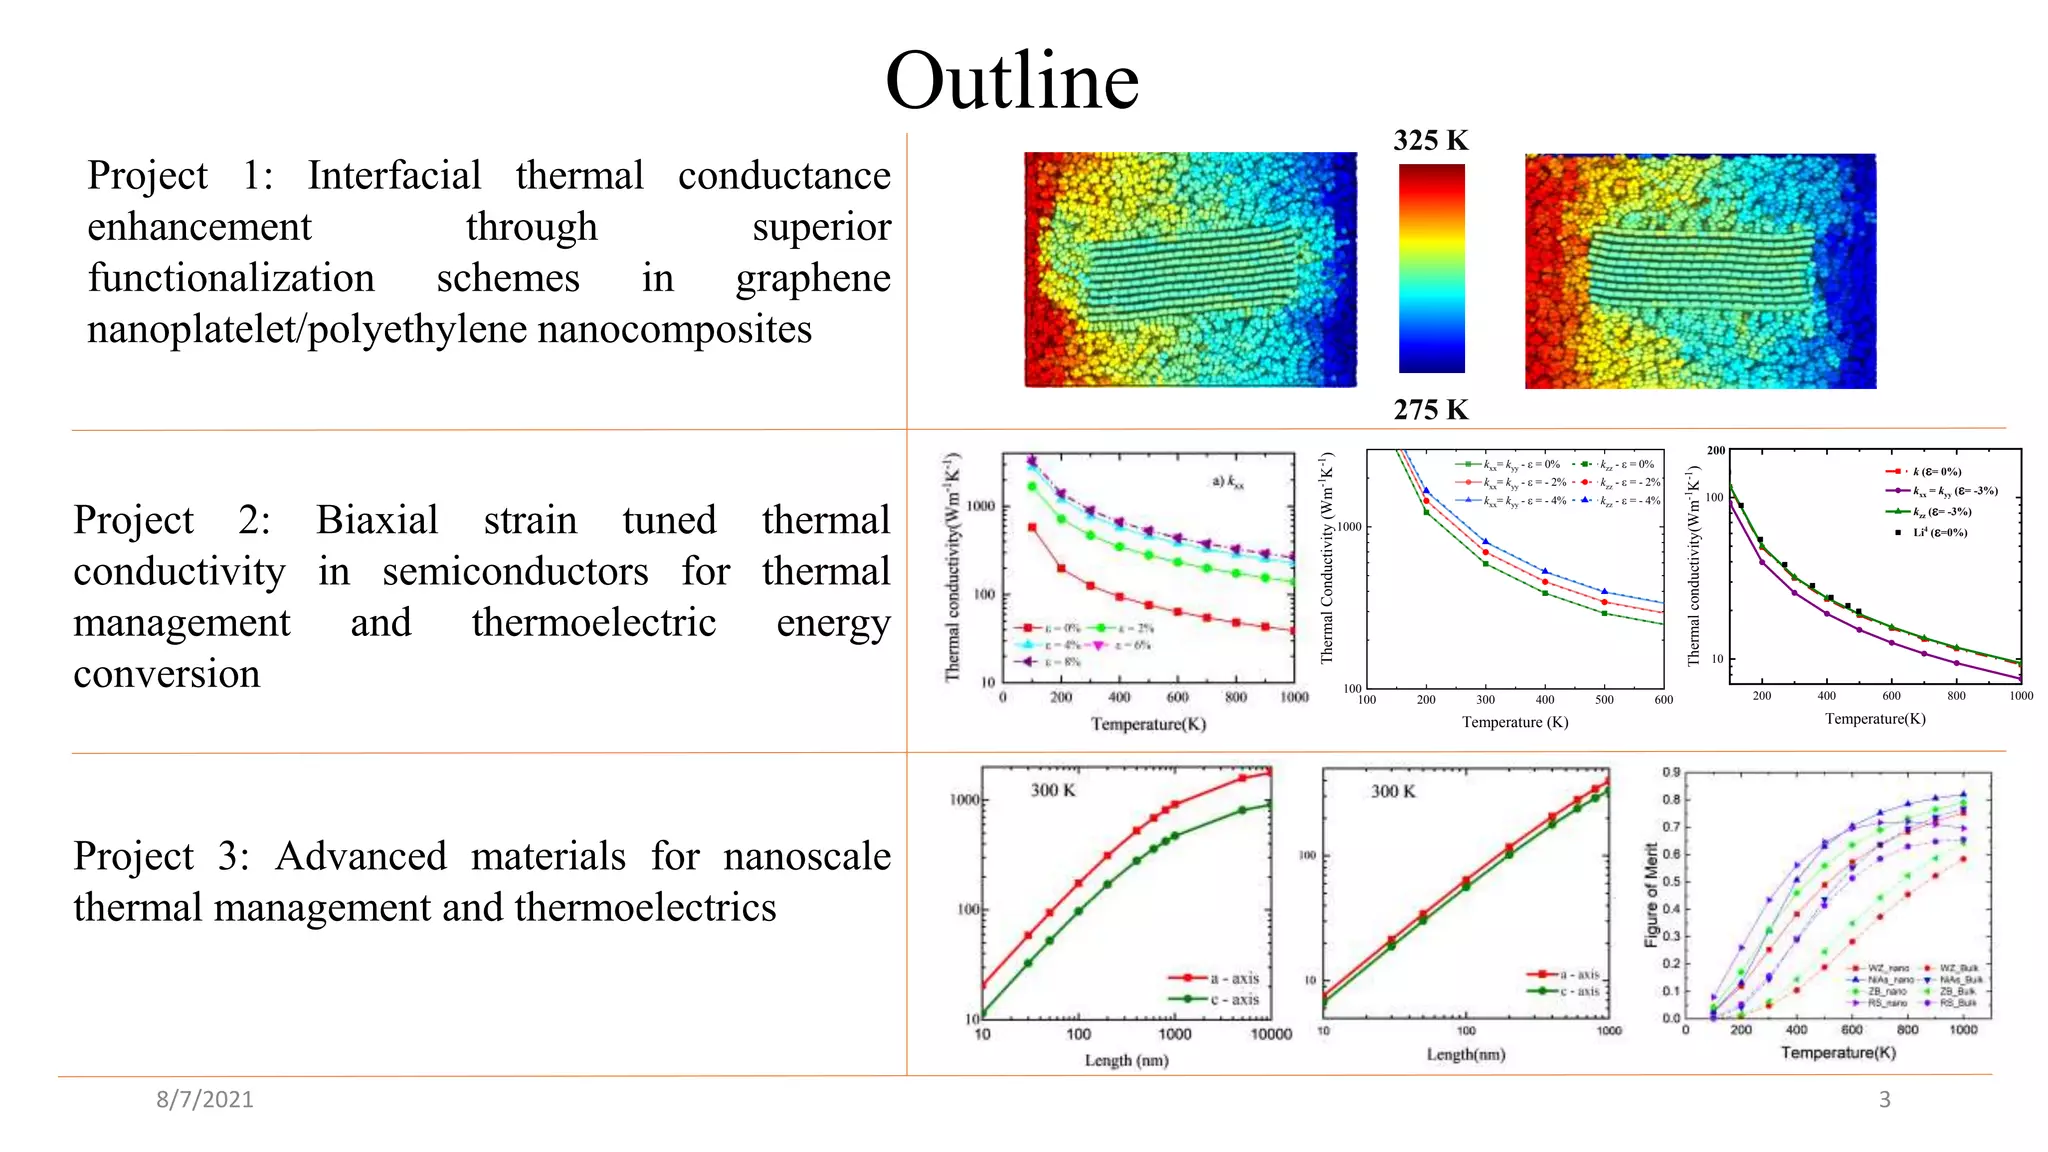
This document discusses the enhancement of thermal transport in polymers, polymer nanocomposites, and semiconductors using molecular dynamics simulations and first principles studies. It outlines three main projects that focus on interfacial thermal conductance in nanocomposites, the effects of biaxial strain on thermal conductivity in semiconductors, and the development of thermoelectric materials for energy conversion. The overall goal is to improve thermal management systems by utilizing advanced materials and methodologies to enhance thermal conductivity and system performance.


