Download to read offline

![Peninsula Health Financial Statements 2016 Page 59
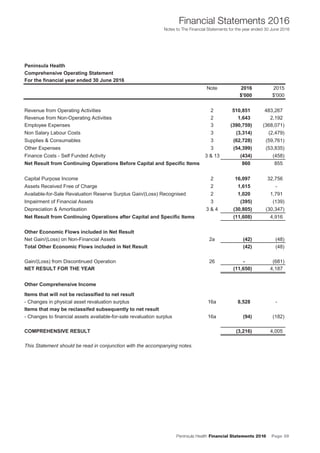
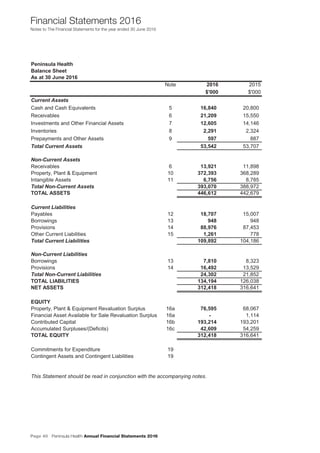
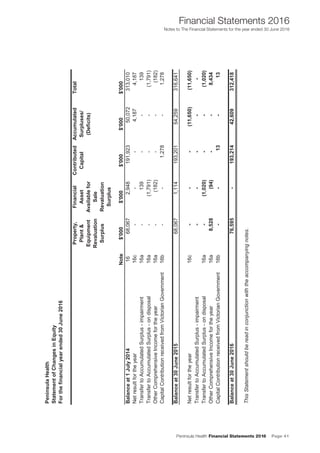
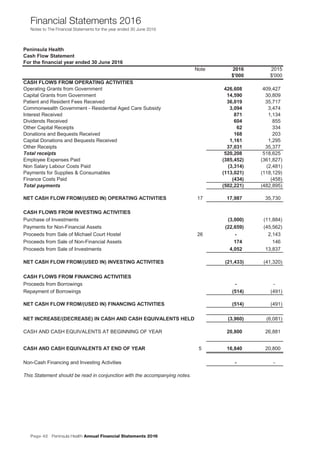
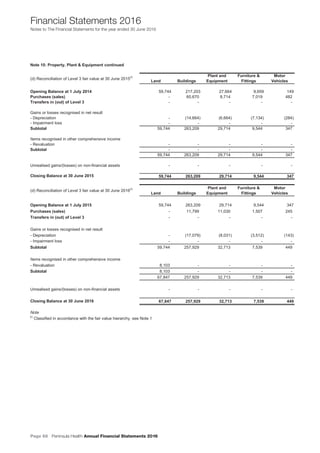
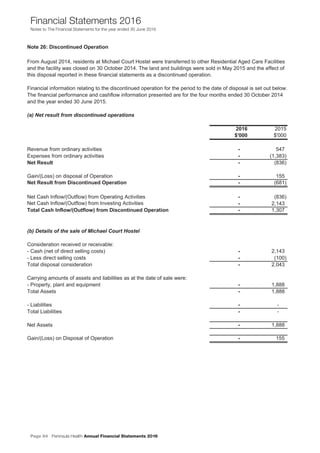
Financial Statements 2016
Notes to The Financial Statements for the year ended 30 June 2016
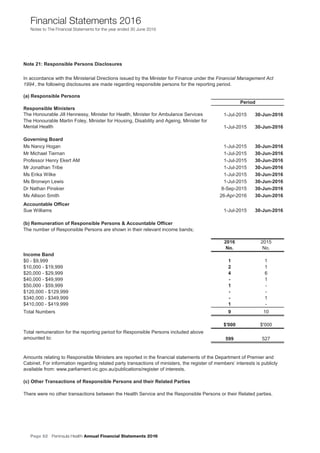
PPeenniinnssuullaa HHeeaalltthh AAnnnnuuaall FFiinnaanncciiaall SSttaatteemmeennttss 22001166
NNootteess ttoo TThhee FFiinnaanncciiaall SSttaatteemmeennttss ffoorr tthhee yyeeaarr eennddeedd 3300 JJuunnee 22001166
24
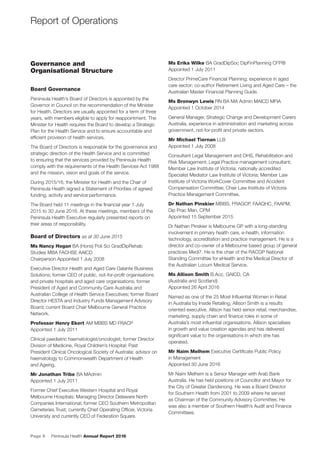
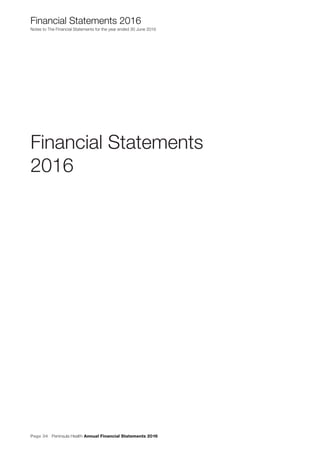
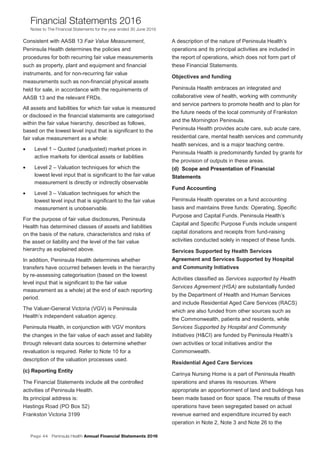
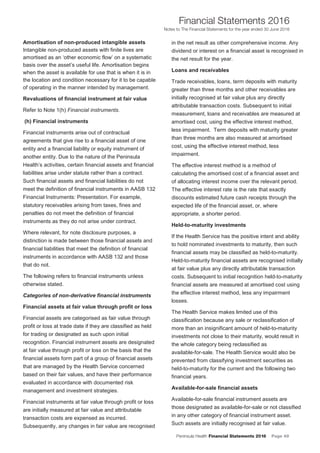
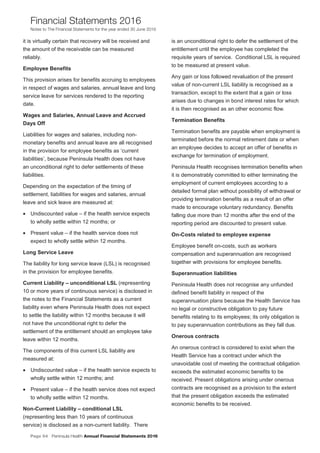
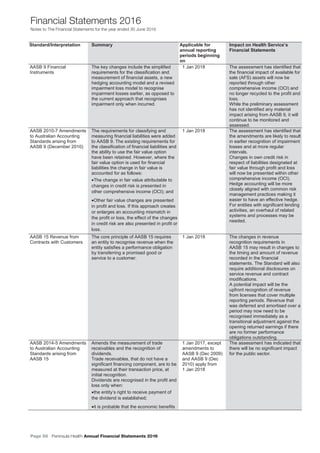
Standard/Interpretation Summary Applicable for
annual reporting
periods beginning
on
Impact on Health Service’s
Financial Statements
associated with the dividend will flow to
the entity; and
•the amount can be measured reliably.
AASB 16 Leases The key changes introduced by AASB 16
include the recognition of most operating
leases (which are current not recognised)
on balance sheet.
1 Jan 2019 The assessment has indicated that
as most operating leases will come
on balance sheet, recognition of
lease assets and lease liabilities
will cause net debt to increase.
Depreciation of lease assets and
interest on lease liabilities will be
recognised in the income
statement with marginal impact on
the operating surplus.
The amounts of cash paid for the
principal portion of the lease
liability will be presented within
financing activities and the
amounts paid for the interest
portion will be presented within
operating activities in the cash flow
statement.
No change for lessors.
AASB 2015-6 Amendments
to Australian Accounting
Standards – Extending
Related Party Disclosures
to Not-for-Profit Public
Sector Entities
[AASB 10, AASB 124 &
AASB 1049]
The Amendments extend the scope of
AASB 124 Related Party Disclosures to
not-for-profit public sector entities. A
guidance has been included to assist the
application of the Standard by not-for-
profit public sector entities.
1 Jan 2016 The amending standard will result
in extended disclosures on the
entity's key management
personnel (KMP), and the related
party transactions.
AASB 2016-4 Amendments
to Australian Accounting
Standards – Recoverable
Amount of Non-Cash-
Generating Specialised
Assets of Not-for-Profit
Entities
The standard amends AASB 136
Impairment of Assets to remove
references to using depreciated
replacement cost (DRC) as a measure of
value in use for not-for-profit entities.
1 Jan 2017 The assessment has indicated that
there is minimal impact. Given the
specialised nature and restrictions
of public sector assets, the existing
use is presumed to be the highest
and best use (HBU), hence current
replacement cost under AASB 13
Fair Value Measurement is the
same as the depreciated
replacement cost concept under
AASB 136.
In addition to the new standards above, the AASB has issued a list of other amending standards that are not effective for
the 2015-16 reporting period. In general, these amending standards include editorial and references changes that are
expected to have insignificant impacts on the Health Service.](https://image.slidesharecdn.com/0b28152a-5f6e-4d05-a4d8-f74a40eeb9ba-161027103200/85/Peninsula_Health_Report_Aug_2016-61-320.jpg)


This document provides an annual report for Peninsula Health for the 2015-2016 financial year. It includes key statistics and facts about the services provided by Peninsula Health including: over 235 babies born per month, over 95,000 visits to emergency departments, and over 800 volunteers. It summarizes the major projects undertaken in the last year including opening new facilities and beginning upgrades to existing buildings. It also outlines the strategic priorities and financial position of Peninsula Health.


