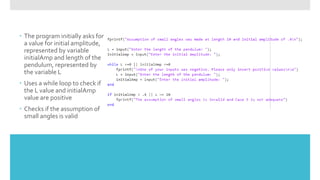
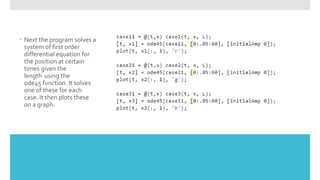
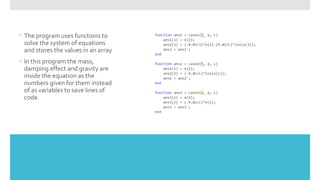
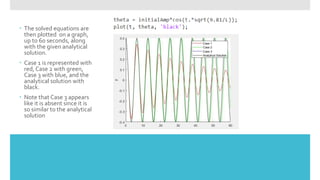
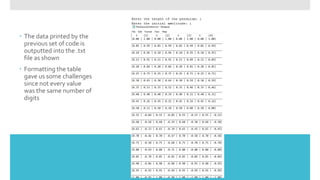
Pendulum Model
 The program initially asks for
a value for initial amplitude,
represented by variable
initialAmp and length of the
pendulum, represented by
the variable L
 Uses a while loop to check if
the L value and initialAmp
value are positive
 Checks if the assumption of
small angles is valid
 Next the program solves a
system of first order
differential equation for
the position at certain
times given the
length using the
ode45 function. It solves
one of these for each
case. It then plots these
on a graph.
 The program uses functions to
solve the system of equations
and stores the values in an array
 In this program the mass,
damping effect and gravity are
inside the equation as the
numbers given for them instead
of as variables to save lines of
code.
 The solved equations are
then plotted on a graph,
up to 60 seconds, along
with the given analytical
solution.
 Case 1 is represented with
red, Case 2 with green,
Case 3 with blue, and the
analytical solution with
black.
 Note that Case 3 appears
like it is absent since it is
so similar to the analytical
solution
 The program creates a
txt file named
"PendulumSolution.txt"
in write mode and adds
the data for each
solution into a table
 The first fprint
statement prints the
titles of each column
into the .txt file
 The for loop prints the
time and solution for
each of the cases
 Added "|" and "_"
symbols to create a
table
 The data printed by the
previous set of code is
outputted into the .txt
file as shown
 Formatting the table
gave us some challenges
since not every value
was the same number of
digits

PendulumModel.pptx

  • 1.
  • 2.
     The programinitially asks for a value for initial amplitude, represented by variable initialAmp and length of the pendulum, represented by the variable L  Uses a while loop to check if the L value and initialAmp value are positive  Checks if the assumption of small angles is valid
  • 3.
     Next theprogram solves a system of first order differential equation for the position at certain times given the length using the ode45 function. It solves one of these for each case. It then plots these on a graph.
  • 4.
     The programuses functions to solve the system of equations and stores the values in an array  In this program the mass, damping effect and gravity are inside the equation as the numbers given for them instead of as variables to save lines of code.
  • 5.
     The solvedequations are then plotted on a graph, up to 60 seconds, along with the given analytical solution.  Case 1 is represented with red, Case 2 with green, Case 3 with blue, and the analytical solution with black.  Note that Case 3 appears like it is absent since it is so similar to the analytical solution
  • 6.
     The programcreates a txt file named "PendulumSolution.txt" in write mode and adds the data for each solution into a table  The first fprint statement prints the titles of each column into the .txt file  The for loop prints the time and solution for each of the cases  Added "|" and "_" symbols to create a table
  • 7.
     The dataprinted by the previous set of code is outputted into the .txt file as shown  Formatting the table gave us some challenges since not every value was the same number of digits