SlideShare a Scribd company logo
1 of 16
Download to read offline
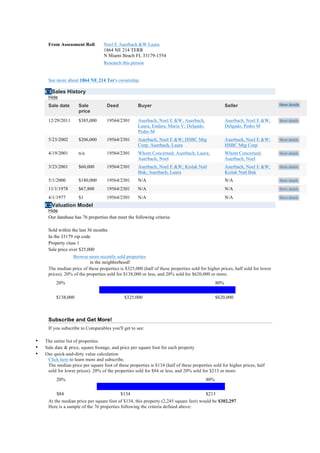
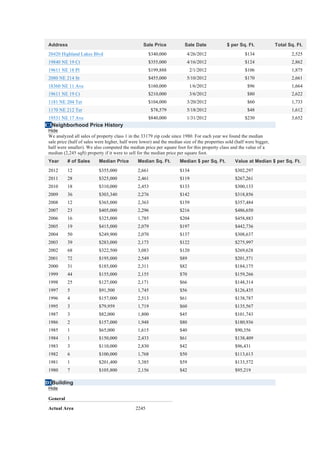
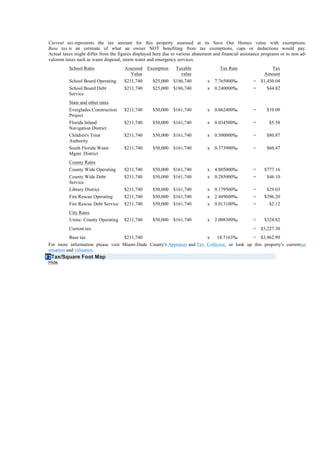
1864 NE 214 Ter, North Miami
 Beach, FL 33179
A1Your Notes
 Hide
 No notes found.


                                                         * Notes are private and cannot be seen by anyone else.

A2Photos
 Hide
                                    Upload photos for this property
 Other Photos: Google StreetView • Microsoft Bird's Eye View

A3Overview
 Hide

 Location

 Property Address                   1864 NE 214 Ter
                                    Miami, FL 33179
 Parcel ID                           3012330480150

 Legal Description

 Highland Gdns 3RD Addn Pb 105-71 Lot 23 Blk 7 Lot
 Size 80 X 100 Or 19149-4984 05 2000 1

 Land

 Zoning                 0100 - Single Family - General
 Property Class             Residential-Single Family
 Front Feet                                       80
 Depth of the land                                100
 line

 Most Recent Sale

 Sale date                                 12/29/2011
 Sale price                                 $385,000

 Market Value & Taxes
 Tax Year                                2011
 Total market value                   211740
 Property Tax                       $3,962.99

 Building

 Square Footage                         2,245
 Year Built                             1978
 Number of Stories                           1
 Bedrooms                                    3
 Bathrooms                                   2
 Number of Units                             1

A4Maps
 Hide
Click on the map to expand!
                          Link to Google Maps
                           Link to Yahoo Maps
                         Link to MapQuest Maps
B1Ownership Summary
 Hide
From Assessment Roll         Noel E Auerbach &W Laura
                                      1864 NE 214 TERR
                                      N Miami Beach FL 33179-1554
                                      Research this person


         See more about 1864 NE 214 Ter's ownership.

        C1Sales History
         Hide
         Sale date       Sale           Deed             Buyer                                          Seller                    Show details
                         price
         12/29/2011      $385,000       19564/2301       Auerbach, Noel E &W; Auerbach,                 Auerbach, Noel E &W;      Show details
                                                         Laura; Endara, Maria V; Delgado,               Delgado, Pedro M
                                                         Pedro M
         5/23/2002       $206,000       19564/2301       Auerbach, Noel E &W; HSBC Mtg                  Auerbach, Noel E &W;      Show details
                                                         Corp; Auerbach, Laura                          HSBC Mtg Corp
         4/19/2001       n/a            19564/2301       Whom Concerned; Auerbach, Laura;               Whom Concerned;           Show details
                                                         Auerbach, Noel                                 Auerbach, Noel
         3/23/2001       $60,000        19564/2301       Auerbach, Noel E &W; Kislak Natl               Auerbach, Noel E &W;      Show details
                                                         Bnk; Auerbach, Laura                           Kislak Natl Bnk
         5/1/2000        $180,000       19564/2301       N/A                                            N/A                       Show details

         11/1/1978       $67,800        19564/2301       N/A                                            N/A                       Show details

         4/1/1977        $1             19564/2301       N/A                                            N/A                       Show details

        C2Valuation Model
         Hide
         Our database has 76 properties that meet the following criteria:

    •    Sold within the last 36 months
    •    In the 33179 zip code
    •    Property class 1
    •    Sale price over $25,000
                     Browse more recently sold properties
                               in the neighborhood!
         The median price of these properties is $325,000 (half of these properties sold for higher prices, half sold for lower
         prices). 20% of the properties sold for $138,000 or less, and 20% sold for $620,000 or more.
             20%                                                                                  80%


             $138,000                            $325,000                                         $620,000


         Subscribe and Get More!
         If you subscribe to Comparables you'll get to see:

•       The entire list of properties
•       Sale date & price, square footage, and price per square foot for each property
•       Our quick-and-dirty value calculation
         Click here to learn more and subscribe.
         The median price per square foot of these properties is $134 (half of these properties sold for higher prices, half
         sold for lower prices). 20% of the properties sold for $84 or less, and 20% sold for $213 or more.
              20%                                                                           80%


              $84                              $134                                         $213
         At the median price per square foot of $134, this property (2,245 square feet) would be $302,297.
         Here is a sample of the 76 properties following the criteria defined above:
Address                                           Sale Price            Sale Date             $ per Sq. Ft.             Total Sq. Ft.
 20420 Highland Lakes Blvd                            $340,000            4/26/2012                      $134                   2,525
 19840 NE 19 Ct                                       $355,000            4/16/2012                      $124                   2,862
 19611 NE 18 Pl                                       $199,888              2/1/2012                     $106                   1,875
 2080 NE 214 St                                       $455,000            5/10/2012                      $170                   2,661
 18360 NE 11 Ave                                      $160,000              1/6/2012                      $96                   1,664
 19611 NE 19 Ct                                       $210,000              3/6/2012                      $80                   2,622
 1181 NE 204 Ter                                      $104,000            3/20/2012                       $60                   1,733
 1170 NE 212 Ter                                        $78,579           5/18/2012                       $48                   1,612
 19531 NE 17 Ave                                      $840,000            1/31/2012                      $230                   3,652
C3Neighborhood Price History
 Hide
 We analyzed all sales of property class 1 in the 33179 zip code since 1980. For each year we found the median
 sale price (half of sales were higher, half were lower) and the median size of the properties sold (half were bigger,
 half were smaller). We also computed the median price per square foot for this property class and the value of a
 median (2,245 sqft) property if it were to sell for the median price per square foot.
 Year      # of Sales      Median Price         Median Sq. Ft.        Median $ per Sq. Ft.          Value at Median $ per Sq. Ft.
 2012      12              $355,000             2,661                 $134                          $302,297
 2011      28              $325,000             2,461                 $119                          $267,261
 2010      18              $310,000             2,453                 $133                          $300,133
 2009      36              $303,340             2,276                 $142                          $318,856
 2008      12              $365,000             2,363                 $159                          $357,484
 2007      23              $405,000             2,296                 $216                          $486,650
 2006      16              $325,000             1,785                 $204                          $458,883
 2005      19              $415,000             2,079                 $197                          $442,736
 2004      50              $249,900             2,070                 $137                          $308,637
 2003      39              $283,000             2,173                 $122                          $275,997
 2002      68              $322,500             3,083                 $120                          $269,628
 2001      72              $195,000             2,549                 $89                           $201,571
 2000      31              $185,000             2,311                 $82                           $184,175
 1999      44              $155,000             2,155                 $70                           $159,266
 1998      25              $127,000             2,171                 $66                           $148,314
 1997      5               $91,500              1,745                 $56                           $126,435
 1996      4               $157,000             2,513                 $61                           $138,787
 1995      3               $79,959              1,719                 $60                           $135,567
 1987      3               $82,000              1,800                 $45                           $101,743
 1986      2               $157,000             1,948                 $80                           $180,936
 1985      1               $65,000              1,615                 $40                           $90,356
 1984      1               $150,000             2,433                 $61                           $138,409
 1983      3               $110,000             2,830                 $42                           $96,431
 1982      6               $100,000             1,768                 $50                           $113,613
 1981      1               $201,400             3,385                 $59                           $133,572
 1980      7               $105,800             2,156                 $42                           $95,219

D1Building
 Hide

 General

 Actual Area                                   2245
Actual Year Built                           1978

 Details
 Effective Year Built                         1978
 Quality Code                                     1

 Improvements
 Description                                                                      Finished
 Exterior Wall                                                                    100%
 Electrical                                                                       100%
 Interior Walls                                                                   100%
 Plumbing                                                                         100%
 Roofing Structure                                                                100%
 Roofing Cover                                                                    100%
 Interior Flooring                                                                100%

 Extra Features
 Property Use                                              Year Built             Effective Year Built                  Units
 Patio - Screened Over Concrete Slab                       1978                   1978                                  468

E1Building Permits
 Hide
 Issue Date          Permit Number         Permit Type         Categories             Inspection Disposition           Show details

 12/29/2004          2005026435            PLUM                Pool piping            Approved                         Show details

 12/29/2004          2005026438            ELEC                Swimming pools         Approved                         Show details

 12/28/2004          2005026122            BLDG                Swimming pool          Approved                         Show details


F1Property Tax
 Hide
 The Florida Property Tax Statute and the Florida State Constitution are the main legal documents regarding taxation in the State of
 Florida. Taxes are determined at local levels, being used for schools, fire and police protection, and other public services and
 benefits.
 Market Value

 Market value is the price a property would sell for when both buyer and seller seek the best price and neither is under pressure to
 buy or sell. Market values in Florida are evaluated as of January 1, based upon sales of comparable properties in the previous year.

 This property benefits from Save Our Homes limitation of assessed value. The annual increase of assessed values in is limited to: 1)
 3% greater than the prior year, or 2) the percentage change in the Consumer Price Index, whichever is lower. For 2012, the rate of
 increase is 3% - actual cap rate will vary yearly.
                                                Market         =   $211,740
                                                value
 Assessed Value

 In State of Florida all properties are reassessed every year at 100% of the market value, however, there are several assessment
 reductions, limitations or caps that may apply.

                                                Assessed       =   $211,740
                                                value
 Property Tax

 Exemptions are available in Florida which may reduce the tax bill. These are deducted from the assessed value to give the
 property's taxable                                                                                                 value.

 Property tax in Miami-Dade County is calculated by multiplying the taxable value with the corresponding millage rates.
Current tax represents the tax amount for this property assessed at its Save Our Homes value with exemptions.
 Base tax is an estimate of what an owner NOT benefiting from tax exemptions, caps or deductions would pay.
 Actual taxes might differ from the figures displayed here due to various abatement and financial assistance programs or to non ad-
 valorem taxes such as waste disposal, storm water and emergency services.
           School Rates                Assessed   Exemption      Taxable               Tax Rate                  Tax
                                          Value                    value                                     Amount
           School Board Operating      $211,740      $25,000    $186,740         x   7.765000‰          =   $1,450.04
           School Board Debt           $211,740      $25,000    $186,740         x   0.240000‰          =      $44.82
           Service
           State and other rates
           Everglades Construction     $211,740      $50,000    $161,740         x   0.062400‰          =      $10.09
           Project
           Florida Inland              $211,740      $50,000    $161,740         x   0.034500‰          =       $5.58
           Navigation District
           Children's Trust            $211,740      $50,000    $161,740         x   0.500000‰          =      $80.87
           Authority
           South Florida Water         $211,740      $50,000    $161,740         x   0.373900‰          =      $60.47
           Mgmt. District
           County Rates
           County Wide Operating       $211,740      $50,000    $161,740         x   4.805000‰          =    $777.16
           County Wide Debt            $211,740      $50,000    $161,740         x   0.285000‰          =      $46.10
           Service
           Library District            $211,740      $50,000    $161,740         x   0.179500‰          =      $29.03
           Fire Rescue Operating       $211,740      $50,000    $161,740         x   2.449600‰          =    $396.20
           Fire Rescue Debt Service    $211,740      $50,000    $161,740         x   0.013100‰          =       $2.12
           City Rates
           Uninc. County Operating     $211,740      $50,000    $161,740         x   2.008300‰          =    $324.82
           Current tax                                                                                  =   $3,227.30
            Base tax               $211,740                              x    18.7163‰        = $3,962.99
 For more information please visit Miami-Dade County's Appraiser and Tax Collector, or look up this property's currenttax
 situation and valuation.
F2Tax/Square Foot Map
 Hide
Click on the map to expand!

Tax per Square Foot
Legend
On this map, you can see the tax value paid per square foot for
 this property.
F3Assessment History
 Hide
 Year      Property class                    Market value          Assessment value      Total tax rate     Property tax
 2011      Residential-Single Family         $211,740              $211,740              18.7163‰           $3,962.99
 2010      Residential-Single Family         $257,038              $208,611              20.4573‰           $4,785.33
 2009      Residential-Single Family         $203,127              $203,127              18.6172‰           $3,781.66
 2008      Residential-Single Family         $403,482              $403,482              18.5679‰           $7,491.81
 2007      Residential-Single Family         $451,194              $451,194              20.7468‰           $9,360.83
 2006      Residential-Single Family         $415,895              $415,895              20.7468‰           $8,628.49
G1Neighbors
 Hide
 Link to address                  Property Class                   Gross sqft         Sale date           Sale price
 1844 NE 214 Ter                  1                                2,611              9/19/2001           $50,000
 2020 NE 214 Ter                  1                                2,421              11/4/1993           n/a
 2040 NE 214 Ter                  1                                2,554              8/16/2004           $407,000
 2050 NE 214 Ter                  1                                2,422              10/18/2006          $595,000


G2Demographics By Tract
 Hide
 Tract number                                          9701
 Total population                                      3373

 Housing

 Owners                                             77%
 Average occupants per room                           1
 Average year structure built                       1965
 Average year moved in                              1981
 Average units in structure                            2

 Wealth
 Median house value                              $87,500
 Median rent                                        $666
 Renters spending <35% of income on                 82%
 housing
 Owners spending <50% of income on                  94%
 housing
 Population in poverty                                4%

 Race & Ethnicity
 White                                           97%
 Black or African American                        1%
Asian                                              1%

 Education
 College graduates                                21%
 High school graduates                            38%

 Other
 Average age                                        37
 Citizens                                         99%
 English speakers                                 36%

 Economic/Employment

 Median household income                          $46,250
 Household income-Employed or retired                80%
 Employment status-Employed                            4%

 Transportation

 Commuting by own vehicle                           93%
 Average travel time to work (min)                    27
H1Fema Flood Zones Map
 Hide
 On this map, you can see if the property is located in a special flood hazard area.


                                            Click on the map to expand!
                                   Find out more about: FEMA Flood Hazard Map
 Legend


H2Environmental Information
 Hide
 This section contains information about environmental matters such as air releases, drinking water, toxic releases,
 hazardous wastes, water discharge permits and Superfund sites. The picture below shows any environmental
 concerns that exist in the area surrounding the property. For more information, click on the picture or on the links
 at the end of the section.

 Regulated facilities
 Sorry, we don't have any information for this property                                                                 Legend

 See other environmental information
 Try EPA EnviroMapper StoreFront

Disclaimer
 Copyright 2003-2012 by PropertyShark.com

 All data comes from government sources. No attempt has been made to validate it. No attempt has been made to
 validate the accuracy of the programming of this web site. Do not rely on this report to support investment
 decisions. The only authoritative source for the information in this report is the government agencies from which
 the data was acquired.
 

More Related Content

What's hot

Weekly Verde Valley Real Estate Transaction Report
Weekly Verde Valley Real Estate Transaction ReportWeekly Verde Valley Real Estate Transaction Report
Weekly Verde Valley Real Estate Transaction ReportDamian Bruno
 
Verde Valley Weekly Real Estate Transaction Report 2010-10-18
Verde Valley Weekly Real Estate Transaction Report 2010-10-18Verde Valley Weekly Real Estate Transaction Report 2010-10-18
Verde Valley Weekly Real Estate Transaction Report 2010-10-18Damian Bruno
 
H W 2010 Q1 De 12 Mo
H W 2010 Q1 De 12 MoH W 2010 Q1 De 12 Mo
H W 2010 Q1 De 12 Mochipwags
 
Chicago Real Estate Market Data - Broken Down by City
Chicago Real Estate Market Data - Broken Down by CityChicago Real Estate Market Data - Broken Down by City
Chicago Real Estate Market Data - Broken Down by Citybethrepta
 
Wag Report 2009 Q4 De 12 Mo
Wag Report 2009 Q4 De 12 MoWag Report 2009 Q4 De 12 Mo
Wag Report 2009 Q4 De 12 Mochipwags
 
Verde Valley weekly report
Verde Valley weekly reportVerde Valley weekly report
Verde Valley weekly reportDamian Bruno
 
Weekly Verde Valley Real Estate Transaction Report
Weekly Verde Valley Real Estate Transaction ReportWeekly Verde Valley Real Estate Transaction Report
Weekly Verde Valley Real Estate Transaction ReportDamian Bruno
 
Weekly Verde Valley Real Estate Transaction Report
Weekly Verde Valley Real Estate Transaction ReportWeekly Verde Valley Real Estate Transaction Report
Weekly Verde Valley Real Estate Transaction ReportDamian Bruno
 
The True Cost of Mortgage Debt Part One
The True Cost of Mortgage Debt Part OneThe True Cost of Mortgage Debt Part One
The True Cost of Mortgage Debt Part OneJorie Teal
 
ecolab 2003BusinessDescription
ecolab  2003BusinessDescriptionecolab  2003BusinessDescription
ecolab 2003BusinessDescriptionfinance37
 
Ejercicios con referencias, filtros4
Ejercicios con referencias, filtros4Ejercicios con referencias, filtros4
Ejercicios con referencias, filtros4Mayte Cuadrado
 
Weekly Sedona Verde Valley Foreclosure Short Sale Transaction Report
Weekly Sedona Verde Valley Foreclosure Short Sale Transaction ReportWeekly Sedona Verde Valley Foreclosure Short Sale Transaction Report
Weekly Sedona Verde Valley Foreclosure Short Sale Transaction ReportDamian Bruno
 
Weekly Verde Valley Real Estate Transaction Report
Weekly Verde Valley Real Estate Transaction ReportWeekly Verde Valley Real Estate Transaction Report
Weekly Verde Valley Real Estate Transaction ReportDamian Bruno
 
Vancouver real estate rebgv stats package january 2011
Vancouver real estate rebgv stats package january 2011Vancouver real estate rebgv stats package january 2011
Vancouver real estate rebgv stats package january 2011Matt Collinge
 
Rent vs. Own
Rent vs. OwnRent vs. Own
Rent vs. OwnARGSALES
 
November 2011-rebgv-stats-adam scalena
November 2011-rebgv-stats-adam scalenaNovember 2011-rebgv-stats-adam scalena
November 2011-rebgv-stats-adam scalenavancouverhomesteam
 

What's hot (20)

Weekly Verde Valley Real Estate Transaction Report
Weekly Verde Valley Real Estate Transaction ReportWeekly Verde Valley Real Estate Transaction Report
Weekly Verde Valley Real Estate Transaction Report
 
Toronto Central Market Watch
Toronto Central Market WatchToronto Central Market Watch
Toronto Central Market Watch
 
Verde Valley Weekly Real Estate Transaction Report 2010-10-18
Verde Valley Weekly Real Estate Transaction Report 2010-10-18Verde Valley Weekly Real Estate Transaction Report 2010-10-18
Verde Valley Weekly Real Estate Transaction Report 2010-10-18
 
H W 2010 Q1 De 12 Mo
H W 2010 Q1 De 12 MoH W 2010 Q1 De 12 Mo
H W 2010 Q1 De 12 Mo
 
Chicago Real Estate Market Data - Broken Down by City
Chicago Real Estate Market Data - Broken Down by CityChicago Real Estate Market Data - Broken Down by City
Chicago Real Estate Market Data - Broken Down by City
 
3025 finch
3025 finch3025 finch
3025 finch
 
Wag Report 2009 Q4 De 12 Mo
Wag Report 2009 Q4 De 12 MoWag Report 2009 Q4 De 12 Mo
Wag Report 2009 Q4 De 12 Mo
 
Verde Valley weekly report
Verde Valley weekly reportVerde Valley weekly report
Verde Valley weekly report
 
Weekly Verde Valley Real Estate Transaction Report
Weekly Verde Valley Real Estate Transaction ReportWeekly Verde Valley Real Estate Transaction Report
Weekly Verde Valley Real Estate Transaction Report
 
Weekly Verde Valley Real Estate Transaction Report
Weekly Verde Valley Real Estate Transaction ReportWeekly Verde Valley Real Estate Transaction Report
Weekly Verde Valley Real Estate Transaction Report
 
The True Cost of Mortgage Debt Part One
The True Cost of Mortgage Debt Part OneThe True Cost of Mortgage Debt Part One
The True Cost of Mortgage Debt Part One
 
ecolab 2003BusinessDescription
ecolab  2003BusinessDescriptionecolab  2003BusinessDescription
ecolab 2003BusinessDescription
 
Arguello practica 3,2
Arguello practica 3,2Arguello practica 3,2
Arguello practica 3,2
 
Ejercicios con referencias, filtros4
Ejercicios con referencias, filtros4Ejercicios con referencias, filtros4
Ejercicios con referencias, filtros4
 
Weekly Sedona Verde Valley Foreclosure Short Sale Transaction Report
Weekly Sedona Verde Valley Foreclosure Short Sale Transaction ReportWeekly Sedona Verde Valley Foreclosure Short Sale Transaction Report
Weekly Sedona Verde Valley Foreclosure Short Sale Transaction Report
 
Weekly Verde Valley Real Estate Transaction Report
Weekly Verde Valley Real Estate Transaction ReportWeekly Verde Valley Real Estate Transaction Report
Weekly Verde Valley Real Estate Transaction Report
 
Vancouver real estate rebgv stats package january 2011
Vancouver real estate rebgv stats package january 2011Vancouver real estate rebgv stats package january 2011
Vancouver real estate rebgv stats package january 2011
 
Rent vs. Own
Rent vs. OwnRent vs. Own
Rent vs. Own
 
Rent vs. Own
Rent vs. OwnRent vs. Own
Rent vs. Own
 
November 2011-rebgv-stats-adam scalena
November 2011-rebgv-stats-adam scalenaNovember 2011-rebgv-stats-adam scalena
November 2011-rebgv-stats-adam scalena
 

Similar to Pedro delgado reporte

BPO Lite With Inspection
BPO Lite With InspectionBPO Lite With Inspection
BPO Lite With InspectionV2Shane
 
Agent Production Report
Agent Production ReportAgent Production Report
Agent Production Reportcjharrington
 
Tax Data on Sen. Galuteria's Palolo Property
Tax Data on Sen. Galuteria's Palolo PropertyTax Data on Sen. Galuteria's Palolo Property
Tax Data on Sen. Galuteria's Palolo PropertyHonolulu Civil Beat
 
Real Estate Market Report for Stoney Hill Condominiums in Westfield, MA
Real Estate Market Report for Stoney Hill Condominiums in Westfield, MAReal Estate Market Report for Stoney Hill Condominiums in Westfield, MA
Real Estate Market Report for Stoney Hill Condominiums in Westfield, MALesley Lambert
 
Paragon plantation Capital Brokers
Paragon plantation   Capital BrokersParagon plantation   Capital Brokers
Paragon plantation Capital BrokersCapitalBrokers
 
Valu Clear Sample Report
Valu Clear Sample ReportValu Clear Sample Report
Valu Clear Sample ReportBranGol
 
Vreb Statistical Digest March2011
Vreb Statistical Digest March2011Vreb Statistical Digest March2011
Vreb Statistical Digest March2011Tara Lynn
 
Ejercicios con referencias, filtros
Ejercicios con referencias, filtros Ejercicios con referencias, filtros
Ejercicios con referencias, filtros Johanna Castro
 
Weekly Sedona Verde Valley Foreclosure Short Sale Transaction Report
Weekly Sedona Verde Valley Foreclosure Short Sale Transaction ReportWeekly Sedona Verde Valley Foreclosure Short Sale Transaction Report
Weekly Sedona Verde Valley Foreclosure Short Sale Transaction ReportDamian Bruno
 

Similar to Pedro delgado reporte (20)

BPO Lite With Inspection
BPO Lite With InspectionBPO Lite With Inspection
BPO Lite With Inspection
 
South Orange NJ Real Estate Sales: November 2011
South Orange NJ Real Estate Sales: November 2011South Orange NJ Real Estate Sales: November 2011
South Orange NJ Real Estate Sales: November 2011
 
Agent Production Report
Agent Production ReportAgent Production Report
Agent Production Report
 
2017 Q1 Mission Bay
2017 Q1 Mission Bay2017 Q1 Mission Bay
2017 Q1 Mission Bay
 
Tax Data on Sen. Galuteria's Palolo Property
Tax Data on Sen. Galuteria's Palolo PropertyTax Data on Sen. Galuteria's Palolo Property
Tax Data on Sen. Galuteria's Palolo Property
 
Llangari practica3
Llangari practica3Llangari practica3
Llangari practica3
 
Real Estate Market Report for Stoney Hill Condominiums in Westfield, MA
Real Estate Market Report for Stoney Hill Condominiums in Westfield, MAReal Estate Market Report for Stoney Hill Condominiums in Westfield, MA
Real Estate Market Report for Stoney Hill Condominiums in Westfield, MA
 
Las Vegas Investment properties
Las Vegas Investment propertiesLas Vegas Investment properties
Las Vegas Investment properties
 
Paragon plantation Capital Brokers
Paragon plantation   Capital BrokersParagon plantation   Capital Brokers
Paragon plantation Capital Brokers
 
Valu Clear Sample Report
Valu Clear Sample ReportValu Clear Sample Report
Valu Clear Sample Report
 
Vreb Statistical Digest March2011
Vreb Statistical Digest March2011Vreb Statistical Digest March2011
Vreb Statistical Digest March2011
 
Excel 3
Excel 3Excel 3
Excel 3
 
5 filtros
5 filtros 5 filtros
5 filtros
 
Práctica de excel 3
Práctica de excel 3Práctica de excel 3
Práctica de excel 3
 
1bed
1bed1bed
1bed
 
Ejercicios con referencias, filtros
Ejercicios con referencias, filtros Ejercicios con referencias, filtros
Ejercicios con referencias, filtros
 
South Orange NJ Home Sales: January 2012
South Orange NJ Home Sales: January 2012South Orange NJ Home Sales: January 2012
South Orange NJ Home Sales: January 2012
 
Maria reino ejercicios con referencias, filtros
Maria reino ejercicios con referencias, filtrosMaria reino ejercicios con referencias, filtros
Maria reino ejercicios con referencias, filtros
 
Millburn/Short Hills NJ Home Sales: January 2012
Millburn/Short Hills NJ Home Sales: January 2012Millburn/Short Hills NJ Home Sales: January 2012
Millburn/Short Hills NJ Home Sales: January 2012
 
Weekly Sedona Verde Valley Foreclosure Short Sale Transaction Report
Weekly Sedona Verde Valley Foreclosure Short Sale Transaction ReportWeekly Sedona Verde Valley Foreclosure Short Sale Transaction Report
Weekly Sedona Verde Valley Foreclosure Short Sale Transaction Report
 

More from Galo Lara Yepez (20)

Titulo falsificado de pedro delgado
Titulo falsificado de pedro delgadoTitulo falsificado de pedro delgado
Titulo falsificado de pedro delgado
 
Espol
EspolEspol
Espol
 
Tv satelital
Tv satelitalTv satelital
Tv satelital
 
Adjunto sobre denuncia a Glas Espinel
Adjunto sobre denuncia a Glas EspinelAdjunto sobre denuncia a Glas Espinel
Adjunto sobre denuncia a Glas Espinel
 
Denuncia a Glas Espinel
Denuncia a Glas EspinelDenuncia a Glas Espinel
Denuncia a Glas Espinel
 
Oficio baltazar garzón
Oficio baltazar garzónOficio baltazar garzón
Oficio baltazar garzón
 
Oficio a Ministra de Justicia
Oficio a Ministra de JusticiaOficio a Ministra de Justicia
Oficio a Ministra de Justicia
 
Email 1
Email 1Email 1
Email 1
 
COFIEC entregó préstamo a Duzac pese a tener historial financiero negativo
COFIEC entregó préstamo a Duzac pese a tener historial financiero negativoCOFIEC entregó préstamo a Duzac pese a tener historial financiero negativo
COFIEC entregó préstamo a Duzac pese a tener historial financiero negativo
 
Proyecto codigo etica
Proyecto codigo eticaProyecto codigo etica
Proyecto codigo etica
 
Formulario declaracionjurada
Formulario declaracionjuradaFormulario declaracionjurada
Formulario declaracionjurada
 
Pedro delgado
Pedro delgadoPedro delgado
Pedro delgado
 
Img445
Img445Img445
Img445
 
Img444
Img444Img444
Img444
 
Img443
Img443Img443
Img443
 
Img442
Img442Img442
Img442
 
Img441
Img441Img441
Img441
 
Img440
Img440Img440
Img440
 
Img439
Img439Img439
Img439
 
Img438
Img438Img438
Img438
 

Recently uploaded

Brief biography of Julius Robert Oppenheimer
Brief biography of Julius Robert OppenheimerBrief biography of Julius Robert Oppenheimer
Brief biography of Julius Robert OppenheimerOmarCabrera39
 
Dynamics of Destructive Polarisation in Mainstream and Social Media: The Case...
Dynamics of Destructive Polarisation in Mainstream and Social Media: The Case...Dynamics of Destructive Polarisation in Mainstream and Social Media: The Case...
Dynamics of Destructive Polarisation in Mainstream and Social Media: The Case...Axel Bruns
 
Different Frontiers of Social Media War in Indonesia Elections 2024
Different Frontiers of Social Media War in Indonesia Elections 2024Different Frontiers of Social Media War in Indonesia Elections 2024
Different Frontiers of Social Media War in Indonesia Elections 2024Ismail Fahmi
 
HARNESSING AI FOR ENHANCED MEDIA ANALYSIS A CASE STUDY ON CHATGPT AT DRONE EM...
HARNESSING AI FOR ENHANCED MEDIA ANALYSIS A CASE STUDY ON CHATGPT AT DRONE EM...HARNESSING AI FOR ENHANCED MEDIA ANALYSIS A CASE STUDY ON CHATGPT AT DRONE EM...
HARNESSING AI FOR ENHANCED MEDIA ANALYSIS A CASE STUDY ON CHATGPT AT DRONE EM...Ismail Fahmi
 
Top 10 Wealthiest People In The World.pdf
Top 10 Wealthiest People In The World.pdfTop 10 Wealthiest People In The World.pdf
Top 10 Wealthiest People In The World.pdfauroraaudrey4826
 
57 Bidens Annihilation Nation Policy.pdf
57 Bidens Annihilation Nation Policy.pdf57 Bidens Annihilation Nation Policy.pdf
57 Bidens Annihilation Nation Policy.pdfGerald Furnkranz
 
Chandrayaan 3 Successful Moon Landing Mission.pdf
Chandrayaan 3 Successful Moon Landing Mission.pdfChandrayaan 3 Successful Moon Landing Mission.pdf
Chandrayaan 3 Successful Moon Landing Mission.pdfauroraaudrey4826
 
Opportunities, challenges, and power of media and information
Opportunities, challenges, and power of media and informationOpportunities, challenges, and power of media and information
Opportunities, challenges, and power of media and informationReyMonsales
 
complaint-ECI-PM-media-1-Chandru.pdfra;;prfk
complaint-ECI-PM-media-1-Chandru.pdfra;;prfkcomplaint-ECI-PM-media-1-Chandru.pdfra;;prfk
complaint-ECI-PM-media-1-Chandru.pdfra;;prfkbhavenpr
 
Manipur-Book-Final-2-compressed.pdfsal'rpk
Manipur-Book-Final-2-compressed.pdfsal'rpkManipur-Book-Final-2-compressed.pdfsal'rpk
Manipur-Book-Final-2-compressed.pdfsal'rpkbhavenpr
 
N Chandrababu Naidu Launches 'Praja Galam' As Part of TDP’s Election Campaign
N Chandrababu Naidu Launches 'Praja Galam' As Part of TDP’s Election CampaignN Chandrababu Naidu Launches 'Praja Galam' As Part of TDP’s Election Campaign
N Chandrababu Naidu Launches 'Praja Galam' As Part of TDP’s Election Campaignanjanibaddipudi1
 
AP Election Survey 2024: TDP-Janasena-BJP Alliance Set To Sweep Victory
AP Election Survey 2024: TDP-Janasena-BJP Alliance Set To Sweep VictoryAP Election Survey 2024: TDP-Janasena-BJP Alliance Set To Sweep Victory
AP Election Survey 2024: TDP-Janasena-BJP Alliance Set To Sweep Victoryanjanibaddipudi1
 
Quiz for Heritage Indian including all the rounds
Quiz for Heritage Indian including all the roundsQuiz for Heritage Indian including all the rounds
Quiz for Heritage Indian including all the roundsnaxymaxyy
 
Referendum Party 2024 Election Manifesto
Referendum Party 2024 Election ManifestoReferendum Party 2024 Election Manifesto
Referendum Party 2024 Election ManifestoSABC News
 
VIP Girls Available Call or WhatsApp 9711199012
VIP Girls Available Call or WhatsApp 9711199012VIP Girls Available Call or WhatsApp 9711199012
VIP Girls Available Call or WhatsApp 9711199012ankitnayak356677
 
Global Terrorism and its types and prevention ppt.
Global Terrorism and its types and prevention ppt.Global Terrorism and its types and prevention ppt.
Global Terrorism and its types and prevention ppt.NaveedKhaskheli1
 

Recently uploaded (16)

Brief biography of Julius Robert Oppenheimer
Brief biography of Julius Robert OppenheimerBrief biography of Julius Robert Oppenheimer
Brief biography of Julius Robert Oppenheimer
 
Dynamics of Destructive Polarisation in Mainstream and Social Media: The Case...
Dynamics of Destructive Polarisation in Mainstream and Social Media: The Case...Dynamics of Destructive Polarisation in Mainstream and Social Media: The Case...
Dynamics of Destructive Polarisation in Mainstream and Social Media: The Case...
 
Different Frontiers of Social Media War in Indonesia Elections 2024
Different Frontiers of Social Media War in Indonesia Elections 2024Different Frontiers of Social Media War in Indonesia Elections 2024
Different Frontiers of Social Media War in Indonesia Elections 2024
 
HARNESSING AI FOR ENHANCED MEDIA ANALYSIS A CASE STUDY ON CHATGPT AT DRONE EM...
HARNESSING AI FOR ENHANCED MEDIA ANALYSIS A CASE STUDY ON CHATGPT AT DRONE EM...HARNESSING AI FOR ENHANCED MEDIA ANALYSIS A CASE STUDY ON CHATGPT AT DRONE EM...
HARNESSING AI FOR ENHANCED MEDIA ANALYSIS A CASE STUDY ON CHATGPT AT DRONE EM...
 
Top 10 Wealthiest People In The World.pdf
Top 10 Wealthiest People In The World.pdfTop 10 Wealthiest People In The World.pdf
Top 10 Wealthiest People In The World.pdf
 
57 Bidens Annihilation Nation Policy.pdf
57 Bidens Annihilation Nation Policy.pdf57 Bidens Annihilation Nation Policy.pdf
57 Bidens Annihilation Nation Policy.pdf
 
Chandrayaan 3 Successful Moon Landing Mission.pdf
Chandrayaan 3 Successful Moon Landing Mission.pdfChandrayaan 3 Successful Moon Landing Mission.pdf
Chandrayaan 3 Successful Moon Landing Mission.pdf
 
Opportunities, challenges, and power of media and information
Opportunities, challenges, and power of media and informationOpportunities, challenges, and power of media and information
Opportunities, challenges, and power of media and information
 
complaint-ECI-PM-media-1-Chandru.pdfra;;prfk
complaint-ECI-PM-media-1-Chandru.pdfra;;prfkcomplaint-ECI-PM-media-1-Chandru.pdfra;;prfk
complaint-ECI-PM-media-1-Chandru.pdfra;;prfk
 
Manipur-Book-Final-2-compressed.pdfsal'rpk
Manipur-Book-Final-2-compressed.pdfsal'rpkManipur-Book-Final-2-compressed.pdfsal'rpk
Manipur-Book-Final-2-compressed.pdfsal'rpk
 
N Chandrababu Naidu Launches 'Praja Galam' As Part of TDP’s Election Campaign
N Chandrababu Naidu Launches 'Praja Galam' As Part of TDP’s Election CampaignN Chandrababu Naidu Launches 'Praja Galam' As Part of TDP’s Election Campaign
N Chandrababu Naidu Launches 'Praja Galam' As Part of TDP’s Election Campaign
 
AP Election Survey 2024: TDP-Janasena-BJP Alliance Set To Sweep Victory
AP Election Survey 2024: TDP-Janasena-BJP Alliance Set To Sweep VictoryAP Election Survey 2024: TDP-Janasena-BJP Alliance Set To Sweep Victory
AP Election Survey 2024: TDP-Janasena-BJP Alliance Set To Sweep Victory
 
Quiz for Heritage Indian including all the rounds
Quiz for Heritage Indian including all the roundsQuiz for Heritage Indian including all the rounds
Quiz for Heritage Indian including all the rounds
 
Referendum Party 2024 Election Manifesto
Referendum Party 2024 Election ManifestoReferendum Party 2024 Election Manifesto
Referendum Party 2024 Election Manifesto
 
VIP Girls Available Call or WhatsApp 9711199012
VIP Girls Available Call or WhatsApp 9711199012VIP Girls Available Call or WhatsApp 9711199012
VIP Girls Available Call or WhatsApp 9711199012
 
Global Terrorism and its types and prevention ppt.
Global Terrorism and its types and prevention ppt.Global Terrorism and its types and prevention ppt.
Global Terrorism and its types and prevention ppt.
 

Pedro delgado reporte

  • 1. 1864 NE 214 Ter, North Miami Beach, FL 33179 A1Your Notes Hide No notes found. * Notes are private and cannot be seen by anyone else. A2Photos Hide Upload photos for this property Other Photos: Google StreetView • Microsoft Bird's Eye View A3Overview Hide Location Property Address 1864 NE 214 Ter Miami, FL 33179 Parcel ID 3012330480150 Legal Description Highland Gdns 3RD Addn Pb 105-71 Lot 23 Blk 7 Lot Size 80 X 100 Or 19149-4984 05 2000 1 Land Zoning 0100 - Single Family - General Property Class Residential-Single Family Front Feet 80 Depth of the land 100 line Most Recent Sale Sale date 12/29/2011 Sale price $385,000 Market Value & Taxes Tax Year 2011 Total market value 211740 Property Tax $3,962.99 Building Square Footage 2,245 Year Built 1978 Number of Stories 1 Bedrooms 3 Bathrooms 2 Number of Units 1 A4Maps Hide
  • 2.
  • 3.
  • 4. Click on the map to expand!
  • 5.
  • 6.
  • 7. Click on the map to expand! Link to Google Maps Link to Yahoo Maps Link to MapQuest Maps B1Ownership Summary Hide
  • 8. From Assessment Roll Noel E Auerbach &W Laura 1864 NE 214 TERR N Miami Beach FL 33179-1554 Research this person See more about 1864 NE 214 Ter's ownership. C1Sales History Hide Sale date Sale Deed Buyer Seller Show details price 12/29/2011 $385,000 19564/2301 Auerbach, Noel E &W; Auerbach, Auerbach, Noel E &W; Show details Laura; Endara, Maria V; Delgado, Delgado, Pedro M Pedro M 5/23/2002 $206,000 19564/2301 Auerbach, Noel E &W; HSBC Mtg Auerbach, Noel E &W; Show details Corp; Auerbach, Laura HSBC Mtg Corp 4/19/2001 n/a 19564/2301 Whom Concerned; Auerbach, Laura; Whom Concerned; Show details Auerbach, Noel Auerbach, Noel 3/23/2001 $60,000 19564/2301 Auerbach, Noel E &W; Kislak Natl Auerbach, Noel E &W; Show details Bnk; Auerbach, Laura Kislak Natl Bnk 5/1/2000 $180,000 19564/2301 N/A N/A Show details 11/1/1978 $67,800 19564/2301 N/A N/A Show details 4/1/1977 $1 19564/2301 N/A N/A Show details C2Valuation Model Hide Our database has 76 properties that meet the following criteria: • Sold within the last 36 months • In the 33179 zip code • Property class 1 • Sale price over $25,000 Browse more recently sold properties in the neighborhood! The median price of these properties is $325,000 (half of these properties sold for higher prices, half sold for lower prices). 20% of the properties sold for $138,000 or less, and 20% sold for $620,000 or more. 20% 80% $138,000 $325,000 $620,000 Subscribe and Get More! If you subscribe to Comparables you'll get to see: • The entire list of properties • Sale date & price, square footage, and price per square foot for each property • Our quick-and-dirty value calculation Click here to learn more and subscribe. The median price per square foot of these properties is $134 (half of these properties sold for higher prices, half sold for lower prices). 20% of the properties sold for $84 or less, and 20% sold for $213 or more. 20% 80% $84 $134 $213 At the median price per square foot of $134, this property (2,245 square feet) would be $302,297. Here is a sample of the 76 properties following the criteria defined above:
  • 9. Address Sale Price Sale Date $ per Sq. Ft. Total Sq. Ft. 20420 Highland Lakes Blvd $340,000 4/26/2012 $134 2,525 19840 NE 19 Ct $355,000 4/16/2012 $124 2,862 19611 NE 18 Pl $199,888 2/1/2012 $106 1,875 2080 NE 214 St $455,000 5/10/2012 $170 2,661 18360 NE 11 Ave $160,000 1/6/2012 $96 1,664 19611 NE 19 Ct $210,000 3/6/2012 $80 2,622 1181 NE 204 Ter $104,000 3/20/2012 $60 1,733 1170 NE 212 Ter $78,579 5/18/2012 $48 1,612 19531 NE 17 Ave $840,000 1/31/2012 $230 3,652 C3Neighborhood Price History Hide We analyzed all sales of property class 1 in the 33179 zip code since 1980. For each year we found the median sale price (half of sales were higher, half were lower) and the median size of the properties sold (half were bigger, half were smaller). We also computed the median price per square foot for this property class and the value of a median (2,245 sqft) property if it were to sell for the median price per square foot. Year # of Sales Median Price Median Sq. Ft. Median $ per Sq. Ft. Value at Median $ per Sq. Ft. 2012 12 $355,000 2,661 $134 $302,297 2011 28 $325,000 2,461 $119 $267,261 2010 18 $310,000 2,453 $133 $300,133 2009 36 $303,340 2,276 $142 $318,856 2008 12 $365,000 2,363 $159 $357,484 2007 23 $405,000 2,296 $216 $486,650 2006 16 $325,000 1,785 $204 $458,883 2005 19 $415,000 2,079 $197 $442,736 2004 50 $249,900 2,070 $137 $308,637 2003 39 $283,000 2,173 $122 $275,997 2002 68 $322,500 3,083 $120 $269,628 2001 72 $195,000 2,549 $89 $201,571 2000 31 $185,000 2,311 $82 $184,175 1999 44 $155,000 2,155 $70 $159,266 1998 25 $127,000 2,171 $66 $148,314 1997 5 $91,500 1,745 $56 $126,435 1996 4 $157,000 2,513 $61 $138,787 1995 3 $79,959 1,719 $60 $135,567 1987 3 $82,000 1,800 $45 $101,743 1986 2 $157,000 1,948 $80 $180,936 1985 1 $65,000 1,615 $40 $90,356 1984 1 $150,000 2,433 $61 $138,409 1983 3 $110,000 2,830 $42 $96,431 1982 6 $100,000 1,768 $50 $113,613 1981 1 $201,400 3,385 $59 $133,572 1980 7 $105,800 2,156 $42 $95,219 D1Building Hide General Actual Area 2245
  • 10. Actual Year Built 1978 Details Effective Year Built 1978 Quality Code 1 Improvements Description Finished Exterior Wall 100% Electrical 100% Interior Walls 100% Plumbing 100% Roofing Structure 100% Roofing Cover 100% Interior Flooring 100% Extra Features Property Use Year Built Effective Year Built Units Patio - Screened Over Concrete Slab 1978 1978 468 E1Building Permits Hide Issue Date Permit Number Permit Type Categories Inspection Disposition Show details 12/29/2004 2005026435 PLUM Pool piping Approved Show details 12/29/2004 2005026438 ELEC Swimming pools Approved Show details 12/28/2004 2005026122 BLDG Swimming pool Approved Show details F1Property Tax Hide The Florida Property Tax Statute and the Florida State Constitution are the main legal documents regarding taxation in the State of Florida. Taxes are determined at local levels, being used for schools, fire and police protection, and other public services and benefits. Market Value Market value is the price a property would sell for when both buyer and seller seek the best price and neither is under pressure to buy or sell. Market values in Florida are evaluated as of January 1, based upon sales of comparable properties in the previous year. This property benefits from Save Our Homes limitation of assessed value. The annual increase of assessed values in is limited to: 1) 3% greater than the prior year, or 2) the percentage change in the Consumer Price Index, whichever is lower. For 2012, the rate of increase is 3% - actual cap rate will vary yearly. Market = $211,740 value Assessed Value In State of Florida all properties are reassessed every year at 100% of the market value, however, there are several assessment reductions, limitations or caps that may apply. Assessed = $211,740 value Property Tax Exemptions are available in Florida which may reduce the tax bill. These are deducted from the assessed value to give the property's taxable value. Property tax in Miami-Dade County is calculated by multiplying the taxable value with the corresponding millage rates.
  • 11. Current tax represents the tax amount for this property assessed at its Save Our Homes value with exemptions. Base tax is an estimate of what an owner NOT benefiting from tax exemptions, caps or deductions would pay. Actual taxes might differ from the figures displayed here due to various abatement and financial assistance programs or to non ad- valorem taxes such as waste disposal, storm water and emergency services. School Rates Assessed Exemption Taxable Tax Rate Tax Value value Amount School Board Operating $211,740 $25,000 $186,740 x 7.765000‰ = $1,450.04 School Board Debt $211,740 $25,000 $186,740 x 0.240000‰ = $44.82 Service State and other rates Everglades Construction $211,740 $50,000 $161,740 x 0.062400‰ = $10.09 Project Florida Inland $211,740 $50,000 $161,740 x 0.034500‰ = $5.58 Navigation District Children's Trust $211,740 $50,000 $161,740 x 0.500000‰ = $80.87 Authority South Florida Water $211,740 $50,000 $161,740 x 0.373900‰ = $60.47 Mgmt. District County Rates County Wide Operating $211,740 $50,000 $161,740 x 4.805000‰ = $777.16 County Wide Debt $211,740 $50,000 $161,740 x 0.285000‰ = $46.10 Service Library District $211,740 $50,000 $161,740 x 0.179500‰ = $29.03 Fire Rescue Operating $211,740 $50,000 $161,740 x 2.449600‰ = $396.20 Fire Rescue Debt Service $211,740 $50,000 $161,740 x 0.013100‰ = $2.12 City Rates Uninc. County Operating $211,740 $50,000 $161,740 x 2.008300‰ = $324.82 Current tax = $3,227.30 Base tax $211,740 x 18.7163‰ = $3,962.99 For more information please visit Miami-Dade County's Appraiser and Tax Collector, or look up this property's currenttax situation and valuation. F2Tax/Square Foot Map Hide
  • 12.
  • 13. Click on the map to expand! Tax per Square Foot Legend
  • 14. On this map, you can see the tax value paid per square foot for this property. F3Assessment History Hide Year Property class Market value Assessment value Total tax rate Property tax 2011 Residential-Single Family $211,740 $211,740 18.7163‰ $3,962.99 2010 Residential-Single Family $257,038 $208,611 20.4573‰ $4,785.33 2009 Residential-Single Family $203,127 $203,127 18.6172‰ $3,781.66 2008 Residential-Single Family $403,482 $403,482 18.5679‰ $7,491.81 2007 Residential-Single Family $451,194 $451,194 20.7468‰ $9,360.83 2006 Residential-Single Family $415,895 $415,895 20.7468‰ $8,628.49 G1Neighbors Hide Link to address Property Class Gross sqft Sale date Sale price 1844 NE 214 Ter 1 2,611 9/19/2001 $50,000 2020 NE 214 Ter 1 2,421 11/4/1993 n/a 2040 NE 214 Ter 1 2,554 8/16/2004 $407,000 2050 NE 214 Ter 1 2,422 10/18/2006 $595,000 G2Demographics By Tract Hide Tract number 9701 Total population 3373 Housing Owners 77% Average occupants per room 1 Average year structure built 1965 Average year moved in 1981 Average units in structure 2 Wealth Median house value $87,500 Median rent $666 Renters spending <35% of income on 82% housing Owners spending <50% of income on 94% housing Population in poverty 4% Race & Ethnicity White 97% Black or African American 1%
  • 15. Asian 1% Education College graduates 21% High school graduates 38% Other Average age 37 Citizens 99% English speakers 36% Economic/Employment Median household income $46,250 Household income-Employed or retired 80% Employment status-Employed 4% Transportation Commuting by own vehicle 93% Average travel time to work (min) 27 H1Fema Flood Zones Map Hide On this map, you can see if the property is located in a special flood hazard area. Click on the map to expand! Find out more about: FEMA Flood Hazard Map Legend H2Environmental Information Hide This section contains information about environmental matters such as air releases, drinking water, toxic releases, hazardous wastes, water discharge permits and Superfund sites. The picture below shows any environmental concerns that exist in the area surrounding the property. For more information, click on the picture or on the links at the end of the section. Regulated facilities Sorry, we don't have any information for this property Legend See other environmental information Try EPA EnviroMapper StoreFront Disclaimer Copyright 2003-2012 by PropertyShark.com All data comes from government sources. No attempt has been made to validate it. No attempt has been made to validate the accuracy of the programming of this web site. Do not rely on this report to support investment decisions. The only authoritative source for the information in this report is the government agencies from which the data was acquired.
  • 16.