Enterprise Excellence is Inclusive Excellence.pdfKaiNexus
Enterprise excellence and inclusive excellence are closely linked, and real-world challenges have shown that both are essential to the success of any organization. To achieve enterprise excellence, organizations must focus on improving their operations and processes while creating an inclusive environment that engages everyone. In this interactive session, the facilitator will highlight commonly established business practices and how they limit our ability to engage everyone every day. More importantly, though, participants will likely gain increased awareness of what we can do differently to maximize enterprise excellence through deliberate inclusion.
What is Enterprise Excellence?
Enterprise Excellence is a holistic approach that's aimed at achieving world-class performance across all aspects of the organization.
What might I learn?
A way to engage all in creating Inclusive Excellence. Lessons from the US military and their parallels to the story of Harry Potter. How belt systems and CI teams can destroy inclusive practices. How leadership language invites people to the party. There are three things leaders can do to engage everyone every day: maximizing psychological safety to create environments where folks learn, contribute, and challenge the status quo.
Who might benefit? Anyone and everyone leading folks from the shop floor to top floor.
Dr. William Harvey is a seasoned Operations Leader with extensive experience in chemical processing, manufacturing, and operations management. At Michelman, he currently oversees multiple sites, leading teams in strategic planning and coaching/practicing continuous improvement. William is set to start his eighth year of teaching at the University of Cincinnati where he teaches marketing, finance, and management. William holds various certifications in change management, quality, leadership, operational excellence, team building, and DiSC, among others.
3.0 Project 2_ Developing My Brand Identity Kit.pptxtanyjahb
A personal brand exploration presentation summarizes an individual's unique qualities and goals, covering strengths, values, passions, and target audience. It helps individuals understand what makes them stand out, their desired image, and how they aim to achieve it.
Kseniya Leshchenko: Shared development support service model as the way to ma...Lviv Startup Club
Kseniya Leshchenko: Shared development support service model as the way to make small projects with small budgets profitable for the company (UA)
Kyiv PMDay 2024 Summer
Website – www.pmday.org
Youtube – https://www.youtube.com/startuplviv
FB – https://www.facebook.com/pmdayconference
Skye Residences | Extended Stay Residences Near Toronto Airportmarketingjdass
Experience unparalleled EXTENDED STAY and comfort at Skye Residences located just minutes from Toronto Airport. Discover sophisticated accommodations tailored for discerning travelers.
Website Link :
https://skyeresidences.com/
https://skyeresidences.com/about-us/
https://skyeresidences.com/gallery/
https://skyeresidences.com/rooms/
https://skyeresidences.com/near-by-attractions/
https://skyeresidences.com/commute/
https://skyeresidences.com/contact/
https://skyeresidences.com/queen-suite-with-sofa-bed/
https://skyeresidences.com/queen-suite-with-sofa-bed-and-balcony/
https://skyeresidences.com/queen-suite-with-sofa-bed-accessible/
https://skyeresidences.com/2-bedroom-deluxe-queen-suite-with-sofa-bed/
https://skyeresidences.com/2-bedroom-deluxe-king-queen-suite-with-sofa-bed/
https://skyeresidences.com/2-bedroom-deluxe-queen-suite-with-sofa-bed-accessible/
#Skye Residences Etobicoke, #Skye Residences Near Toronto Airport, #Skye Residences Toronto, #Skye Hotel Toronto, #Skye Hotel Near Toronto Airport, #Hotel Near Toronto Airport, #Near Toronto Airport Accommodation, #Suites Near Toronto Airport, #Etobicoke Suites Near Airport, #Hotel Near Toronto Pearson International Airport, #Toronto Airport Suite Rentals, #Pearson Airport Hotel Suites
RMD24 | Debunking the non-endemic revenue myth Marvin Vacquier Droop | First ...BBPMedia1
Marvin neemt je in deze presentatie mee in de voordelen van non-endemic advertising op retail media netwerken. Hij brengt ook de uitdagingen in beeld die de markt op dit moment heeft op het gebied van retail media voor niet-leveranciers.
Retail media wordt gezien als het nieuwe advertising-medium en ook mediabureaus richten massaal retail media-afdelingen op. Merken die niet in de betreffende winkel liggen staan ook nog niet in de rij om op de retail media netwerken te adverteren. Marvin belicht de uitdagingen die er zijn om echt aansluiting te vinden op die markt van non-endemic advertising.
Digital Transformation and IT Strategy Toolkit and TemplatesAurelien Domont, MBA
This Digital Transformation and IT Strategy Toolkit was created by ex-McKinsey, Deloitte and BCG Management Consultants, after more than 5,000 hours of work. It is considered the world's best & most comprehensive Digital Transformation and IT Strategy Toolkit. It includes all the Frameworks, Best Practices & Templates required to successfully undertake the Digital Transformation of your organization and define a robust IT Strategy.
Editable Toolkit to help you reuse our content: 700 Powerpoint slides | 35 Excel sheets | 84 minutes of Video training
This PowerPoint presentation is only a small preview of our Toolkits. For more details, visit www.domontconsulting.com
Premium MEAN Stack Development Solutions for Modern BusinessesSynapseIndia
Stay ahead of the curve with our premium MEAN Stack Development Solutions. Our expert developers utilize MongoDB, Express.js, AngularJS, and Node.js to create modern and responsive web applications. Trust us for cutting-edge solutions that drive your business growth and success.
Know more: https://www.synapseindia.com/technology/mean-stack-development-company.html
RMD24 | Retail media: hoe zet je dit in als je geen AH of Unilever bent? Heid...BBPMedia1
Grote partijen zijn al een tijdje onderweg met retail media. Ondertussen worden in dit domein ook de kansen zichtbaar voor andere spelers in de markt. Maar met die kansen ontstaan ook vragen: Zelf retail media worden of erop adverteren? In welke fase van de funnel past het en hoe integreer je het in een mediaplan? Wat is nu precies het verschil met marketplaces en Programmatic ads? In dit half uur beslechten we de dilemma's en krijg je antwoorden op wanneer het voor jou tijd is om de volgende stap te zetten.
Implicitly or explicitly all competing businesses employ a strategy to select a mix
of marketing resources. Formulating such competitive strategies fundamentally
involves recognizing relationships between elements of the marketing mix (e.g.,
price and product quality), as well as assessing competitive and market conditions
(i.e., industry structure in the language of economics).
Falcon stands out as a top-tier P2P Invoice Discounting platform in India, bridging esteemed blue-chip companies and eager investors. Our goal is to transform the investment landscape in India by establishing a comprehensive destination for borrowers and investors with diverse profiles and needs, all while minimizing risk. What sets Falcon apart is the elimination of intermediaries such as commercial banks and depository institutions, allowing investors to enjoy higher yields.
What is the TDS Return Filing Due Date for FY 2024-25.pdfseoforlegalpillers
It is crucial for the taxpayers to understand about the TDS Return Filing Due Date, so that they can fulfill your TDS obligations efficiently. Taxpayers can avoid penalties by sticking to the deadlines and by accurate filing of TDS. Timely filing of TDS will make sure about the availability of tax credits. You can also seek the professional guidance of experts like Legal Pillers for timely filing of the TDS Return.
What are the main advantages of using HR recruiter services.pdfHumanResourceDimensi1
HR recruiter services offer top talents to companies according to their specific needs. They handle all recruitment tasks from job posting to onboarding and help companies concentrate on their business growth. With their expertise and years of experience, they streamline the hiring process and save time and resources for the company.
Discover the innovative and creative projects that highlight my journey throu...dylandmeas
Discover the innovative and creative projects that highlight my journey through Full Sail University. Below, you’ll find a collection of my work showcasing my skills and expertise in digital marketing, event planning, and media production.
"𝑩𝑬𝑮𝑼𝑵 𝑾𝑰𝑻𝑯 𝑻𝑱 𝑰𝑺 𝑯𝑨𝑳𝑭 𝑫𝑶𝑵𝑬"
𝐓𝐉 𝐂𝐨𝐦𝐬 (𝐓𝐉 𝐂𝐨𝐦𝐦𝐮𝐧𝐢𝐜𝐚𝐭𝐢𝐨𝐧𝐬) is a professional event agency that includes experts in the event-organizing market in Vietnam, Korea, and ASEAN countries. We provide unlimited types of events from Music concerts, Fan meetings, and Culture festivals to Corporate events, Internal company events, Golf tournaments, MICE events, and Exhibitions.
𝐓𝐉 𝐂𝐨𝐦𝐬 provides unlimited package services including such as Event organizing, Event planning, Event production, Manpower, PR marketing, Design 2D/3D, VIP protocols, Interpreter agency, etc.
Sports events - Golf competitions/billiards competitions/company sports events: dynamic and challenging
⭐ 𝐅𝐞𝐚𝐭𝐮𝐫𝐞𝐝 𝐩𝐫𝐨𝐣𝐞𝐜𝐭𝐬:
➢ 2024 BAEKHYUN [Lonsdaleite] IN HO CHI MINH
➢ SUPER JUNIOR-L.S.S. THE SHOW : Th3ee Guys in HO CHI MINH
➢FreenBecky 1st Fan Meeting in Vietnam
➢CHILDREN ART EXHIBITION 2024: BEYOND BARRIERS
➢ WOW K-Music Festival 2023
➢ Winner [CROSS] Tour in HCM
➢ Super Show 9 in HCM with Super Junior
➢ HCMC - Gyeongsangbuk-do Culture and Tourism Festival
➢ Korean Vietnam Partnership - Fair with LG
➢ Korean President visits Samsung Electronics R&D Center
➢ Vietnam Food Expo with Lotte Wellfood
"𝐄𝐯𝐞𝐫𝐲 𝐞𝐯𝐞𝐧𝐭 𝐢𝐬 𝐚 𝐬𝐭𝐨𝐫𝐲, 𝐚 𝐬𝐩𝐞𝐜𝐢𝐚𝐥 𝐣𝐨𝐮𝐫𝐧𝐞𝐲. 𝐖𝐞 𝐚𝐥𝐰𝐚𝐲𝐬 𝐛𝐞𝐥𝐢𝐞𝐯𝐞 𝐭𝐡𝐚𝐭 𝐬𝐡𝐨𝐫𝐭𝐥𝐲 𝐲𝐨𝐮 𝐰𝐢𝐥𝐥 𝐛𝐞 𝐚 𝐩𝐚𝐫𝐭 𝐨𝐟 𝐨𝐮𝐫 𝐬𝐭𝐨𝐫𝐢𝐞𝐬."
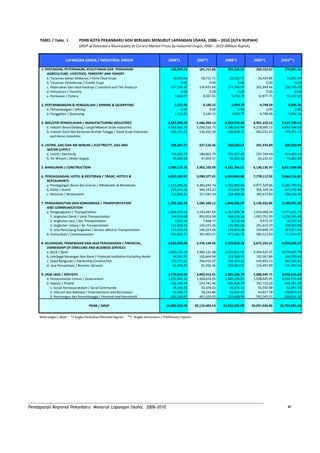
PDRB Kota Pekanbaru Menurut Lapangan Usaha Tahun 2006-2010
1. TABEL / Table. 1
LAPANGAN USAHA / INDUSTRIAL ORIGIN 2006*) 2007*) 2008*) 2009*) 2010**)
1. PERTANIAN, PETERNAKAN, KEHUTANAN DAN PERIKANAN 160,956.13 181,711.06 209,726.24 239,152.07 274,001.16
AGRICULTURE, LIVESTOCK, FORESTRY AND FISHERY
a. Tanaman Bahan Makanan / Farm Food Crops 16,010.04 18,711.71 22,222.57 26,424.86 31,442.94
b. Tanaman Perkebunan / Estate Crops 0.00 0.00 0.00 0.00 0.00
c. Peternakan dan Hasil-hasilnya / Livestock and The Products 137,325.52 154,431.69 177,746.97 201,849.46 230,370.79
d. Kehutanan / Forestry 0.00 0.00 0.00 0.00 0.00
e. Perikanan / Fishery 7,620.57 8,567.65 9,756.71 10,877.75 12,187.43
2. PERTAMBANGAN & PENGGALIAN / MINING & QUARRYING 2,511.95 3,140.15 3,954.75 4,798.69 5,896.16
a. Pertambangan / Mining 0.00 0.00 0.00 0.00 0.00
b. Penggalian / Quarrying 2,511.95 3,140.15 3,954.75 4,798.69 5,896.16
3. INDUSTRI PENGOLAHAN / MANUFACTURING INDUSTRIES 4,947,946.94 5,586,983.13 6,432,910.64 6,901,226.53 7,427,790.12
a. Industri Besar/Sedang / Large/Medium Scale Industries 4,502,631.72 5,050,632.75 5,796,052.49 6,218,005.11 6,692,438.90
b. Industri Kecil dan Kerajinan Rumah Tangga / Small Scale Industries 445,315.22 536,350.38 636,858.15 683,221.43 735,351.22
and Home Industries
4. LISTRIK, GAS DAN AIR MINUM / ELECTRICITY, GAS AND 196,667.27 227,120.36 260,620.67 291,976.89 328,920.04
WATER SUPPLY
a. Listrik / Electricity 156,606.37 180,065.79 205,027.45 227,744.49 254,436.14
b. Air Minum / Water Supply 40,060.90 47,054.57 55,593.22 64,232.41 74,483.90
5. BANGUNAN / CONSTRUCTION 1,949,113.75 2,965,165.95 4,231,766.51 6,130,136.97 8,811,458.88
6. PERDAGANGAN, HOTEL & RESTORAN / TRADE, HOTELS & 4,019,169.97 5,090,377.41 6,504,844.88 7,778,112.92 9,464,316.85
RESTAURANTS
a. Perdagangan Besar dan Eceran / Wholesales & Retailsales 3,512,490.15 4,483,642.74 5,762,803.64 6,877,329.86 8,360,769.91
b. Hotel / Hotels 296,671.46 349,193.23 423,642.76 505,109.26 607,292.86
c. Restoran / Restaurants 210,008.36 257,541.44 318,398.48 395,673.80 496,254.08
7. PENGANGKUTAN DAN KOMUNIKASI / TRANSPORTATION 1,392,535.33 1,585,349.11 1,844,506.47 2,136,932.86 2,490,941.68
AND COMMUNICATION
a. Pengangkutan / Transportation 1,068,472.56 1,193,447.04 1,367,340.74 1,554,408.93 1,773,621.72
1. Angkutan Darat / Land Transportation 764,933.60 850,953.08 968,278.24 1,092,701.99 1,236,283.04
2. Angkutan Laut / Sea Transportation 7,017.19 7,948.77 8,713.54 9,473.37 10,337.34
3. Angkutan Udara / Air Transportation 122,818.55 142,521.26 170,485.66 201,633.39 239,963.89
4. Jasa Penunjang Angkutan / Service allied to Transportation 173,703.22 192,023.94 219,863.30 250,600.19 287,037.45
b. Komunikasi / Communication 324,062.77 391,902.07 477,165.73 582,523.93 717,319.97
8. KEUANGAN, PERSEWAAN DAN JASA PERUSAHAAN / FINANCIAL, 2,033,029.80 2,476,144.95 3,103,018.18 3,875,254.21 4,859,600.29
OWNERSHIP OF DWELLING AND BUSINESS SERVICES
a. Bank / Bank 1,600,170.73 1,982,131.48 2,525,912.55 3,204,625.25 4,076,603.78
b. Lembaga Keuangan Non Bank / Financial Institution Excluding Banks 94,251.97 105,664.94 123,348.41 143,367.86 166,278.05
c. Sewa Bangunan / Ownership Construction 257,171.67 296,416.07 350,353.21 410,859.21 485,265.81
d. Jasa Perusahaan / Business Services 81,435.43 91,932.46 103,404.01 116,401.89 131,452.66
9. JASA-JASA / SERVICES 1,778,614.82 2,003,412.41 2,325,186.75 2,680,345.71 3,090,556.22
a. Pemerintahan Umum / Government 1,251,845.39 1,428,670.95 1,669,358.01 1,938,625.45 2,249,774.84
b. Swasta / Private 526,769.43 574,741.46 655,828.74 741,720.26 840,781.39
1. Sosial Kemasyarakatan / Social Community 39,169.85 43,478.63 49,375.11 55,556.88 62,851.50
2. Hiburan dan Rekreasi / Entertainment and Recreation 63,408.77 70,233.80 81,045.07 93,817.78 108,875.53
3. Perorangan dan Rumahtangga / Personal and Household 424,190.81 461,029.02 525,408.56 592,345.61 669,054.36
PDRB / GRDP 16,480,545.96 20,119,404.53 24,916,535.09 30,037,936.86 36,753,481.40
Keterangan / Note : *) Angka Perbaikan/Revised Figures **) Angka Sementara / Preliminary Figures
_____________________________________________________________________________________________________________________________
Pendapatan Regional Pekanbaru Menurut Lapangan Usaha, 2006-2010 47
2. TABEL / Table. 2
LAPANGAN USAHA / INDUSTRIAL ORIGIN 2006*) 2007*) 2008*) 2009*) 2010**)
1. PERTANIAN, PETERNAKAN, KEHUTANAN DAN PERIKANAN 107,095.96 111,625.43 116,126.76 120,716.69 125,282.86
AGRICULTURE, LIVESTOCK, FORESTRY AND FISHERY
a. Tanaman Bahan Makanan / Farm Food Crops 9,080.29 9,262.66 9,497.13 9,722.22 9,929.30
b. Tanaman Perkebunan / Estate Crops 0.00 0.00 0.00 0.00 0.00
c. Peternakan dan Hasil-hasilnya / Livestock and The Products 94,245.87 98,380.63 102,459.27 106,629.36 110,798.57
d. Kehutanan / Forestry 0.00 0.00 0.00 0.00 0.00
e. Perikanan / Fishery 3,769.80 3,982.14 4,170.35 4,365.11 4,554.99
2. PERTAMBANGAN & PENGGALIAN / MINING & QUARRYING 1,983.05 2,082.37 2,168.51 2,252.86 2,331.04
a. Pertambangan / Mining 0.00 0.00 0.00 0.00 0.00
b. Penggalian / Quarrying 1,983.05 2,082.37 2,168.51 2,252.86 2,331.04
3. INDUSTRI PENGOLAHAN / MANUFACTURING INDUSTRIES 699,871.59 746,614.03 793,267.43 841,894.72 892,240.02
a. Industri Besar/Sedang / Large/Medium Scale Industries 646,447.33 685,547.53 726,669.97 771,214.84 817,333.49
b. Industri Kecil dan Kerajinan Rumah Tangga / Small Scale Industries 53,424.26 61,066.50 66,597.45 70,679.88 74,906.53
and Home Industries
4. LISTRIK, GAS DAN AIR MINUM / ELECTRICITY, GAS AND 81,130.92 84,903.63 90,675.37 95,685.35 101,015.15
WATER SUPPLY
a. Listrik / Electricity 67,171.82 70,201.29 75,039.03 79,143.66 83,512.39
b. Air Minum / Water Supply 13,959.11 14,702.34 15,636.34 16,541.68 17,502.76
5. BANGUNAN / CONSTRUCTION 1,075,520.04 1,172,610.89 1,277,475.43 1,390,532.00 1,515,123.67
6. PERDAGANGAN, HOTEL & RESTORAN / TRADE, HOTELS & 1,961,790.07 2,187,933.63 2,398,747.60 2,630,543.34 2,889,072.70
RESTAURANTS
a. Perdagangan Besar dan Eceran / Wholesales & Retailsales 1,840,852.61 2,055,181.24 2,253,657.12 2,472,036.49 2,715,532.09
b. Hotel / Hotels 65,412.64 70,562.85 75,426.04 80,155.26 85,293.21
c. Restoran / Restaurants 55,524.82 62,189.54 69,664.44 78,351.59 88,247.40
7. PENGANGKUTAN DAN KOMUNIKASI / TRANSPORTATION 930,692.55 1,019,819.53 1,126,064.51 1,231,638.88 1,352,677.34
AND COMMUNICATION
a. Pengangkutan / Transportation 740,396.94 796,552.54 863,468.23 921,066.27 983,934.47
1. Angkutan Darat / Land Transportation 538,222.00 570,602.19 608,016.58 644,315.17 683,747.26
2. Angkutan Laut / Sea Transportation 3,819.08 4,106.49 4,345.53 4,591.92 4,854.12
3. Angkutan Udara / Air Transportation 135,783.29 154,826.38 179,217.06 195,360.09 213,196.47
4. Jasa Penunjang Angkutan / Service allied to Transportation 62,572.56 67,017.48 71,889.06 76,799.09 82,136.62
b. Komunikasi / Communication 190,295.61 223,266.99 262,596.28 310,572.62 368,742.87
8. KEUANGAN, PERSEWAAN DAN JASA PERUSAHAAN / FINANCIAL, 413,242.33 473,033.16 521,390.71 576,120.28 638,666.73
OWNERSHIP OF DWELLING AND BUSINESS SERVICES
a. Bank / Bank 229,036.97 275,730.73 309,035.26 347,170.21 391,503.84
b. Lembaga Keuangan Non Bank / Financial Institution Excluding Banks 26,598.56 28,589.83 30,852.29 33,323.56 36,046.09
c. Sewa Bangunan / Ownership Construction 115,783.82 123,783.83 133,559.68 144,418.08 156,390.34
d. Jasa Perusahaan / Business Services 41,822.99 44,928.76 47,943.48 51,208.43 54,726.45
9. JASA-JASA / SERVICES 1,096,270.29 1,198,532.20 1,304,506.20 1,413,247.82 1,531,519.95
a. Pemerintahan Umum / Government 743,923.86 818,764.60 895,618.44 977,836.21 1,067,210.44
b. Swasta / Private 352,346.43 379,767.61 408,887.76 435,411.61 464,309.51
1. Sosial Kemasyarakatan / Social Community 29,885.25 32,162.51 34,589.41 36,516.05 38,601.11
2. Hiburan dan Rekreasi / Entertainment and Recreation 37,451.14 40,335.78 43,464.59 45,929.03 48,634.25
3. Perorangan dan Rumahtangga / Personal and Household 285,010.03 307,269.32 330,833.76 352,966.54 377,074.15
PDRB / GRDP 6,367,596.81 6,997,154.88 7,630,422.50 8,302,631.95 9,047,929.45
Keterangan / Note : *) Angka Perbaikan/Revised Figures **) Angka Sementara / Preliminary Figures
_____________________________________________________________________________________________________________________________
Pendapatan Regional Pekanbaru Menurut Lapangan Usaha, 2006-2010 48