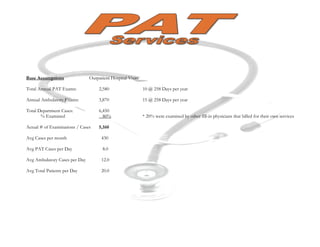
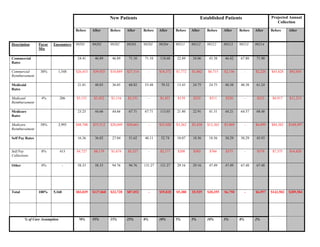
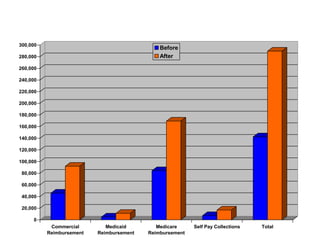
Case Study
                                                      Current PAT Services Client
Scenario

• For several years PAT Services provided the PAT physician to the hospital as an
  independent contractor but had no other involvement.

• Hospital had previously contracted with an outside service to handle PAT billing.

• Eventually the hospital began billing for the service but did not recover cost.

• PAT Services was asked to review PAT practice performance and made multiple
  suggestions regarding improving results.

• PAT Services was asked to manage physician & provide billing services


Notes

1)   Current PAT practice payor mix used
2)   Estimated patients are annualized from current PAT volumes
3)   Reimbursement Rates for Medicare based upon 2009 Ohio Fee Schedule to create accurate comparison
4)   Reimbursement Rates for Medicaid based upon 2009 Ohio Medicaid Fee Schedule to create accurate comparison
5)   Used Ohio Medicaid rates for self-pay rates
6)   Place of Service = Outpatient Hospital
Base Assumptions               Outpatient Hospital Visits

Total Annual PAT Exams:             2,580                   10 @ 258 Days per year

Annual Ambulatory Exams:            3,870                   15 @ 258 Days per year

Total Department Cases:             6,450
       % Examined                     80%                   * 20% were examined by other fill-in physicians that billed for their own services

Actual # of Examinations / Cases    5,160

Avg Cases per month                  430

Avg PAT Cases per Day                 8.0

Avg Ambulatory Cases per Day         12.0

Avg Total Patients per Day           20.0
New Patients                                            Established Patients                    Projected Annual
                                                                                                                                                              Collection

                                      Before    After      Before    After     Before   After     Before   After      Before    After    Before   After    Before     After


Description      Payor   Encounters   99201     99202      99202     99203     99203    99204     99211    99212      99212     99213    99213    99214
                 Mix

Commercial                             24.41     46.89      46.89     71.10    71.10    118.68    22.89    24.06       43.38    46.42    67.80    71.90
Rates

Commercial        30%      1,548      $26,453   $39,925    $10,889   $27,514        -   $18,372   $1,772   $1,862     $6,715    $2,156        -   $2,226   $45,828    $92,054
Reimbursement

Medicaid                               21.81     48.03      36.05     68.82    53.48     70.32    13.43    24.75       24.75    40.38    40.38    61.24
Rates

Medicaid          4%           206    $3,151     $5,452    $1,116    $3,551         -   $1,451     $139     $255       $511      $250         -    $253     $4,917    $11,213
Reimbursement

Medicare                               23.25     44.66      44.66     67.71    67.71    113.03    21.80    22.91       41.31    44.21    64.57    68.48
Rates

Medicare          58%      2,993      $48,708   $73,512    $20,049   $50,661        -   $33,828   $3,262   $3,428     $12,363   $3,969        -   $4,099   $84,382    $169,497
Reimbursement

Self Pay Rates                         16.36     36.02      27.04     51.62    40.11     52.74    10.07    18.56       18.56    30.29    30.29    45.93


Self Pay          8%           413    $4,727     $8,179    $1,674    $5,327         -   $2,177     $208     $383       $766      $375         -    $379     $7,375    $16,820
Collections

Other             0%             -     58.33     58.33      94.76     94.76    131.27   131.27    29.16    29.16       47.49    47.49    67.48    67.48


Total            100%    5,160        $83,039   $127,068   $33,728   $87,052        -   $55,828   $5,380   $5,929     $20,355   $6,750        -   $6,957   $142,502   $289,584


        % of Care Assumption           70%      55%        15%       25%       0%       10%       5%       5%         10%       3%       0%       2%
300,000
                                              Before
280,000                                       After

260,000

240,000

220,000

200,000

180,000

160,000

140,000

120,000

100,000

 80,000

 60,000

 40,000

 20,000

     0
           Commercial        Medicaid        Medicare     Self Pay Collections   Total
          Reimbursement   Reimbursement   Reimbursement
Conclusion

• PAT Services previously provided physician to client hospital as an independent contractor
  but had no other involvement

• Hospital previously contracted with an outside service to handle PAT billing & eventually began handling
  billing internally but could not recover cost

• PAT Services was asked to review PAT practice performance and made multiple suggestions
  regarding improving results

• PAT Services was asked to manage physician & provide billing service.

• Upon engaging in management of PAT department the same physician was retrained in E & M code
  selection & correct documentation by PAT services experts.

• PAT Services initated quarterly internal chart audits with results communicated back to physician

• PAT Service increased annual collections by more than 100% for client hospital from $142,502 to $289,584,
  which in turn transitioned the hospital’s PAT department from a cost center to a revenue generating center

Pat Services Case Study

  • 1.
    Case Study Current PAT Services Client Scenario • For several years PAT Services provided the PAT physician to the hospital as an independent contractor but had no other involvement. • Hospital had previously contracted with an outside service to handle PAT billing. • Eventually the hospital began billing for the service but did not recover cost. • PAT Services was asked to review PAT practice performance and made multiple suggestions regarding improving results. • PAT Services was asked to manage physician & provide billing services Notes 1) Current PAT practice payor mix used 2) Estimated patients are annualized from current PAT volumes 3) Reimbursement Rates for Medicare based upon 2009 Ohio Fee Schedule to create accurate comparison 4) Reimbursement Rates for Medicaid based upon 2009 Ohio Medicaid Fee Schedule to create accurate comparison 5) Used Ohio Medicaid rates for self-pay rates 6) Place of Service = Outpatient Hospital
  • 2.
    Base Assumptions Outpatient Hospital Visits Total Annual PAT Exams: 2,580 10 @ 258 Days per year Annual Ambulatory Exams: 3,870 15 @ 258 Days per year Total Department Cases: 6,450 % Examined 80% * 20% were examined by other fill-in physicians that billed for their own services Actual # of Examinations / Cases 5,160 Avg Cases per month 430 Avg PAT Cases per Day 8.0 Avg Ambulatory Cases per Day 12.0 Avg Total Patients per Day 20.0
  • 3.
    New Patients Established Patients Projected Annual Collection Before After Before After Before After Before After Before After Before After Before After Description Payor Encounters 99201 99202 99202 99203 99203 99204 99211 99212 99212 99213 99213 99214 Mix Commercial 24.41 46.89 46.89 71.10 71.10 118.68 22.89 24.06 43.38 46.42 67.80 71.90 Rates Commercial 30% 1,548 $26,453 $39,925 $10,889 $27,514 - $18,372 $1,772 $1,862 $6,715 $2,156 - $2,226 $45,828 $92,054 Reimbursement Medicaid 21.81 48.03 36.05 68.82 53.48 70.32 13.43 24.75 24.75 40.38 40.38 61.24 Rates Medicaid 4% 206 $3,151 $5,452 $1,116 $3,551 - $1,451 $139 $255 $511 $250 - $253 $4,917 $11,213 Reimbursement Medicare 23.25 44.66 44.66 67.71 67.71 113.03 21.80 22.91 41.31 44.21 64.57 68.48 Rates Medicare 58% 2,993 $48,708 $73,512 $20,049 $50,661 - $33,828 $3,262 $3,428 $12,363 $3,969 - $4,099 $84,382 $169,497 Reimbursement Self Pay Rates 16.36 36.02 27.04 51.62 40.11 52.74 10.07 18.56 18.56 30.29 30.29 45.93 Self Pay 8% 413 $4,727 $8,179 $1,674 $5,327 - $2,177 $208 $383 $766 $375 - $379 $7,375 $16,820 Collections Other 0% - 58.33 58.33 94.76 94.76 131.27 131.27 29.16 29.16 47.49 47.49 67.48 67.48 Total 100% 5,160 $83,039 $127,068 $33,728 $87,052 - $55,828 $5,380 $5,929 $20,355 $6,750 - $6,957 $142,502 $289,584 % of Care Assumption 70% 55% 15% 25% 0% 10% 5% 5% 10% 3% 0% 2%
  • 4.
    300,000 Before 280,000 After 260,000 240,000 220,000 200,000 180,000 160,000 140,000 120,000 100,000 80,000 60,000 40,000 20,000 0 Commercial Medicaid Medicare Self Pay Collections Total Reimbursement Reimbursement Reimbursement
  • 5.
    Conclusion • PAT Servicespreviously provided physician to client hospital as an independent contractor but had no other involvement • Hospital previously contracted with an outside service to handle PAT billing & eventually began handling billing internally but could not recover cost • PAT Services was asked to review PAT practice performance and made multiple suggestions regarding improving results • PAT Services was asked to manage physician & provide billing service. • Upon engaging in management of PAT department the same physician was retrained in E & M code selection & correct documentation by PAT services experts. • PAT Services initated quarterly internal chart audits with results communicated back to physician • PAT Service increased annual collections by more than 100% for client hospital from $142,502 to $289,584, which in turn transitioned the hospital’s PAT department from a cost center to a revenue generating center