Download to read offline
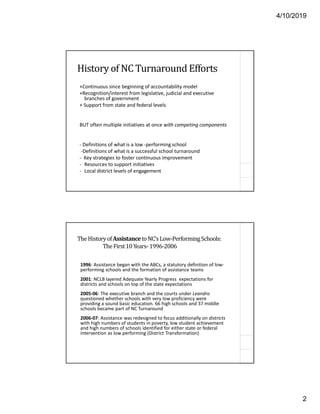
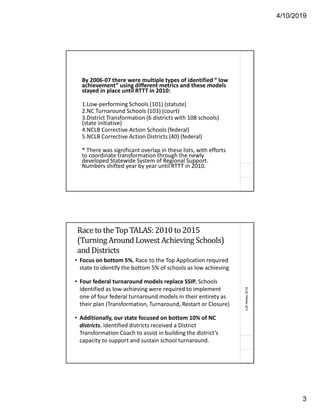


The document reviews North Carolina's ongoing efforts to improve student achievement in low-performing schools through various initiatives over two decades. It covers the historical context, including the implementation of the 'Race to the Top' program, the evolution of support models, and the challenges and successes experienced in turnaround strategies. Key insights highlight the importance of effective leadership, community engagement, and sustained support for lasting educational improvements.


