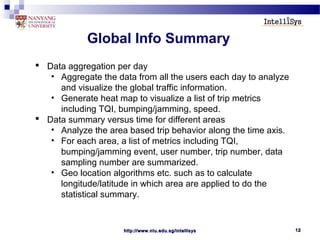
The document describes a participatory platform for measuring trip quality using smartphone sensors. Key points:
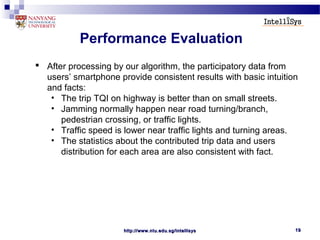
- The system collects accelerometer and GPS data from user smartphones to analyze trip quality, detect bumps and jams, and visualize traffic analytics.
- Apps were developed for iOS and Android to collect data. Algorithms were implemented for trip quality index calculation, bump/jam detection, and moving time percentage.
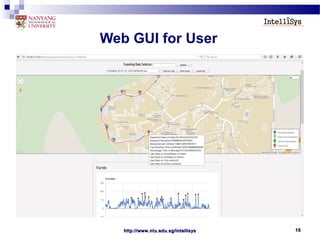
- A backend server stores and processes the data. A website allows users to view personal trip data and agencies to view global traffic information.
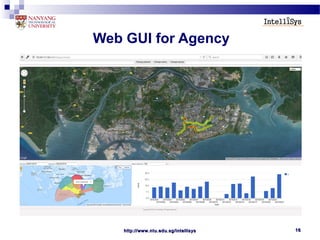
- Data collection and testing involved over 100 users and 700 trips. Algorithms achieved over 86% accuracy for trip quality calculation and 93% for event detection.


![http://www.ntu.edu.sg/intellisyshttp://www.ntu.edu.sg/intellisys 99
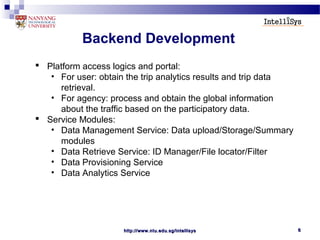
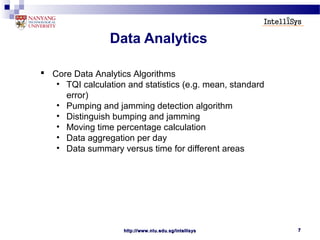
Distinguish Bumping and Jamming
2 2
2 2 2
( ) /
| | | |
| | ( ) ( )
| | ( ) ( ) ( )
event v h total
z
v t
x y
h t t
x y z
total t t t
R Vector Vector Vector
Vector a
Vector a a
Vector a a a
= −
=
= +
= + +
eventR has value between [-1, 1], the sign can distinguish the
bumping and jamming events, the value gives the information
of how pure of the event is bumping or jamming
Bumping will result in vertical acceleration.
Jamming will result in horizontal acceleration.
Bumping indicates the road situation.
Jamming may be caused by diver behavior or road situation.
We define an event ratio to distinguish the bumping and
jamming events.](https://image.slidesharecdn.com/3ba74314-0a19-4910-a88b-1f991bf27813-151003164013-lva1-app6891/85/Participatory-Project-9-320.jpg)
![http://www.ntu.edu.sg/intellisyshttp://www.ntu.edu.sg/intellisys 1111
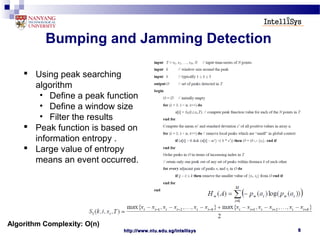
Overall TQI for Whole Trip
Using our algorithm, we compute a list of statistical metrics:
Expected Value of instant TQI for whole trip, Ev
Standard Deviation of instant TQI, Sd
Events (normalized bump/jam) per minute, events
Percentage Time in moving, moving
User Ratings, ratings
By weighting the list of metrics and mapping them to [0,100] for the
whole trip, we compute the Overall TQI :
0.3 0.1 0.3 0.1 0.2Ev Sd events moving ratings+ + + +](https://image.slidesharecdn.com/3ba74314-0a19-4910-a88b-1f991bf27813-151003164013-lva1-app6891/85/Participatory-Project-11-320.jpg)


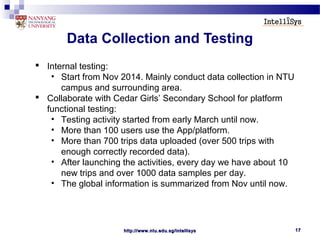
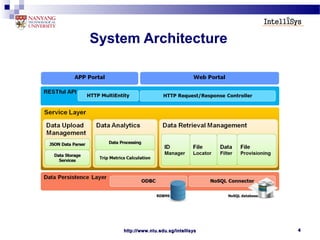
![http://www.ntu.edu.sg/intellisyshttp://www.ntu.edu.sg/intellisys 2020
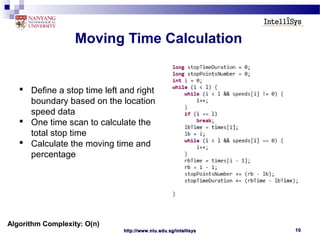
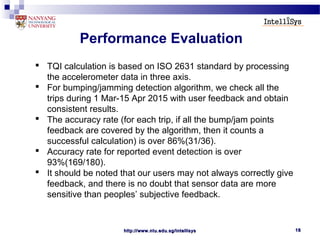
Performance Evaluation
We calculate the distribution of all the trips’ TQI
The TQI of most trips is below 50.
Only small number of trips at both ends of the profile.
Two peaks at [7-14] and [21-28].
More than half the trips have TQI in the range [17-31].](https://image.slidesharecdn.com/3ba74314-0a19-4910-a88b-1f991bf27813-151003164013-lva1-app6891/85/Participatory-Project-20-320.jpg)


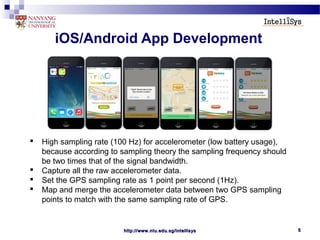
![http://www.ntu.edu.sg/intellisyshttp://www.ntu.edu.sg/intellisys 2525
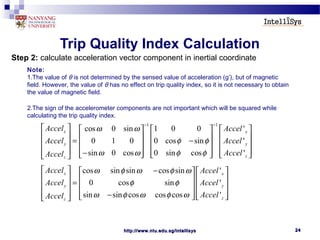
Step 3: calculate acceleration and trip quality index
ISO 2631 standard[1]:
[1] ISO. ISO 2631-1-1997: Mechanical vibration and shock Evaluation of human exposure to whole-body vibration. International Organization for
Standardization, Geneva, Switzerland, 1997.
*Cheng-Yu Lin, Ling-Jyh Chen, Ying-Yu Chen, and Wang-Chien Lee, “Comfort Measuring System for Public Transportation Systems Using
Participatory Phone Sensing”
2 2 2
(1.4a ) (1.4a )x y z
t t t ta a= + +
Expressed in log(dB):
5 2
20log , 10 / sect
t ref
ref
a
L a m
a
−
= =
100, 103
5 ( 83)
0, 83
t
index t
t
L
Q L
L
>
= × −
<
Trip Quality calculation:
Trip Quality index calculation](https://image.slidesharecdn.com/3ba74314-0a19-4910-a88b-1f991bf27813-151003164013-lva1-app6891/85/Participatory-Project-25-320.jpg)