Download to read offline


![2 INTRODUCTION
The following diagram gives an idea of the interaction of pandora plugin.
This paper aims at describing the monitoring of PostgreSQL databases on Unix.
To extract the information is used:
• An external configuration file which defines all the parameters of the plugin.
• It uses the software already installed on the system for monitoring by the plugin
without having to install third party libraries or utilities.
• They perform a number of basic checks "default", but you can remove or customize.
• It has an interface "open" to specify SQL queries free model allowing SQL queries
always return a data only.
From a general point of view Pandora fms launches plugin, loading the configuration parameters
from file configuracion.ini and performs a series of queries to postgres server and returns an xml
monitoring, which is collected by pandora.
We can also launch this plugin from the command line:
./pandora_postgres_plugin.pl -f file-config
This implementation is using a configuration file (or boot) called configuración.ini, if we throw
without use file would be:
./pandora_postgres_plugin.pl -u user -c password [-n basename] [-d dir_ip_server] [-p port] [-h]
For more info ./pandora_postgres_plugin.pl -h
Page 4](https://image.slidesharecdn.com/pandorapostgresplugin-140409102005-phpapp01/85/Pandora-FMS-PostgreSQL-Plugin-4-320.jpg)
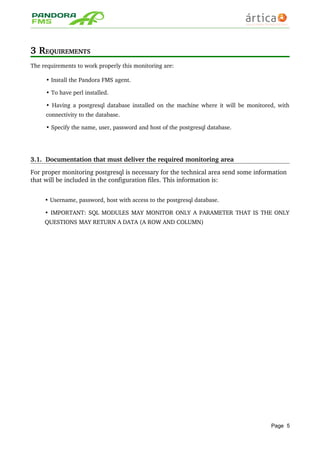
![5 INSTALLATION
To install this plugin must follow the following steps:
1st. Copy and plugin configuration file in / etc / pandora / plugins / (if you have the plugin oars in
another folder see step 2).
2nd. Access the folder where the configuration file pandora_agent.conf (in ubuntu / etc / pandora.
In this file we add a line
module_plugin perl pandora_postgres_plugin.pl -f filename_config 2>
/etc/pandora/plugins/error.log
In case you want to install the plugin into a separate folder will be the following line:
module_plugin perl path/pandora_postgres_plugin.pl -f filename_config 2>
/etc/pandora/plugins/erro.log
To perform this action you can use the following command:
sudo echo "module_plugin path/pandora_postgres_plugin.pl -f filename_config 2>
/etc/pandora/plugins/error.log" >> /etc/pandora/ pandora_agent.conf
Also you can install without having a configuration file, then the command is:
module_plugin ./pandora_postgres_plugin.pl -u user -c password [-n basename] [-d
dir_ip_server] [-p port] 2> error.log
3 º. Reboot the agent.
sudo /etc/init.d/pandora_agent_daemon
We can also install the plugin if you use the configuration file, but lose some features (like creating
your own queries).
Page 7](https://image.slidesharecdn.com/pandorapostgresplugin-140409102005-phpapp01/85/Pandora-FMS-PostgreSQL-Plugin-7-320.jpg)


The document serves as an administrator manual for monitoring PostgreSQL databases on Unix using the Pandora FMS plugin. It outlines the installation process, requirements, and configuration necessary for effectively monitoring database parameters. The plugin performs basic checks and allows for customized SQL queries through a specific configuration file.


![[오픈소스컨설팅] 프로메테우스 모니터링 살펴보고 구성하기](https://cdn.slidesharecdn.com/ss_thumbnails/oscprometheus-190422050231-thumbnail.jpg?width=640&height=640&fit=bounds)