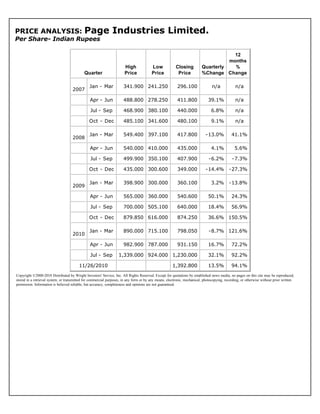
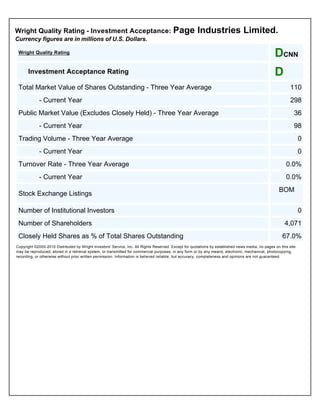
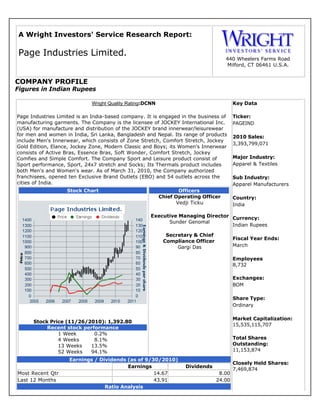
Page Industries Limited is an India-based manufacturer of garments. It holds the license to manufacture and distribute JOCKEY branded innerwear and leisurewear in India and surrounding countries. According to a recent analysis, Page Industries has experienced strong sales growth and increasing profitability in recent years. However, its stock valuation ratios are high relative to competitors in the apparel manufacturing industry.
The document contains fact sheets for several Fidelity funds, including the Fidelity Equity Fund and Fidelity Tax Advantage Fund. It provides information such as fund objectives, fund managers, portfolio breakdowns by industry, and past performance. The Fidelity Equity Fund is an open-ended equity growth scheme that primarily invests in sectors like banks, software, pharmaceuticals, and consumer goods. The Fidelity Tax Advantage Fund is an open-ended equity linked savings scheme that complies with Section 80C of the Income Tax Act and primarily invests in sectors like consumer goods, banks, software, and pharmaceuticals.
The document provides portfolio information for Fidelity India Tax Advantage Fund as of May 31, 2011. Some of the top holdings include Reliance Industries Ltd., ITC Ltd., ICICI Bank Ltd., and HDFC Bank Ltd. The portfolio had a total value of Rs. 12,469.39 lakhs invested across various industries, with the largest allocations to petroleum products, banks, consumer non-durables, and software. The fund manager is Sandeep Kothari, with over 17 years of experience.
Bharti Airtel received several prestigious awards in 2009-2010, recognizing its leadership and excellence in the telecom industry. This included being rated as India's strongest brand and 7th most valuable brand. Bharti Airtel was also recognized as the top telecom services provider and best enterprise connectivity provider. The company's CEO received the Global Economy Prize for his contributions. These awards demonstrate Bharti Airtel's continued success and leadership in the telecom sector in India and globally.
The document provides an overview and financial analysis of Hero MotoCorp Ltd. It discusses Hero MotoCorp's background, brands, and separation from Honda. The financial analysis includes ratios like gross profit ratio, net profit ratio, current ratio, and earnings per share from 2010-2012. Most ratios declined in 2011 due to expenses from the Honda separation but recovered in 2012. The presentation emphasizes that Hero MotoCorp remains financially stable despite challenges.
The document provides a daily market commentary and update. It discusses the Indian equity market reaching a 2-year high despite economic problems, and advises value investors to exercise care in initiating new positions. It lists holdings of the CP-Artha model portfolio and contact details. Global indices and the performance of key Indian indices are also summarized. News articles covering various companies and sectors are highlighted.
Page Industries is the exclusive licensee of JOCKEY® brand of innerwear and leisurewear in India up to 2030. The company has a dominant presence in the fast-growing premium segment of the innerwear and leisurewear market in India. Page Industries commands a 14.4% market share of the potential Rs3,740 crore premium and super-premium market, which is expected to grow at 31% annually. The company has strong brand recall for JOCKEY® in India as well as a widespread pan-India distribution network of over 16,000 retail outlets.
The document provides a daily market commentary and analysis. It summarizes movements in various global and domestic indices, turnover numbers for foreign and domestic institutional investors, and currency exchange rates. It also lists the top gaining and losing stocks in the Nifty index. Special situation stocks and their commentary are presented. Key news headlines from business dailies are highlighted touching on various sectors. Insider trading activity and upcoming corporate actions are also noted.
The document is a market commentary from CP-Artha dated January 17, 2013. It provides an index on Indian battery companies called CPA-BATTEX, noting the two largest companies by market value are Exide Industries and Amara Raja Batteries. Amara Raja appears undervalued with potential upside. It also lists holdings in CP-Artha's model portfolio and provides global market indices, commodity prices, and Indian stock market news headlines.
The document provides a market commentary and analysis from Valuehunt on January 4th, 2013. It includes the P/E ratio of the BSE Sensex index, holdings in Valuehunt's model portfolio, global market indices performance, sectoral indices in India, notable gaining and losing stocks in the Nifty, and headlines from business publications. The document also discusses two companies undergoing demergers.
The document is a market commentary and newsletter from Valuehunt dated January 9, 2013. It provides an analysis of Aarti Drugs as an undervalued stock, discusses the company's business operations and potential 57% upside. It also lists CP-Artha Model Portfolio holdings and two special situation stocks - Ganesha Ecosphere trading at a 52-week low and Educomp Solutions announcing the sale of its Eurokids stake. Global indices movements and sectoral index prices are included along with commodity prices, bulk deals, insider trading and upcoming corporate actions.
The document provides a daily market commentary and notes from Valuehunt on April 9, 2013. It includes updates on the Indian market indices and global markets, commentary from finance ministers on removing roadblocks for long term projects in India, and value stock picks such as Aditya Birla Nuvo which is divesting its carbon black business. Special situation stocks with corporate actions like buybacks are also highlighted.
The document is a portfolio statement for a mutual fund as of July 29, 2011. It lists the fund's top 20 holdings by market value, which make up over 50% of the total assets. The portfolio has significant exposure to banks, software, consumer non-durables, pharmaceuticals, and petroleum products. It also provides industry diversification breakdown and notes a portfolio turnover ratio of 0.26 times for the past year.
The document summarizes recent updates from SEBI regarding open offers. It describes an order from SEBI in the case of Mysore Cements Limited where SEBI decided the acquirers should have included a non-compete payment as part of the offer price. It also provides details of 4 recent open offers made by acquirers for the shares of AV Cottex Limited, Camlin Fine Chemicals Limited, New Delhi Television Limited, and Parekh Distributors Limited. The offers were made in accordance with takeover regulations to acquire between 20-69.59% shares of the target companies.
This document provides a summary of delisting offers that occurred from January 2012 to May 2012. It discusses the delisting of four companies - UTV Software Communication Limited, Nirma Limited, Carol Info Services Limited, and Alfa Laval (India) Limited. For each company, it provides the date of the initial delisting notification, shareholding of promoters, market price at the time, floor price offered in the delisting offer, and final delisted price. It also includes graphs comparing the market and offer prices over time for some companies. The document is intended to keep readers informed about recent delisting activities in India.
This document provides a summary of recent updates, top M&A deals of 2007, and a regular section on bailout takeovers. Recent updates include informal guidance from SEBI on an acquisition through a scheme of arrangement approved by a foreign court. The document also summarizes consent orders issued by SEBI for violations of disclosure regulations. The regular section provides an overview of the process for bailout takeovers led by public financial institutions of financially weak companies that do not require BIFR intervention.
- The key Indian stock indices (Sensex and Nifty) declined on the day by around 0.5-0.6% due to losses in IT, oil & gas, and FMCG stocks, as well as ongoing F&O expiry.
- Asian markets were trading higher in morning hours, ahead of the US fiscal cliff negotiations.
- The EGoM on spectrum is expected to meet next week to discuss details of upcoming spectrum auctions.
The market is falling as predicted. Investors should not be concerned if portfolio holdings touch yearly lows if fundamentals remain strong. Mid-cap stocks did not participate in the recent market rally. The implied risk premium for Indian equities is 3.626% with a cost of equity of 15.096%. The document lists holdings of the CP-Artha model portfolio and provides global index prices, sectoral index prices, insights on special situation stocks, and details on insider trading and corporate actions.
The document provides a market commentary and analysis for October 15, 2012. It summarizes that last week the Indian equity market ended flat after fluctuating up and down. It also discusses some company earnings results and notes that subsequent weeks will determine the market trend. The rest of the document lists the author's stock holdings and provides global market indices data, sector indices, and notable news headlines.
Vedanta Resources and Sesa Goa have agreed to acquire a 51-60% stake in Cairn India from Cairn Energy for Rs405 per share, of which Rs355 per share is for acquisition and Rs50 is a non-compete fee. Vedanta and Sesa Goa will make an open offer for 20% of Cairn India shares at Rs355 per share, and Sesa Goa will make a strategic investment of 20% in Cairn India acquired from Vedanta. The deal is subject to regulatory approvals and a special shareholder resolution.
The document is a market commentary and daily report from CP-Artha Financial Advisory Private Ltd dated 14 January 2013. It includes the following:
1) Details of a new index created by CP-Artha to track the top 10 Indian pharmaceutical companies called CPA-PHARMA, which has grown at a CAGR of 20.2% over the last 10 years.
2) A list of 10 stocks in CP-Artha's model portfolio.
3) Global market indices prices and changes, Indian market movement details, and currency rates.
Tech Mahindra's recent deal restructuring with BT ends uncertainty and guarantees volumes. While margins are currently weak due to the BT deal and Satyam uncertainty, margins are expected to eventually recover to peer levels as the company has a pedigree as a tier-1 player. The stock currently looks attractive relative to peers on an EV/Sales basis, trading at a substantial discount to peer averages. Based on this, the report upgrades Tech Mahindra to a "Buy" recommendation with a target price of Rs1,168 per share.
The document provides a market commentary and analysis for the Indian equity market and various companies for December 27, 2012. It summarizes that the two major Indian indices have risen 24% in the past year despite no significant improvement in fundamentals. It predicts the first half of 2013 will be bullish for the market. It also provides updates on company holdings, global market indices, sectoral indices, commodity prices, and other news headlines.
Ador Fontech Ltd is recommended as a safe long-term investment. It manufactures welding consumables and is currently trading at attractive valuation multiples, with high returns on assets, equity, and operating margins over 16% consistently. The document also lists the holdings of the CP-Artha model portfolio and provides updates on special situation stocks and their divestitures or restructurings. Global indices closing prices and changes are also included.
Trade and Industry Mahasammelan, BarodaOutlook Menia
This document summarizes the Vibrant Gujarat global business summit held in 2011 in Gujarat, India. It discusses the history and growth of investment and employment generated from the summits since 2003. Vibrant Gujarat 2011 aimed to attract over Rs. 20 lakh crore in investments and create over 60 lakh jobs, focusing on manufacturing, infrastructure and social sectors. It also introduces Mission Mangalam, an initiative to organize the poor into self-help groups, provide business training and link them to markets to generate sustainable livelihoods through the Gujarat Livelihood Promotion Company.
The key points from the document are:
1) Reliance Industries reported its fourth consecutive quarterly decline in profits, with EBITDA down 10% and net income down 6%, due to falling natural gas output and weak petrochemical margins.
2) Axis Bank reported a 22% rise in Q2 net profit.
3) The document provides an update on global market indices, sectoral indices in India, key gainers and losers on the Nifty, and headlines from business newspapers.
The Indian stock markets gained on March 8, recovering from losses in the previous session. The BSE Sensex rose 1.19% to close at 18,440 points and the NSE Nifty gained 1.06% to end at 5,521 points. Sentiment improved after crude oil prices fell and the Congress party and DMK party reopened talks in Tamil Nadu. Global markets also rose, with the Dow gaining 1.03% and Nasdaq up 0.74%. Asian markets opened higher as well on strong US performance. Domestically, companies announced new partnerships, acquisitions, and business expansions. Bond yields were mostly unchanged.
Pantaloon Retail reported a 25.3% year-over-year growth in net sales to Rs. 2,057.6 crore for the third quarter of fiscal year 2010, below expectations of 30.2% growth. Same store sales growth was 13.9% and 13.2% for value and lifestyle retailing respectively. Operating margins remained flat at 10.5% while net profit grew 62.7% to Rs. 55.9 crore due to sales growth and unchanged interest costs. The analyst maintains an accumulate rating and target price of Rs. 469 based on retail space expansion, revival in consumer sentiment, and organizational restructuring.
This document provides an analysis of the balance sheet of Maruti Suzuki for the years 2009-2010. It begins with an introduction and overview of the company, including its vision, mission, market scenario, and sales analysis. Financial highlights for Maruti Suzuki from 2009-2010 are presented, including net sales, profit before tax, reported net profit, and earnings per share. The document then discusses the objectives of financial analysis and ratio analysis. It provides classifications and calculations of various ratios to analyze Maruti Suzuki's profitability, liquidity, activity, and leverage. The conclusion indicates that the report gives a complete financial analysis of Maruti Suzuki for five years through the use of ratio analysis.
Nirma Limited's authorized share capital increased from 2007 to 2008 while 56.8% of authorized shares were issued and paid up. Promoters held around 77% of issued shares while institutional investors like mutual funds were the largest institutional holders. The document provides details on Nirma's share types and holders, reported profits, dividends, retained earnings, and return on equity to calculate the stock's internal value of Rs. 58.52 per share as of 2008. Since the market price was Rs. 97.65, the document concludes Nirma stock would be a good sell.
Pratibha ind Result Update 4 qfy2010-110510Angel Broking
Pratibha Industries reported financial results for the fourth quarter of fiscal year 2010 that were in line with expectations. Operating margins improved significantly due to a reduction in raw material costs, boosting the bottom line. However, the company paid taxes at the marginal rate rather than claiming tax benefits. While the results were decent, the analyst maintains a neutral outlook on the stock given that positives are already reflected in the price.
1. Mahindra and Mahindra (M&M) reported good results for the first quarter of the fiscal year 2011, with net sales up 21.6% and operating profit up 27.4% compared to the same period last year.
2. Net profit beat analyst expectations by 11%, reaching Rs. 562 crore due to lower than expected tax rates and higher interest income.
3. The report recommends maintaining a "Buy" rating for M&M, setting a target price of Rs. 772 based on the company's core business valuation and value of investments.
Religare financial p-197 fit hait tabhi to hit haigauravrao01
Religare Securities Ltd is a financial services company that provides broking, depository, and advisory services. The author conducted a summer internship with Religare Securities Ltd in Noida to learn about the share market and different depository account types. Through research and customer surveys, the author analyzed Religare and competitors to understand their offerings and identify opportunities to increase Religare's customer base.
South Indian Bank reported net profits of Rs. 58 crore for the first quarter of fiscal year 2011, in line with analyst estimates. Business growth was strong, with advances growing 33.6% year-over-year and deposits growing 25.1% year-over-year. Asset quality remained stable with gross and net NPA ratios of 1.3% and 0.4% respectively. Operating expenses grew 47.1% sequentially but the bank plans to control expenses going forward. The analyst maintains a Neutral rating on the stock as it trades at 6.8 times estimated fiscal year 2012 earnings per share of Rs. 28.5 per share.
HDFC Life and ICICI Prudential : Financial analysis and Portfolio Comparisonkkslideshare77
The document compares HDFC Life and ICICI Prudential Life Insurance through financial analysis and a product comparison. It analyzes the insurers' solvency ratios, operating expenses, assets under management, and unit linked funds. HDFC Life's solvency ratio is above the regulatory requirement of 1.5. The document also compares the insurers' term assurance plan products and portfolios. Key differences and inferences about the companies are presented.
Tata Motors and Maruti Suzuki are two major automobile companies in India. Tata Motors has a higher debt to equity ratio, indicating it is more reliant on debt financing. Maruti Suzuki has significantly higher reserves and surplus compared to Tata Motors, and saw a 23% increase in reserves year-over-year compared to 14% for Tata. While both companies have experienced declines in share prices recently, Tata Motors may be a better investment due to underperformance from declining sales and profits in recent years from investments and acquisitions.
Chaitanya India Fin Credit Private Limited reported its annual results for the 2011-2012 financial year. While profit after tax was close to expectations, the loan portfolio grew slower than planned due to difficulties accessing debt funds. Key highlights included a focus on improving operational quality, stabilizing branches and processes, and piloting new products like gold loans and livestock insurance. Overall it was a year of consolidation after regulatory changes, with an emphasis on developing a robust and sustainable business model.
Anant Raj Industries' (ARIL) 4QFY2010 results were below expectations due to a delay in launching a premium residential project. Rental income grew 10.6% but profit fell 53.9% quarter-over-quarter. The analyst downgraded earnings estimates for FY2011-FY2012 to account for the delayed project launch. However, ARIL has a strong development pipeline and the analyst maintains a Buy rating due to ARIL's low-cost land bank and strong balance sheet.
1) Marico India Ltd is a consumer goods company founded in 1857 and headquartered in Mumbai. It provides coconut, hair, skin care and other products.
2) In 2010, Marico's operating profit margin of 16.01% and net profit margin of 11.57% were the highest of the past 5 years, indicating increased profitability.
3) Key financial ratios like earnings per share and return on net worth have also increased from 2009-2010, demonstrating the company's improved performance and returns to shareholders over this period.
A complete presentation on hero moto corp, with financial analysis and future trends , ideal presentation for management students , preapred by kunal khamesra, COLLEGE OF TECHNOLOGY AND ENGINEERING , MPUAT UNIVERSITY , M.B.A(TECH) , hope you will like it
State Bank of India reported a 25.1% year-over-year increase in net profit for the first quarter of fiscal year 2011, exceeding analyst estimates. Net interest income grew 45.4% year-over-year due to a rise in low-cost deposits and narrowing of net interest margin. Loan growth was 20.4% year-over-year while deposit growth was 6.8% year-over-year. Non-performing assets rose slightly during the quarter but asset quality remained reasonable with net NPA ratio of 1.7%. The analyst maintains an "Accumulate" rating on the stock.
PTC India Financial Services (PFS), a subsidiary of PTC India, has been granted infrastructure financial company (IFC) status by the Reserve Bank of India. This will allow PFS to raise funds more easily and provide higher exposure to single borrowers. It is expected to reduce PFS' cost of borrowing and prove positive for business. PFS holds equity stakes ranging from 26-37% in various power generation projects including renewable and conventional sources with a total portfolio capacity of over 2,000MW.
The document is a portfolio statement for a mutual fund as of July 29, 2011. It lists the fund's top 20 holdings by market value, which make up over 50% of the total assets. The portfolio has significant allocation to the banking, software, petroleum products, and pharmaceuticals industries. It also provides information on the fund managers, annual expenses, and portfolio turnover ratio.
ICICI Bank is India's second largest bank, established in 1955. It has over 1,399 branches and 4,485 ATMs across India. The bank has subsidiaries in the UK, Russia, and Canada, as well as branches in the US, Singapore, and other countries. ICICI Bank reported a net profit of Rs. 1,395 crore for the second quarter of FY2011, a growth of 21.83% over the same period last year. The bank's capital adequacy ratio was at 20.2% for the second quarter of FY2011.
JK Tyre reported net sales growth of 23% year-over-year for the quarter, but profit was below expectations due to a substantial increase in raw material costs. Raw material prices increased significantly both quarter-over-quarter and year-over-year, squeezing operating margins. The company has plans to expand capacity across segments to capitalize on demand growth and offset rising input costs, with most new capacity coming online in 2011-2012.
Maruti Suzuki reported quarterly results that were below expectations, with net profit growing 170% year-over-year to Rs. 657 crore, lower than projected. Volume growth drove the company's 31% year-over-year increase in net sales to Rs. 8,425 crore for the quarter. Margins increased significantly year-over-year due to improved operating leverage and lower raw material costs, but declined sequentially. The company maintained its annual capex plan of Rs. 9,000 crore to be spent between 2008-2012 for expansion purposes.
The document is the annual report for 2008-09 of CORE Projects and Technologies Limited, an Indian education company that provides technology-enabled education solutions globally. It discusses the company's operational and financial highlights for the year, including acquiring the K12 division of The Princeton Review and increasing its presence in several US states. The Chairman's statement reflects on the company's continued growth and focus on quality education through technological solutions.
3 Simple Steps To Buy Verified Payoneer Account In 2024SEOSMMEARTH
Buy Verified Payoneer Account: Quick and Secure Way to Receive Payments
Buy Verified Payoneer Account With 100% secure documents, [ USA, UK, CA ]. Are you looking for a reliable and safe way to receive payments online? Then you need buy verified Payoneer account ! Payoneer is a global payment platform that allows businesses and individuals to send and receive money in over 200 countries.
If You Want To More Information just Contact Now:
Skype: SEOSMMEARTH
Telegram: @seosmmearth
Gmail: seosmmearth@gmail.com
Zodiac Signs and Food Preferences_ What Your Sign Says About Your Tastemy Pandit
Know what your zodiac sign says about your taste in food! Explore how the 12 zodiac signs influence your culinary preferences with insights from MyPandit. Dive into astrology and flavors!
Structural Design Process: Step-by-Step Guide for BuildingsChandresh Chudasama
The structural design process is explained: Follow our step-by-step guide to understand building design intricacies and ensure structural integrity. Learn how to build wonderful buildings with the help of our detailed information. Learn how to create structures with durability and reliability and also gain insights on ways of managing structures.
[To download this presentation, visit:
https://www.oeconsulting.com.sg/training-presentations]
This PowerPoint compilation offers a comprehensive overview of 20 leading innovation management frameworks and methodologies, selected for their broad applicability across various industries and organizational contexts. These frameworks are valuable resources for a wide range of users, including business professionals, educators, and consultants.
Each framework is presented with visually engaging diagrams and templates, ensuring the content is both informative and appealing. While this compilation is thorough, please note that the slides are intended as supplementary resources and may not be sufficient for standalone instructional purposes.
This compilation is ideal for anyone looking to enhance their understanding of innovation management and drive meaningful change within their organization. Whether you aim to improve product development processes, enhance customer experiences, or drive digital transformation, these frameworks offer valuable insights and tools to help you achieve your goals.
INCLUDED FRAMEWORKS/MODELS:
1. Stanford’s Design Thinking
2. IDEO’s Human-Centered Design
3. Strategyzer’s Business Model Innovation
4. Lean Startup Methodology
5. Agile Innovation Framework
6. Doblin’s Ten Types of Innovation
7. McKinsey’s Three Horizons of Growth
8. Customer Journey Map
9. Christensen’s Disruptive Innovation Theory
10. Blue Ocean Strategy
11. Strategyn’s Jobs-To-Be-Done (JTBD) Framework with Job Map
12. Design Sprint Framework
13. The Double Diamond
14. Lean Six Sigma DMAIC
15. TRIZ Problem-Solving Framework
16. Edward de Bono’s Six Thinking Hats
17. Stage-Gate Model
18. Toyota’s Six Steps of Kaizen
19. Microsoft’s Digital Transformation Framework
20. Design for Six Sigma (DFSS)
To download this presentation, visit:
https://www.oeconsulting.com.sg/training-presentations
How to Implement a Real Estate CRM SoftwareSalesTown
To implement a CRM for real estate, set clear goals, choose a CRM with key real estate features, and customize it to your needs. Migrate your data, train your team, and use automation to save time. Monitor performance, ensure data security, and use the CRM to enhance marketing. Regularly check its effectiveness to improve your business.
Discover timeless style with the 2022 Vintage Roman Numerals Men's Ring. Crafted from premium stainless steel, this 6mm wide ring embodies elegance and durability. Perfect as a gift, it seamlessly blends classic Roman numeral detailing with modern sophistication, making it an ideal accessory for any occasion.
https://rb.gy/usj1a2
How are Lilac French Bulldogs Beauty Charming the World and Capturing Hearts....Lacey Max
“After being the most listed dog breed in the United States for 31
years in a row, the Labrador Retriever has dropped to second place
in the American Kennel Club's annual survey of the country's most
popular canines. The French Bulldog is the new top dog in the
United States as of 2022. The stylish puppy has ascended the
rankings in rapid time despite having health concerns and limited
color choices.”
Digital Marketing with a Focus on Sustainabilitysssourabhsharma
Digital Marketing best practices including influencer marketing, content creators, and omnichannel marketing for Sustainable Brands at the Sustainable Cosmetics Summit 2024 in New York
The APCO Geopolitical Radar - Q3 2024 The Global Operating Environment for Bu...APCO
The Radar reflects input from APCO’s teams located around the world. It distils a host of interconnected events and trends into insights to inform operational and strategic decisions. Issues covered in this edition include:
IMPACT Silver is a pure silver zinc producer with over $260 million in revenue since 2008 and a large 100% owned 210km Mexico land package - 2024 catalysts includes new 14% grade zinc Plomosas mine and 20,000m of fully funded exploration drilling.
Taurus Zodiac Sign: Unveiling the Traits, Dates, and Horoscope Insights of th...my Pandit
Dive into the steadfast world of the Taurus Zodiac Sign. Discover the grounded, stable, and logical nature of Taurus individuals, and explore their key personality traits, important dates, and horoscope insights. Learn how the determination and patience of the Taurus sign make them the rock-steady achievers and anchors of the zodiac.
Event Report - SAP Sapphire 2024 Orlando - lots of innovation and old challengesHolger Mueller
Holger Mueller of Constellation Research shares his key takeaways from SAP's Sapphire confernece, held in Orlando, June 3rd till 5th 2024, in the Orange Convention Center.
Best practices for project execution and deliveryCLIVE MINCHIN
A select set of project management best practices to keep your project on-track, on-cost and aligned to scope. Many firms have don't have the necessary skills, diligence, methods and oversight of their projects; this leads to slippage, higher costs and longer timeframes. Often firms have a history of projects that simply failed to move the needle. These best practices will help your firm avoid these pitfalls but they require fortitude to apply.
Easily Verify Compliance and Security with Binance KYCAny kyc Account
Use our simple KYC verification guide to make sure your Binance account is safe and compliant. Discover the fundamentals, appreciate the significance of KYC, and trade on one of the biggest cryptocurrency exchanges with confidence.
Building Your Employer Brand with Social MediaLuanWise
Presented at The Global HR Summit, 6th June 2024
In this keynote, Luan Wise will provide invaluable insights to elevate your employer brand on social media platforms including LinkedIn, Facebook, Instagram, X (formerly Twitter) and TikTok. You'll learn how compelling content can authentically showcase your company culture, values, and employee experiences to support your talent acquisition and retention objectives. Additionally, you'll understand the power of employee advocacy to amplify reach and engagement – helping to position your organization as an employer of choice in today's competitive talent landscape.
B2B payments are rapidly changing. Find out the 5 key questions you need to be asking yourself to be sure you are mastering B2B payments today. Learn more at www.BlueSnap.com.
Brian Fitzsimmons on the Business Strategy and Content Flywheel of Barstool S...Neil Horowitz
On episode 272 of the Digital and Social Media Sports Podcast, Neil chatted with Brian Fitzsimmons, Director of Licensing and Business Development for Barstool Sports.
What follows is a collection of snippets from the podcast. To hear the full interview and more, check out the podcast on all podcast platforms and at www.dsmsports.net
Dpboss Matka Guessing Satta Matta Matka Kalyan Chart Satta Matka
Page industries
1. Company FundamentalsCompany FundamentalsCompany Profile
A Wright Investors' Service Research Report:
Page Industries Limited.
440 Wheelers Farms Road
Milford, CT 06461 U.S.A.
COMPANY PROFILE
Figures in Indian Rupees
Wright Quality Rating:DCNN Key Data
Page Industries Limited is an India-based company. It is engaged in the business of Ticker:
manufacturing garments. The Company is the licensee of JOCKEY International Inc. PAGEIND
(USA) for manufacture and distribution of the JOCKEY brand innerwear/leisurewear
for men and women in India, Sri Lanka, Bangladesh and Nepal. Its range of products 2010 Sales:
include Men's Innerwear, which consists of Zone Stretch, Comfort Stretch, Jockey
3,393,799,071
Gold Edition, Elance, Jockey Zone, Modern Classic and Boys; its Women's Innerwear
consists of Active Bras, Essence Bras, Soft Wonder, Comfort Stretch, Jockey
Comfies and Simple Comfort. The Company Sport and Leisure product consist of Major Industry:
Sport performance, Sport, 24x7 stretch and Socks; Its Thermals product includes Apparel & Textiles
both Men's and Women's wear. As of March 31, 2010, the Company authorized
franchisees, opened ten Exclusive Brand Outlets (EBO) and 54 outlets across the Sub Industry:
cities of India. Apparel Manufacturers
Stock Chart Officers
Chief Operating Officer Country:
Vedji Ticku India
Executive Managing Director Currency:
Sunder Genomal
Indian Rupees
Secretary & Chief
Fiscal Year Ends:
Compliance Officer
Gargi Das March
Employees
8,732
Exchanges:
BOM
Share Type:
Ordinary
Market Capitalization:
Stock Price (11/26/2010): 1,392.80
15,535,115,707
Recent stock performance
1 Week 0.2%
4 Weeks 8.1% Total Shares
13 Weeks 13.5% Outstanding:
52 Weeks 94.1% 11,153,874
Earnings / Dividends (as of 9/30/2010)
Closely Held Shares:
Earnings Dividends
7,469,874
Most Recent Qtr 14.67 8.00
Last 12 Months 43.91 24.00
Ratio Analysis
3. Company FundamentalsComparative Business Analysis
A Wright Investors' Service Research Report:
Page Industries Limited.
440 Wheelers Farms Road
Provided By CorporateInformation.com Milford, CT 06461 U.S.A.
Wright Comparative Business Analysis Report
Report Date: 11/26/2010
Company Description
Page Industries Limited is an India-based company. It is engaged in the business of manufacturing garments. The
Company is the licensee of JOCKEY International Inc. (USA) for manufacture and distribution of the JOCKEY
brand innerwear/leisurewear for men and women in India, Sri Lanka, Bangladesh and Nepal. Its range of products
include Men's Innerwear, which consists of Zone Stretch, Comfort Stretch, Jockey Gold Edition, Elance, Jockey
Zone, Modern Classic and Boys; its Women's Innerwear consists of Active Bras, Essence Bras, Soft Wonder,
Comfort Stretch, Jockey Comfies and Simple Comfort. The Company Sport and Leisure product consist of Sport
performance, Sport, 24x7 stretch and Socks; Its Thermals product includes both Men's and Women's wear. As of
March 31, 2010, the Company authorized franchisees, opened ten Exclusive Brand Outlets (EBO) and 54 outlets
across the cities of India.
Competitor Analysis
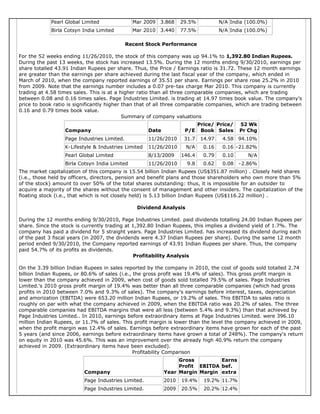
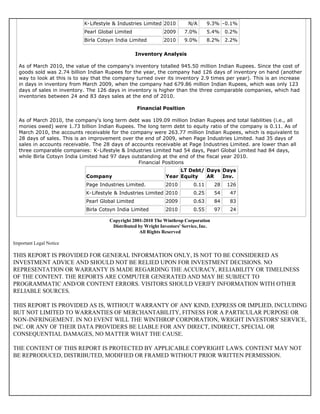
Page Industries Limited. operates in the Men's & boys' underwear & nightwear sector. This analysis compares
Page Industries Limited. with three other companies: K-Lifestyle & Industries Limited (2010 sales of 5.56
billion Indian Rupees [US$125.99 million] of which 100% was Textiles), Pearl Global Limited (2009 sales: 3.87
billion Indian Rupees [US$87.60 million] of which 100% was Readymade Garments), and Birla Cotsyn India
Limited (2010 sales of 3.44 billion Indian Rupees [US$77.92 million] of which 63% was Trading). Note: not all of
these companies have the same fiscal year: the most recent data for each company are being used.
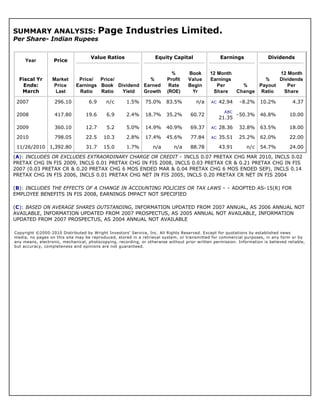
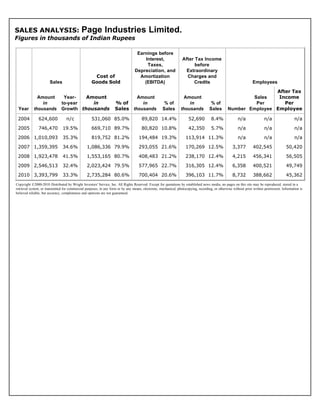
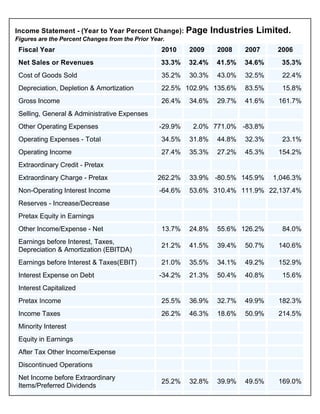
Sales Analysis
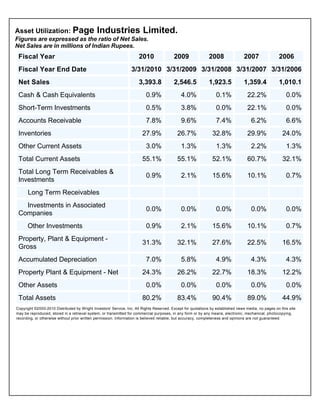
Page Industries Limited. reported sales of 3.39 billion Indian Rupees (US$76.87 million) for the fiscal year ending
March of 2010. This represents an increase of 33.3% versus 2009, when the company's sales were 2.55 billion
Indian Rupees. Sales at Page Industries Limited. have increased during each of the previous five years (and since
2005, sales have increased a total of 355%).
Recent Sales at Page Industries Limited.
3.39
2.55
1.92
1.36
1.01
0.75
2005 2006 2007 2008 2009 2010
(Figures in Billions of Indian Rupees)
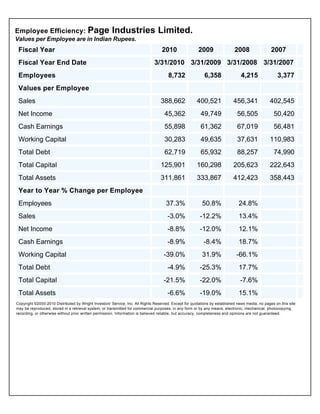
Page Industries Limited. currently has 8,732 employees. With sales of 3.39 billion Indian Rupees (US$76.87
million) , this equates to sales of US$8,803 per employee. This company's employees do not appear to be very
efficient in generating sales.
Sales Comparisons (Most Recent Fiscal Year)
Year Sales Sales Sales/
Company Ended (blns) Growth Emp (US$) Largest Region
Page Industries Limited. Mar 2010 3.394 33.3% 8,803 India (100.0%)
K-Lifestyle & Industries Limited Mar 2010 5.562 11.0% N/A India (100.0%)
4. Pearl Global Limited Mar 2009 3.868 29.5% N/A India (100.0%)
Birla Cotsyn India Limited Mar 2010 3.440 77.5% N/A India (100.0%)
Recent Stock Performance
For the 52 weeks ending 11/26/2010, the stock of this company was up 94.1% to 1,392.80 Indian Rupees.
During the past 13 weeks, the stock has increased 13.5%. During the 12 months ending 9/30/2010, earnings per
share totalled 43.91 Indian Rupees per share. Thus, the Price / Earnings ratio is 31.72. These 12 month earnings
are greater than the earnings per share achieved during the last fiscal year of the company, which ended in
March of 2010, when the company reported earnings of 35.51 per share. Earnings per share rose 25.2% in 2010
from 2009. Note that the earnings number includes a 0.07 pre-tax charge Mar 2010. This company is currently
trading at 4.58 times sales. This is at a higher ratio than all three comparable companies, which are trading
between 0.08 and 0.16 times sales. Page Industries Limited. is trading at 14.97 times book value. The company's
price to book ratio is significantly higher than that of all three comparable companies, which are trading between
0.16 and 0.79 times book value.
Summary of company valuations
Price/ Price/ 52 Wk
Company Date P/E Book Sales Pr Chg
Page Industries Limited. 11/26/2010 31.7 14.97 4.58 94.10%
K-Lifestyle & Industries Limited 11/26/2010 N/A 0.16 0.16 -21.82%
Pearl Global Limited 8/13/2009 146.4 0.79 0.10 N/A
Birla Cotsyn India Limited 11/26/2010 9.8 0.62 0.08 -2.86%
The market capitalization of this company is 15.54 billion Indian Rupees (US$351.87 million) . Closely held shares
(i.e., those held by officers, directors, pension and benefit plans and those shareholders who own more than 5%
of the stock) amount to over 50% of the total shares outstanding: thus, it is impossible for an outsider to
acquire a majority of the shares without the consent of management and other insiders. The capitalization of the
floating stock (i.e., that which is not closely held) is 5.13 billion Indian Rupees (US$116.22 million) .
Dividend Analysis
During the 12 months ending 9/30/2010, Page Industries Limited. paid dividends totalling 24.00 Indian Rupees per
share. Since the stock is currently trading at 1,392.80 Indian Rupees, this implies a dividend yield of 1.7%. The
company has paid a dividend for 5 straight years. Page Industries Limited. has increased its dividend during each
of the past 3 fiscal years (in 2007, the dividends were 4.37 Indian Rupees per share). During the same 12 month
period ended 9/30/2010, the Company reported earnings of 43.91 Indian Rupees per share. Thus, the company
paid 54.7% of its profits as dividends.
Profitability Analysis
On the 3.39 billion Indian Rupees in sales reported by the company in 2010, the cost of goods sold totalled 2.74
billion Indian Rupees, or 80.6% of sales (i.e., the gross profit was 19.4% of sales). This gross profit margin is
lower than the company achieved in 2009, when cost of goods sold totalled 79.5% of sales. Page Industries
Limited.'s 2010 gross profit margin of 19.4% was better than all three comparable companies (which had gross
profits in 2010 between 7.0% and 9.3% of sales). The company's earnings before interest, taxes, depreciation
and amorization (EBITDA) were 653.20 million Indian Rupees, or 19.2% of sales. This EBITDA to sales ratio is
roughly on par with what the company achieved in 2009, when the EBITDA ratio was 20.2% of sales. The three
comparable companies had EBITDA margins that were all less (between 5.4% and 9.3%) than that achieved by
Page Industries Limited.. In 2010, earnings before extraordinary items at Page Industries Limited. were 396.10
million Indian Rupees, or 11.7% of sales. This profit margin is lower than the level the company achieved in 2009,
when the profit margin was 12.4% of sales. Earnings before extraordinary items have grown for each of the past
5 years (and since 2006, earnings before extraordinary items have grown a total of 248%). The company's return
on equity in 2010 was 45.6%. This was an improvement over the already high 40.9% return the company
achieved in 2009. (Extraordinary items have been excluded).
Profitability Comparison
Gross Earns
Profit EBITDA bef.
Company Year Margin Margin extra
Page Industries Limited. 2010 19.4% 19.2% 11.7%
Page Industries Limited. 2009 20.5% 20.2% 12.4%
5. K-Lifestyle & Industries Limited 2010 N/A 9.3% -0.1%
Pearl Global Limited 2009 7.0% 5.4% 0.2%
Birla Cotsyn India Limited 2010 9.0% 8.2% 2.2%
Inventory Analysis
As of March 2010, the value of the company's inventory totalled 945.50 million Indian Rupees. Since the cost of
goods sold was 2.74 billion Indian Rupees for the year, the company had 126 days of inventory on hand (another
way to look at this is to say that the company turned over its inventory 2.9 times per year). This is an increase
in days in inventory from March 2009, when the company had 679.86 million Indian Rupees, which was only 123
days of sales in inventory. The 126 days in inventory is higher than the three comparable companies, which had
inventories between 24 and 83 days sales at the end of 2010.
Financial Position
As of March 2010, the company's long term debt was 109.09 million Indian Rupees and total liabilities (i.e., all
monies owed) were 1.73 billion Indian Rupees. The long term debt to equity ratio of the company is 0.11. As of
March 2010, the accounts receivable for the company were 263.77 million Indian Rupees, which is equivalent to
28 days of sales. This is an improvement over the end of 2009, when Page Industries Limited. had 35 days of
sales in accounts receivable. The 28 days of accounts receivable at Page Industries Limited. are lower than all
three comparable companies: K-Lifestyle & Industries Limited had 54 days, Pearl Global Limited had 84 days,
while Birla Cotsyn India Limited had 97 days outstanding at the end of the fiscal year 2010.
Financial Positions
LT Debt/ Days Days
Company Year Equity AR Inv.
Page Industries Limited. 2010 0.11 28 126
K-Lifestyle & Industries Limited 2010 0.25 54 47
Pearl Global Limited 2009 0.63 84 83
Birla Cotsyn India Limited 2010 0.55 97 24
Copyright 2001-2010 The Winthrop Corporation
Distributed by Wright Investors' Service, Inc.
All Rights Reserved
Important Legal Notice
THIS REPORT IS PROVIDED FOR GENERAL INFORMATION ONLY, IS NOT TO BE CONSIDERED AS
INVESTMENT ADVICE AND SHOULD NOT BE RELIED UPON FOR INVESTMENT DECISIONS. NO
REPRESENTATION OR WARRANTY IS MADE REGARDING THE ACCURACY, RELIABILITY OR TIMELINESS
OF THE CONTENT. THE REPORTS ARE COMPUTER GENERATED AND MAY BE SUBJECT TO
PROGRAMMATIC AND/OR CONTENT ERRORS. VISITORS SHOULD VERIFY INFORMATION WITH OTHER
RELIABLE SOURCES.
THIS REPORT IS PROVIDED AS IS, WITHOUT WARRANTY OF ANY KIND, EXPRESS OR IMPLIED, INCLUDING
BUT NOT LIMITED TO WARRANTIES OF MERCHANTABILITY, FITNESS FOR A PARTICULAR PURPOSE OR
NON-INFRINGEMENT. IN NO EVENT WILL THE WINTHROP CORPORATION, WRIGHT INVESTORS' SERVICE,
INC. OR ANY OF THEIR DATA PROVIDERS BE LIABLE FOR ANY DIRECT, INDIRECT, SPECIAL OR
CONSEQUENTIAL DAMAGES, NO MATTER WHAT THE CAUSE.
THE CONTENT OF THIS REPORT IS PROTECTED BY APPLICABLE COPYRIGHT LAWS. CONTENT MAY NOT
BE REPRODUCED, DISTRIBUTED, MODIFIED OR FRAMED WITHOUT PRIOR WRITTEN PERMISSION.
16. Financial Statement AnalysesBalance Sheet - Five-Year Averages
Balance Sheet - (5 Year Averages): Page Industries Limited.
Figures in millions of Indian Rupees.
Fiscal Year 2010 2009 2008 2007 2006
Fiscal Year End Date 3/31/2010 3/31/2009 3/31/2008 3/31/2007 3/31/2006
Assets
Total Assets 1,649.7 1,178.2 809.9
Cash & Short Term Investments 87.3 81.5 61.0
Cash 4.3 1.6 0.6
Short Term Investments 83.0 79.8 60.4
Receivables (Net) 160.3 117.5 78.0
Inventories -Total 581.2 432.3 325.4
Raw Materials 221.6
Work in Process 90.7
Finished Goods 245.9
Progress Payments & Other 22.9
Prepaid Expenses 215.4 110.0 41.6
Other Current Assets 40.3 22.3 17.2
Current Assets - Total 1,084.4 763.6 523.2
Long Term Receivables
Investment in Associated
0.0 0.0 0.0
Companies
Other Investments 105.2 99.8 90.0
Property Plant and Equipment -
576.4 390.6 249.2
Gross
Accumulated Depreciation 116.3 75.9 52.4
Property Plant and Equipment –
460.1 314.8 196.8
Net
Other Assets 0.0 0.0 0.0
Deferred Charges 0.0 0.0 0.0
Tangible Other Assets 0.0 0.0 0.0
17. Intangible Other Assets 0.0 0.0 0.0
Total Assets 1,649.7 1,178.2 809.9
Liabilities & Shareholders'
Equity
Total Liabilities & Shareholders'
1,649.7 1,178.2 809.9
Equity
Accounts Payable 142.6 124.6 118.2
Short Term Debt & Current Portion
256.2
of Long Term Debt
Accrued Payroll
Income Taxes Payable
Dividends Payable
Other Current Liabilities 334.1 150.0 90.8
Current Liabilities - Total 856.2 566.3 371.6
Long Term Debt 88.7 93.2 84.3
Long Term Debt Excluding
87.1 91.7 83.1
Capitalized Leases
Capitalized Lease Obligations 1.6
Provision for Risks and Charges
Deferred Income 0.0 0.0 0.0
Deferred Taxes 14.6 13.1 11.8
Deferred Taxes - Credit 21.5 17.3 13.8
Deferred Taxes - Debit
Deferred Tax Liability in Untaxed
Reserves
Other Liabilities 0.0 0.0 0.0
Total Liabilities 962.8 675.9 471.0
Non-Equity Reserves 0.0 0.0 0.0
Minority Interest 0.0 0.0 0.0
Preferred Stock 0.0 0.0 0.0
Preferred Stock Issued for
ESOP
25. Financial Statement AnalysesSources of Capital - Net Change
Sources of Capital: Page Industries Limited.
Currency figures are in millions of Indian Rupees.
Year to year % changes pertain to reported Balance Sheet values.
Fiscal Year 2010 2009 2008 2007 2006
Fiscal Year End Date 3/31/2010 3/31/2009 3/31/2008 3/31/2007 3/31/2006
Total Capital 1,099.4 1,019.2 866.7 751.9 140.8
Percent of Total Capital
Short Term Debt 39.9% 26.3% 32.2% 23.8% 82.6%
Long Term Debt 9.9% 14.8% 10.7% 9.9% 11.1%
Other Liabilities 0.0% 0.0% 0.0% 0.0% 0.0%
Total Liabilities 157.6% 123.1% 111.3% 70.9% 233.3%
Minority Interest 0.0% 0.0% 0.0% 0.0% 0.0%
Preferred Stock 0.0% 0.0% 0.0% 0.0% 0.0%
Retained Earnings
Common Equity 90.1% 85.2% 89.3% 90.1% 88.9%
Total Capital 100.0% 100.0% 100.0% 100.0% 100.0%
Year to Year Net Changes
Short Term Debt 17.0 -1.1 10.0 6.2
Long Term Debt -4.2 5.8 1.8 5.9 -11.6
Other Liabilities 0.0 0.0 0.0 0.0 0.0
Total Liabilities 47.8 29.0 43.1 20.5 3.0
Minority Interest 0.0 0.0 0.0 0.0 0.0
Preferred Stock 0.0 0.0 0.0 0.0 0.0
Retained Earnings
Common Equity 12.2 9.4 9.7 55.2 5.8
Total Capital 8.0 15.2 11.5 61.1 -5.8
Year to Year Percent Changes
Short Term Debt 63.5% -3.9% 56.3% 53.6%
Long Term Debt -27.7% 62.4% 24.5% 377.8% -88.1%
Other Liabilities
31. Financial Ratio AnalysesLeverage Analysis
Leverage Analysis: Page Industries Limited.
Fiscal Year 2010 2009 2008 2007 2006
Fiscal Year End Date 3/31/2010 3/31/2009 3/31/2008 3/31/2007 3/31/2006
Long Term Debt % of EBIT 17.9% 29.9% 25.0% 26.9% 8.4%
Long Term Debt % of EBITDA 15.6% 26.1% 22.8% 25.5% 8.0%
Long Term Debt % of Total Assets 4.0% 7.1% 5.3% 6.2% 3.4%
Long Term Debt % of Total Capital 9.9% 14.8% 10.7% 9.9% 11.1%
Long Term Debt % of Com Equity 11.0% 17.4% 12.0% 11.0% 12.5%
Total Debt % of EBIT 89.7% 83.1% 99.9% 91.2% 70.9%
Total Debt % of EBITDA 78.2% 72.5% 91.1% 86.4% 67.8%
Total Debt % of Total Assets 20.1% 19.7% 21.4% 20.9% 29.1%
Total Debt % of Total Capital 49.8% 41.1% 42.9% 33.7% 93.7%
Total Debt % of Total Capital &
35.6% 32.6% 32.5% 27.2% 51.3%
Short Term Debt
Total Debt % of Common Equity 55.3% 48.3% 48.1% 37.4% 105.4%
Minority Interest % of EBIT 0.0% 0.0% 0.0% 0.0% 0.0%
Minority Interest % of EBITDA 0.0% 0.0% 0.0% 0.0% 0.0%
Minority Interest % of Total Assets 0.0% 0.0% 0.0% 0.0% 0.0%
Minority Interest % of Total Capital 0.0% 0.0% 0.0% 0.0% 0.0%
Minority Interest % of Com Equity 0.0% 0.0% 0.0% 0.0% 0.0%
Preferred Stock % of EBIT 0.0% 0.0% 0.0% 0.0% 0.0%
Preferred Stock % of EDITDA 0.0% 0.0% 0.0% 0.0% 0.0%
Preferred Stock % of Total Assets 0.0% 0.0% 0.0% 0.0% 0.0%
Preferred Stock % of Total Capital 0.0% 0.0% 0.0% 0.0% 0.0%
Preferred Stock % of Total Equity 0.0% 0.0% 0.0% 0.0% 0.0%
Common Equity % of Total Assets 36.4% 40.9% 44.5% 55.9% 27.6%
Common Equity % of Total Capital 90.1% 85.2% 89.3% 90.1% 88.9%
Total Capital % of Total Assets 40.4% 48.0% 49.9% 62.1% 31.0%
Capital Expenditure % of Sales 7.3% 12.0% 12.0% 10.3% 3.3%
33. Financial Ratio AnalysesLiquidity Analysis
Liquidity Analysis: Page Industries Limited.
Fiscal Year 2010 2009 2008 2007 2006
Fiscal Year End Date 3/31/2010 3/31/2009 3/31/2008 3/31/2007 3/31/2006
Total Current Assets % Net Sales 55.1% 55.1% 52.1% 60.7% 32.1%
Cash % of Current Assets 0.7% 0.4% 0.1% 0.1% 0.1%
Cash & Equivalents % of Current
1.6% 7.3% 0.2% 36.6% 0.1%
Assets
Quick Ratio 0.2 0.3 0.2 0.9 0.2
Receivables % of Current Assets 14.1% 17.4% 14.2% 10.2% 20.6%
Receivable Turnover - number of
27.3 27.7 21.5 20.3 21.1
days
Inventories % of Current Assets 50.6% 48.5% 62.9% 49.3% 75.0%
Inventory Turnover - number of
108.4 118.2 121.9 109.2 98.9
days
Inventory to Cash & Equivalents -
11.2 54.5 1.0 267.0 0.4
number of days
Receivables % of Total Assets 9.7% 11.5% 8.2% 7.0% 14.7%
Current Ratio 1.2 1.3 1.2 1.8 1.1
Total Debt % of Total Capital 35.6% 32.6% 32.5% 27.2% 51.3%
Funds from Operations % of
30.4% 35.9% 33.5% 42.4% 41.1%
Current Liabilities
Funds from Operations % of Long
447.4% 258.4% 303.9% 255.5% 779.3%
Term Debt
Funds from Operations % of Total
89.1% 93.1% 75.9% 75.3% 92.3%
Debt
Funds from Operations % of Total
44.4% 38.3% 32.6% 25.4% 86.5%
Capital
Cash Flow (in milllions of Indian
Rupees)
Operating Activities 283.0 333.5 109.7 78.1 92.0
Financing Activities -135.2 -174.7 -22.9 493.8 -55.2
Investing Activities 221.3 57.6 387.0 270.3 36.9