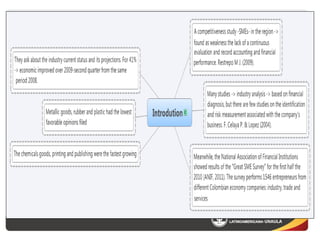
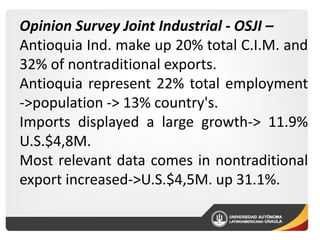
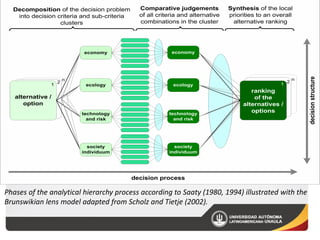
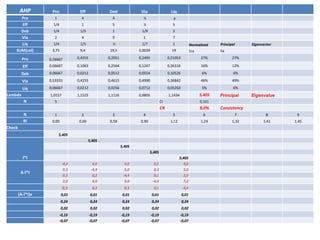
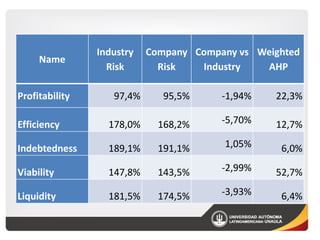
Operational Risk Analysis of
Industrial Small and Mediun
Enterprises - SMEs

Jorge A. Restrepo, M.Sc. Ph. D (c).
Jairo Ángel Díaz. M.Sc. (c).
Beatriz Mora M.Sc. (c).
Opinion Survey Joint Industrial - OSJI –
Antioquia Ind. make up 20% total C.I.M. and
32% of nontraditional exports.
Antioquia represent 22% total employment
->population -> 13% country's.
Imports displayed a large growth-> 11.9%
U.S.$4,8M.
Most relevant data comes in nontraditional
export increased->U.S.$4,5M. up 31.1%.
Risk Management

Different authors M. Castillo (2008), Jorion (2000), JP Morgan. (2011), Medina (2006), Sturm
P. (2013) presents the following classification:

Operative Risk
Financial Risk
Reputational Risk
Risk High Severity
Phases of the analytical hierarchy process according to Saaty (1980, 1994) illustrated with the
Brunswikian lens model adapted from Scholz and Tietje (2002).
Paired comparisons using AHP Technique
A
1
2
3
4
5
7
1
2
3
4

Profitability - Pro

B
Eff
Deb
Via
Liq

More
Important
A
A
B
A

Intensify
4
4
2
4

1 = Indifferent
Deb
Via
Liq

A
B
A

5
4
5

Via
Liq

B
A

9
2

Liq

A

7

Efficiency - Eff

5
6
1
2
3
4
5
1
2
3
4

Indebtedness Deb

Viability - Via

5 = Strong
degree of
preference
9 = Extremely
preferred

3 = moderately
Preferred
7 = Very strong
preference
AHP

Pro

Eff

Ded

Via

Liq

Pro
Eff
Deb
Via
Liq
SUM(col)

1

4

4

½

1/4

1

5

¼

4
5

1/4

1/5

1

1/9

2

2

4

9

1

7

1/4

1/5

½

1/7

1

Normalized

Principal

3,75

9,4

19,5

2,0039

19

1ra

5a

Pro

0,26667

0,4255

0,2051

0,2495

0,21053

27%

27%

Eff

0,06667

0,1063

0,2564

0,1247

0,26316

16%

12%

Deb

0,06667

0,0212

0,0512

0,0554

0,10526

6%

6%

Via

0,53333

0,4255

0,4615

0,4990

0,36842

46%

49%

Liq

0,06667

0,0212

0,0256

0,0712

0,05263

5%

6%

1,0157

1,1525

1,1126

0,9805

1,1434

5,405

Lambda
N

CI

9,0%

Consistency

1

2

3

4

5

6

7

8

9

0,00

0,58

0,90

1,12

1,24

1,32

1,41

1,45

5,405
5,405
5,405
5,405

l*I
-4,4
0,3
0,3
2,0

4,0
-4,4
0,2
4,0

4,0
5,0
-4,4
9,0

0,5
0,3
0,1
-4,4

5,405
4,0
5,0
2,0
7,0

0,3

(A-l*I)x

Eigenvalue

0,00

Check

A-l*I

Principal

0,101

CR
N
RI

5

Eigenvector

0,2

0,5

0,1

-4,4

0,01

0,01

0,01

0,01

0,01

0,24

0,24

0,24

0,24

0,24

0,02

0,02

0,02

0,02

0,02

-0,19
-0,07

-0,19
-0,07

-0,19
-0,07

-0,19
-0,07

-0,19
-0,07
Indices
PROFITABILITY
Gross Margin (%)
Operating margin (%)
Net margin (%)
Return / Equity (ROI) (%)
EFFICIENCY
Asset Turnover (times)
Portfolio turnover (days)
Rotation suppliers (days)
Inventory turnover (days)
Operating cycle (days)
DEBT
Debt to equity ratio (%)
Financial obligations / liabilities (%)
Total Liabilities / Sales (%)
Current Liabilities / Total Liabilities (%)
VIABILITY
Ebitda (MLL)
EBITDA / Sales (%)
Sales / Financial duties (sometimes)
LIQUIDITY
Current ratio (times)
Acid test (times)
Working capital (MLL)

𝒎
𝒏
𝑹𝒐 = 𝒋=𝟏 𝒊=𝟏 𝑾𝒋 𝑿𝒊 Equation
1.
Where:
J = 1-5 represents the major
indices: profitability, leverage,
efficiency, viability and liquidity
I = 1 to 19, represents the two level
indices summarized in Table

Profitability

22,3%

Efficiency

12,7%

Indebtedness

6,0%

Viability

52,7%

Liquidity

6,4%
Gross Margin (%)

Gross Margin (%)
Gross Margin (%)Forecast (double exponential smoothing)

Gross Margin (%)Forecast (exponential smoothing)
10%

10%

5%

5%

0%

0%
1

2

3

4

5

6

7

8

1

2

3

4

5

6

7

8

9

8

9

-5%

-5%
-10%
-10%
Operating margin (%)

Operating margin (%)

Operating margin (%)Forecast (exponential smoothing)
40,00%

40,00%

20,00%

20,00%

0,00%
-20,00%

0,00%

1

2

3

4

5

6

7

8

9

-40,00%

-20,00%

1

2

4

5

6

7

-40,00%
Net margin (%)

Net margin (%)

Net margin (%) Forecast (exponential smoothing)

Net margin (%) Forecast (double exponential smoothing)

60,00%

50,00%

40,00%
20,00%

0,00%

0,00%
-20,00%

3

1

2

3

4

5

6

7

8

1

9

2

3

4

5

6

7

8

9

-50,00%

-40,00%

Return / Equity (ROI) (%)

Return / Equity (ROI) (%)

Return / Equity (ROI) (%) Forecast (double exponential smoothing)

Return / Equity (ROI) (%) Forecast (exponential smoothing)
60,00%

100,00%

40,00%
50,00%

20,00%
0,00%

0,00%
1
-50,00%

2

3

4

5

6

7

8

9

-20,00%
-40,00%

1

2

3

4

5

6

7

8

9
Periods

PROFITABILITY
Gross Margin (%)
Gross Margin (%)Forecast (exponential
smoothing)
e^2
Gross Margin (%)Forecast (double exponential
smoothing)
Lt (Estimating orderly)
Estimating the slope
e^2
Operating margin (%)
Operating margin (%)Forecast (exponential
smoothing)
e^2
Operating margin (%)Forecast (double
exponential smoothing)
Lt (Estimating orderly)
Estimating the slope
e^2
Net margin (%)
Net margin (%) Forecast (exponential smoothing)
e^2
Net margin (%) Forecast (double exponential
smoothing)
Lt (Estimating orderly)
Estimating the slope
e^2
Return / Equity (ROI) (%)
Return / Equity (ROI) (%) Forecast (exponential
smoothing)
e^2
Return / Equity (ROI) (%) Forecast (double
exponential smoothing)
Lt (Estimating orderly)
Estimating the slope
e^2

2000-2001 2001-2002 2002-2003 2003-2004 2004-2005 2005-2006 2006-2007 2007-2008 2008-2009
Indices Percentage Growth Period 2000-2009
-1,62%

-0,03%

-7,42%

5,75%

2,75%

-2,70%

1,42%

-7,96%

-4,84%

-1,62%
0,03%

-1,38%
0,37%

-2,31%
0,65%

-1,07%
0,15%

-0,48%
0,05%

-0,82%
0,05%

-0,47%
0,56%

-1,63%
0,10%

-1,97%
-1,97%
0,00%
0,04%
23,07%

-0,45%
-0,45%
0,00%
0,49%
-25,88%

-7,52%
-7,52%
0,00%
1,76%
21,10%

4,13%
4,13%
0,00%
0,02%
8,47%

3,64%
3,64%
0,00%
0,40%
5,33%

-1,92%
-1,92%
0,00%
0,11%
1,08%

1,01%
1,01%
0,00%
0,80%
7,49%

-7,74%
-7,74%
0,00%
0,08%
-22,56%

-12,15%
12,41%

-12,15%
1,89%

-12,15%
11,05%

-12,15%
4,25%

-12,15%
3,05%

-12,15%
1,75%

-12,15%
3,86%

-12,15%
1,08%

-12,15%
-12,15%
0,00%
0,00%
46,29%

-12,15%
-12,15%
0,00%
12,41%
8,14%
46,29%
14,55%

23,07%
23,07%
0,00%
23,96%
-22,26%
33,61%
31,22%

-25,88%
-25,88%
0,00%
22,07%
31,12%
15,04%
2,59%

21,10%
21,10%
0,00%
1,59%
9,68%
20,38%
1,14%

8,47%
8,47%
0,00%
0,10%
18,94%
16,83%
0,04%

5,33%
5,33%
0,00%
0,18%
1,54%
17,53%
2,56%

1,08%
1,08%
0,00%
0,41%
0,69%
12,22%
1,33%

7,49%
7,49%
0,00%
9,03%
-23,43%
8,39%
10,12%

46,29%
46,29%
0,00%
0,00%
49,35%

46,29%
46,29%
0,00%
14,55%
1,93%

8,14%
8,14%
0,00%
9,24%
-22,16%

-22,26%
-22,26%
0,00%
28,50%
31,42%

31,12%
31,12%
0,00%
4,59%
9,37%

9,68%
9,68%
0,00%
0,86%
21,80%

18,94%
18,94%
0,00%
3,03%
1,90%

1,54%
1,54%
0,00%
0,01%
7,11%

0,69%
0,69%
0,00%
5,82%
-31,51%

49,35%
22,48%

34,50%
32,11%

16,76%
2,15%

21,35%
1,44%

17,60%
0,18%

18,91%
2,89%

13,59%
0,42%

11,56%
18,55%

49,35%
49,35%
0,00%
22,48%

1,93%
1,93%
0,00%
5,81%

-22,16%
-22,16%
0,00%
28,72%

31,42%
31,42%
0,00%
4,86%

9,37%
9,37%
0,00%
1,54%

21,80%
21,80%
0,00%
3,96%

1,90%
1,90%
0,00%
0,27%

7,11%
7,11%
0,00%
14,92%

-1,62%
-1,62%
0,00%
0,00%
-12,15%

49,35%
49,35%
0,00%
0,00%
Major Indices Level 1

Secondary Indices Level 2
Historic Value Risk
without Weighted

Name

Industry Company Company vs Weight
Risk
Risk
Industry
AHP

Historic Value Risk
Weighted

Name Ratio
Weight AHP Industry Company

Industry

Company

Value Risk

Company vs
Industry

Gross Margin (%)

222,6%

215,0%

19,3%

18,7%

-3,5%

Operating margin (%)

9,5%
9,4%

170,8%
222,4%

165,0%
225,0%

16,1%
21,0%

15,6%
21,2%

-3,4%
1,2%

Return / Equity (ROI) (%)

19,9%

205,6%

201,0%

40,9%

40,0%

-2,3%

52,5%

194,1%

190,0%

101,9%

99,8%

-2,1%

Asset Turnover (times)

30,7%

0,0%

1,0%

0,0%

0,3%

460,5%

Portfolio turnover (days)

95,5%

8,7%

Return of Assets

97,4%

-1,9%
Major
Industry

13,2%

172,6%

155,0%

22,8%

20,5%

-10,7%

12,7% Rotation suppliers (days)

22,3% Net margin (%)

Profitability
-5,7%
178,0%

168,2%

Minor

Efficiency

Major
189,1%

6,0%

191,1%
Industry

Indebtedness

147,8%

143,5%

-3,0%
Minor

52,7%

Industry

Viability

-3,9%
181,5%
Liquidity
Operative Risk

174,5%

Minor
Industry

145,0%

140,8%

-3,0%

6,4%

350,0%

56,4%

53,7%

-4,9%

262,8%

250,0%

24,0%

22,8%

-5,0%

Operating cycle (days)
Debt to equity ratio (%)
Financial obligations /
liabilities (%)
Total Liabilities / Sales (%)
Current Liabilities / Total
Liabilities (%)
Ebitda (MLL)

31,6%
64,5%

236,5%
183,9%

224,0%
186,0%

74,8%
118,6%

70,8%
119,9%

-5,4%
1,2%

8,2%
13,2%

253,3%
177,3%

245,0%
187,0%

20,9%
23,3%

20,2%
24,6%

-3,3%
5,3%

14,1%
78,2%

186,8%
137,4%

187,0%
145,0%

26,4%
107,4%

26,4%
113,4%

0,1%
5,4%

EBITDA / Sales (%)
Sales / Financial
obligations (times)

12,6%

140,8%

138,0%

17,8%

17,4%

-2,0%

9,2%

246,3%

138,0%

22,7%

12,7%

-57,9%

12,7%

168,0%

152,0%

21,3%

19,3%

-10,0%

Acid test (times)

70,5%

208,3%

204,0%

146,8%

143,8%

-2,1%

Working capital (MLL)

1,0%

367,7%

9,1%

Current ratio (times)

Industry

15,3%

Inventory turnover (days)

16,8%

79,6%

68,0%

13,4%

11,4%

-15,8%

100,0% Kind of Risk= minor Industry
Name
Profitability

Industry
Risk

Company Company vs Weighted
Risk
Industry
AHP

97,4%

95,5%

-1,94%

22,3%

Efficiency

178,0%

168,2%

-5,70%

12,7%

Indebtedness

189,1%

191,1%

1,05%

6,0%

Viability

147,8%

143,5%

-2,99%

52,7%

Liquidity

181,5%

174,5%

-3,93%

6,4%
Industry

Company

Gross Margin (%)
Working capital (MLL)400,0%
Operating margin (%)
350,0%
Acid test (times)
Net margin (%)
300,0%
Current ratio (times)

250,0%

Return / Equity (ROI) (%)

200,0%
Sales / Financial obligations
(times)

150,0%
100,0%

Return of Assets

50,0%
EBITDA / Sales (%)

Ebitda (MLL)
Current Liabilities / Total
Liabilities (%)

0,0%

Asset Turnover (times)

Portfolio turnover (days)

Rotation suppliers (days)

Total Liabilities / Sales (%)
Inventory turnover (days)
Financial obligations /
Operating cycle (days)
liabilities (%)
Debt to equity ratio (%)
Thanks

Operative Risk Analysis of Industrial Small and medium Enterprises

  • 1.
    Operational Risk Analysisof Industrial Small and Mediun Enterprises - SMEs Jorge A. Restrepo, M.Sc. Ph. D (c). Jairo Ángel Díaz. M.Sc. (c). Beatriz Mora M.Sc. (c).
  • 4.
    Opinion Survey JointIndustrial - OSJI – Antioquia Ind. make up 20% total C.I.M. and 32% of nontraditional exports. Antioquia represent 22% total employment ->population -> 13% country's. Imports displayed a large growth-> 11.9% U.S.$4,8M. Most relevant data comes in nontraditional export increased->U.S.$4,5M. up 31.1%.
  • 5.
    Risk Management Different authorsM. Castillo (2008), Jorion (2000), JP Morgan. (2011), Medina (2006), Sturm P. (2013) presents the following classification: Operative Risk Financial Risk Reputational Risk Risk High Severity
  • 9.
    Phases of theanalytical hierarchy process according to Saaty (1980, 1994) illustrated with the Brunswikian lens model adapted from Scholz and Tietje (2002).
  • 10.
    Paired comparisons usingAHP Technique A 1 2 3 4 5 7 1 2 3 4 Profitability - Pro B Eff Deb Via Liq More Important A A B A Intensify 4 4 2 4 1 = Indifferent Deb Via Liq A B A 5 4 5 Via Liq B A 9 2 Liq A 7 Efficiency - Eff 5 6 1 2 3 4 5 1 2 3 4 Indebtedness Deb Viability - Via 5 = Strong degree of preference 9 = Extremely preferred 3 = moderately Preferred 7 = Very strong preference
  • 12.
    AHP Pro Eff Ded Via Liq Pro Eff Deb Via Liq SUM(col) 1 4 4 ½ 1/4 1 5 ¼ 4 5 1/4 1/5 1 1/9 2 2 4 9 1 7 1/4 1/5 ½ 1/7 1 Normalized Principal 3,75 9,4 19,5 2,0039 19 1ra 5a Pro 0,26667 0,4255 0,2051 0,2495 0,21053 27% 27% Eff 0,06667 0,1063 0,2564 0,1247 0,26316 16% 12% Deb 0,06667 0,0212 0,0512 0,0554 0,10526 6% 6% Via 0,53333 0,4255 0,4615 0,4990 0,36842 46% 49% Liq 0,06667 0,0212 0,0256 0,0712 0,05263 5% 6% 1,0157 1,1525 1,1126 0,9805 1,1434 5,405 Lambda N CI 9,0% Consistency 1 2 3 4 5 6 7 8 9 0,00 0,58 0,90 1,12 1,24 1,32 1,41 1,45 5,405 5,405 5,405 5,405 l*I -4,4 0,3 0,3 2,0 4,0 -4,4 0,2 4,0 4,0 5,0 -4,4 9,0 0,5 0,3 0,1 -4,4 5,405 4,0 5,0 2,0 7,0 0,3 (A-l*I)x Eigenvalue 0,00 Check A-l*I Principal 0,101 CR N RI 5 Eigenvector 0,2 0,5 0,1 -4,4 0,01 0,01 0,01 0,01 0,01 0,24 0,24 0,24 0,24 0,24 0,02 0,02 0,02 0,02 0,02 -0,19 -0,07 -0,19 -0,07 -0,19 -0,07 -0,19 -0,07 -0,19 -0,07
  • 13.
    Indices PROFITABILITY Gross Margin (%) Operatingmargin (%) Net margin (%) Return / Equity (ROI) (%) EFFICIENCY Asset Turnover (times) Portfolio turnover (days) Rotation suppliers (days) Inventory turnover (days) Operating cycle (days) DEBT Debt to equity ratio (%) Financial obligations / liabilities (%) Total Liabilities / Sales (%) Current Liabilities / Total Liabilities (%) VIABILITY Ebitda (MLL) EBITDA / Sales (%) Sales / Financial duties (sometimes) LIQUIDITY Current ratio (times) Acid test (times) Working capital (MLL) 𝒎 𝒏 𝑹𝒐 = 𝒋=𝟏 𝒊=𝟏 𝑾𝒋 𝑿𝒊 Equation 1. Where: J = 1-5 represents the major indices: profitability, leverage, efficiency, viability and liquidity I = 1 to 19, represents the two level indices summarized in Table Profitability 22,3% Efficiency 12,7% Indebtedness 6,0% Viability 52,7% Liquidity 6,4%
  • 15.
    Gross Margin (%) GrossMargin (%) Gross Margin (%)Forecast (double exponential smoothing) Gross Margin (%)Forecast (exponential smoothing) 10% 10% 5% 5% 0% 0% 1 2 3 4 5 6 7 8 1 2 3 4 5 6 7 8 9 8 9 -5% -5% -10% -10% Operating margin (%) Operating margin (%) Operating margin (%)Forecast (exponential smoothing) 40,00% 40,00% 20,00% 20,00% 0,00% -20,00% 0,00% 1 2 3 4 5 6 7 8 9 -40,00% -20,00% 1 2 4 5 6 7 -40,00% Net margin (%) Net margin (%) Net margin (%) Forecast (exponential smoothing) Net margin (%) Forecast (double exponential smoothing) 60,00% 50,00% 40,00% 20,00% 0,00% 0,00% -20,00% 3 1 2 3 4 5 6 7 8 1 9 2 3 4 5 6 7 8 9 -50,00% -40,00% Return / Equity (ROI) (%) Return / Equity (ROI) (%) Return / Equity (ROI) (%) Forecast (double exponential smoothing) Return / Equity (ROI) (%) Forecast (exponential smoothing) 60,00% 100,00% 40,00% 50,00% 20,00% 0,00% 0,00% 1 -50,00% 2 3 4 5 6 7 8 9 -20,00% -40,00% 1 2 3 4 5 6 7 8 9
  • 16.
    Periods PROFITABILITY Gross Margin (%) GrossMargin (%)Forecast (exponential smoothing) e^2 Gross Margin (%)Forecast (double exponential smoothing) Lt (Estimating orderly) Estimating the slope e^2 Operating margin (%) Operating margin (%)Forecast (exponential smoothing) e^2 Operating margin (%)Forecast (double exponential smoothing) Lt (Estimating orderly) Estimating the slope e^2 Net margin (%) Net margin (%) Forecast (exponential smoothing) e^2 Net margin (%) Forecast (double exponential smoothing) Lt (Estimating orderly) Estimating the slope e^2 Return / Equity (ROI) (%) Return / Equity (ROI) (%) Forecast (exponential smoothing) e^2 Return / Equity (ROI) (%) Forecast (double exponential smoothing) Lt (Estimating orderly) Estimating the slope e^2 2000-2001 2001-2002 2002-2003 2003-2004 2004-2005 2005-2006 2006-2007 2007-2008 2008-2009 Indices Percentage Growth Period 2000-2009 -1,62% -0,03% -7,42% 5,75% 2,75% -2,70% 1,42% -7,96% -4,84% -1,62% 0,03% -1,38% 0,37% -2,31% 0,65% -1,07% 0,15% -0,48% 0,05% -0,82% 0,05% -0,47% 0,56% -1,63% 0,10% -1,97% -1,97% 0,00% 0,04% 23,07% -0,45% -0,45% 0,00% 0,49% -25,88% -7,52% -7,52% 0,00% 1,76% 21,10% 4,13% 4,13% 0,00% 0,02% 8,47% 3,64% 3,64% 0,00% 0,40% 5,33% -1,92% -1,92% 0,00% 0,11% 1,08% 1,01% 1,01% 0,00% 0,80% 7,49% -7,74% -7,74% 0,00% 0,08% -22,56% -12,15% 12,41% -12,15% 1,89% -12,15% 11,05% -12,15% 4,25% -12,15% 3,05% -12,15% 1,75% -12,15% 3,86% -12,15% 1,08% -12,15% -12,15% 0,00% 0,00% 46,29% -12,15% -12,15% 0,00% 12,41% 8,14% 46,29% 14,55% 23,07% 23,07% 0,00% 23,96% -22,26% 33,61% 31,22% -25,88% -25,88% 0,00% 22,07% 31,12% 15,04% 2,59% 21,10% 21,10% 0,00% 1,59% 9,68% 20,38% 1,14% 8,47% 8,47% 0,00% 0,10% 18,94% 16,83% 0,04% 5,33% 5,33% 0,00% 0,18% 1,54% 17,53% 2,56% 1,08% 1,08% 0,00% 0,41% 0,69% 12,22% 1,33% 7,49% 7,49% 0,00% 9,03% -23,43% 8,39% 10,12% 46,29% 46,29% 0,00% 0,00% 49,35% 46,29% 46,29% 0,00% 14,55% 1,93% 8,14% 8,14% 0,00% 9,24% -22,16% -22,26% -22,26% 0,00% 28,50% 31,42% 31,12% 31,12% 0,00% 4,59% 9,37% 9,68% 9,68% 0,00% 0,86% 21,80% 18,94% 18,94% 0,00% 3,03% 1,90% 1,54% 1,54% 0,00% 0,01% 7,11% 0,69% 0,69% 0,00% 5,82% -31,51% 49,35% 22,48% 34,50% 32,11% 16,76% 2,15% 21,35% 1,44% 17,60% 0,18% 18,91% 2,89% 13,59% 0,42% 11,56% 18,55% 49,35% 49,35% 0,00% 22,48% 1,93% 1,93% 0,00% 5,81% -22,16% -22,16% 0,00% 28,72% 31,42% 31,42% 0,00% 4,86% 9,37% 9,37% 0,00% 1,54% 21,80% 21,80% 0,00% 3,96% 1,90% 1,90% 0,00% 0,27% 7,11% 7,11% 0,00% 14,92% -1,62% -1,62% 0,00% 0,00% -12,15% 49,35% 49,35% 0,00% 0,00%
  • 17.
    Major Indices Level1 Secondary Indices Level 2 Historic Value Risk without Weighted Name Industry Company Company vs Weight Risk Risk Industry AHP Historic Value Risk Weighted Name Ratio Weight AHP Industry Company Industry Company Value Risk Company vs Industry Gross Margin (%) 222,6% 215,0% 19,3% 18,7% -3,5% Operating margin (%) 9,5% 9,4% 170,8% 222,4% 165,0% 225,0% 16,1% 21,0% 15,6% 21,2% -3,4% 1,2% Return / Equity (ROI) (%) 19,9% 205,6% 201,0% 40,9% 40,0% -2,3% 52,5% 194,1% 190,0% 101,9% 99,8% -2,1% Asset Turnover (times) 30,7% 0,0% 1,0% 0,0% 0,3% 460,5% Portfolio turnover (days) 95,5% 8,7% Return of Assets 97,4% -1,9% Major Industry 13,2% 172,6% 155,0% 22,8% 20,5% -10,7% 12,7% Rotation suppliers (days) 22,3% Net margin (%) Profitability -5,7% 178,0% 168,2% Minor Efficiency Major 189,1% 6,0% 191,1% Industry Indebtedness 147,8% 143,5% -3,0% Minor 52,7% Industry Viability -3,9% 181,5% Liquidity Operative Risk 174,5% Minor Industry 145,0% 140,8% -3,0% 6,4% 350,0% 56,4% 53,7% -4,9% 262,8% 250,0% 24,0% 22,8% -5,0% Operating cycle (days) Debt to equity ratio (%) Financial obligations / liabilities (%) Total Liabilities / Sales (%) Current Liabilities / Total Liabilities (%) Ebitda (MLL) 31,6% 64,5% 236,5% 183,9% 224,0% 186,0% 74,8% 118,6% 70,8% 119,9% -5,4% 1,2% 8,2% 13,2% 253,3% 177,3% 245,0% 187,0% 20,9% 23,3% 20,2% 24,6% -3,3% 5,3% 14,1% 78,2% 186,8% 137,4% 187,0% 145,0% 26,4% 107,4% 26,4% 113,4% 0,1% 5,4% EBITDA / Sales (%) Sales / Financial obligations (times) 12,6% 140,8% 138,0% 17,8% 17,4% -2,0% 9,2% 246,3% 138,0% 22,7% 12,7% -57,9% 12,7% 168,0% 152,0% 21,3% 19,3% -10,0% Acid test (times) 70,5% 208,3% 204,0% 146,8% 143,8% -2,1% Working capital (MLL) 1,0% 367,7% 9,1% Current ratio (times) Industry 15,3% Inventory turnover (days) 16,8% 79,6% 68,0% 13,4% 11,4% -15,8% 100,0% Kind of Risk= minor Industry
  • 18.
    Name Profitability Industry Risk Company Company vsWeighted Risk Industry AHP 97,4% 95,5% -1,94% 22,3% Efficiency 178,0% 168,2% -5,70% 12,7% Indebtedness 189,1% 191,1% 1,05% 6,0% Viability 147,8% 143,5% -2,99% 52,7% Liquidity 181,5% 174,5% -3,93% 6,4%
  • 19.
    Industry Company Gross Margin (%) Workingcapital (MLL)400,0% Operating margin (%) 350,0% Acid test (times) Net margin (%) 300,0% Current ratio (times) 250,0% Return / Equity (ROI) (%) 200,0% Sales / Financial obligations (times) 150,0% 100,0% Return of Assets 50,0% EBITDA / Sales (%) Ebitda (MLL) Current Liabilities / Total Liabilities (%) 0,0% Asset Turnover (times) Portfolio turnover (days) Rotation suppliers (days) Total Liabilities / Sales (%) Inventory turnover (days) Financial obligations / Operating cycle (days) liabilities (%) Debt to equity ratio (%)
  • 20.