
Recommended
More Related Content
What's hot
What's hot (20)
Viewers also liked
Viewers also liked (20)
Similar to outreach presentation on pedestrian access
Similar to outreach presentation on pedestrian access (20)
Recently uploaded
Recently uploaded (20)
outreach presentation on pedestrian access
- 2. Who is a pedestrian? A person who walks!! Who is not a pedestrian?? A person who does not walk!! Every one of us is a pedestrian
- 3. What is on the road… Share of vehicles by type Buses <1% 2 Wheelers 75% Cars 19% Others 5%
- 4. Who are on the road Walk 30% Bus 29% 2 Wheelers 18% Cars 2% Cycles 13% Others 8% Share of various modes of travel
- 5. While pedestrians who are 30% occupy less than 3% of road space, Car users who account for a mere 2% occupy 19% of the road
- 6. Growing numbers….. 0 20 40 60 80 100 120 140 160 180 1971 1981 1991 2001 2005 Population Daily trips Vehicles ('10000)
- 7. Skewed growth Growth in the last two decades Data sourced from Chennai Draft master plan for 1984-2004 450 vehicles are added to the roads every day in Chennai Negligible Road space 14 times Two wheelers 1.5 times (approx) Bus 10 times Cars 1.5 times Population
- 8. Growth…. at whose cost?? 3000 MTC buses Carrying 38 lakh people Every day 1250 people per bus per day
- 9. Growth…. at whose cost Concrete medians restrict access Roads do not have foot path Foot over bridges replace pedestrian crossings
- 10. Growth…. at whose cost Cyclist who accounted for 22% in 1970s are down to 13% and decreasing The lack of bicycle lanes and increasing vehicles has made the city dangerous for cyclist
- 11. Growth…. at whose cost Their livelihoods are being destroyed The street vendors provide a cheap and easy service to people
- 12. Traffic Jams are inevitable
- 13. The Governments answer…… One way roads
- 14. The Government’s answer FLYOVERS
- 15. The Government’s answer Road widening
- 17. Wedging through the barricade Percentage of accident victims
- 18. Weaving through the traffic Percentage of accident victims
- 19. Dangling for dear life Percentage of accident victims
- 20. Some major pollutants from motorized vehicles & related health hazards Sick of the pollution? Causes increased sensitivity to infections, lung diseases, and asthma Motor vehicle emissions Ozone Affects respiratory system, Irritates respiratory tract Fuel combustion in motor vehicles Nitrogen Oxides Small particles are poisonous with carcinogenic element Smoke from vehicles Suspended particulate matter Fatal in large doses. Aggravates heart disorders. Effects nervous system. Incomplete fuel combustion (e.g. two-stroke engine) Carbon Monoxide Effect on human health Source Pollutant
- 21. The major contributor of air pollution is the vehicular sector (72%) Sustainability is going up like smoke!
- 23. We are not going anywhere The average speed during peak hours is less than 10kmph Another 2 lakh vehicles would be added to the road this year Approximately 8000 people will lose their lives on the road this year
- 24. Do we have to live with this?
- 25. Not at all!!! Promote Public transport Promote pedestrians and respect their right of way Protect and preserve pedestrian and cyclist space on the road
- 26. From our audit walks……
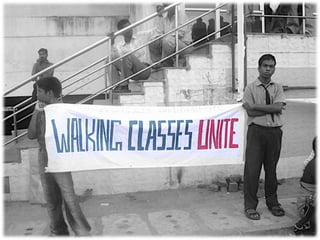
- 27. Walking Classes Unite Broken, ill maintained foot paths
- 28. Misuse and Abuse of pavements by government agencies and private shop owners
- 29. Non Functioning Traffic lights
- 30. The motorized vehicle users do not respect the space of the pedestrian.
- 31. Let us Reclaim our CITY for the common people
- 33. Activities we are involved in… Audit walks Outreach Media coverage Meeting officials Walkathon An aim: put pedestrian issues on the agenda
- 35. Contact us Visit us online at pedaccess.wordpress.com Mail pedaccess@googlegroups.com
- 36. Our numbers Venkat (9884706531) Jade (9940369194) Anusha (9884163604)