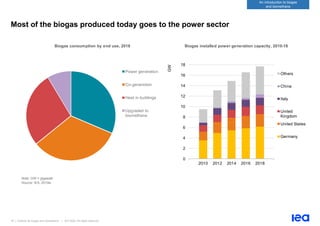
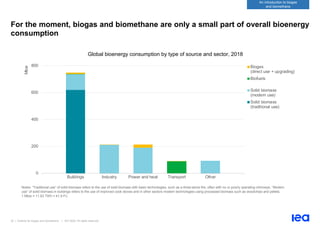
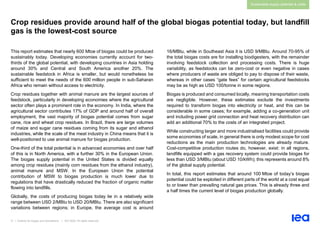
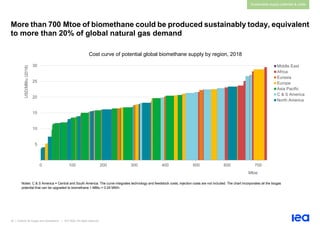
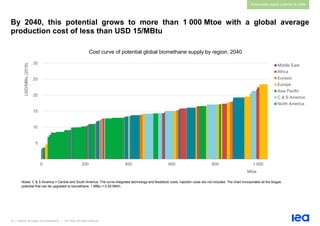
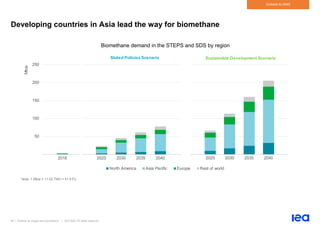
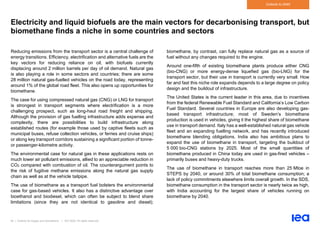
1. The report analyzes the potential for biogas and biomethane production globally by assessing available organic waste feedstocks. It finds that while production today is only a fraction of potential, full utilization could meet 20% of current global gas demand by converting underused resources into clean energy.
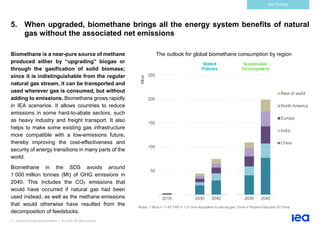
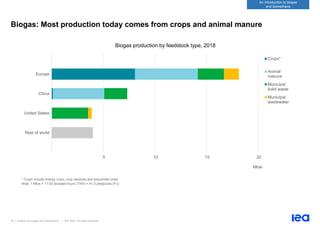
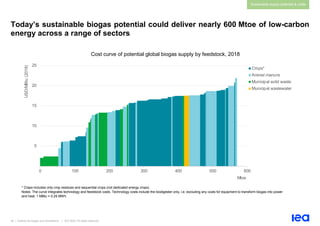
2. A detailed study estimates the worldwide technical potential for sustainable biogas and biomethane feedstocks is huge at 570 million tonnes of oil equivalent for biogas and 730 million tonnes for biomethane, but only 35 million tonnes were produced in 2018.
3. Significant potential exists to produce biogas and/or biomethane in all world regions due to availability of feedstocks, with potential growing

![3 | Outlook for biogas and biomethane | IEA 2020. All rights reserved
Introduction
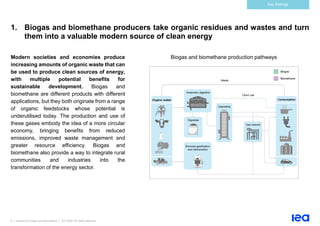
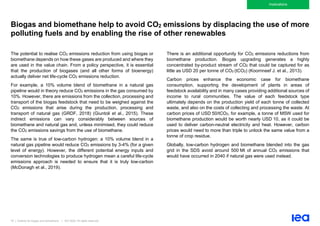
The case for biogas and biomethane lies at the intersection of two
critical challenges of modern life: dealing with the increasing amount of
organic waste that is produced by modern societies and economies,
and the imperative to reduce global greenhouse gas (GHG) emissions.
By turning organic waste into a renewable energy resource, the
production of biogas or biomethane offers a window onto a world in
which resources are continuously used and reused, and one in which
rising demand for energy services can be met while also delivering
wider environmental benefits.
In assessing the prospects for “organic growth” of biogas and
biomethane, this new report from the International Energy Agency (IEA)
explores how big a role these gases can play in the transformation of
the global energy system, where the opportunities and potential pitfalls
lie, and what policy makers and industry can do to support sustainable
growth in this sector.
The answers to these questions rest on a major new IEA analysis of the
sustainable potential for biogas and biomethane supply, including a
detailed assessment of feedstock availability and production costs
across all regions of the world.
This provides a platform to explore the various services that biogas and
biomethane can provide in different countries, which vary widely
depending on circumstances and policy priorities. Biogas can be a
valuable local source of power and heat, as well as a clean cooking fuel
to displace reliance on the traditional use of solid biomass in many
developing countries. There are also potential co-benefits in terms of
agricultural productivity (as a result of using the residual “digestate”
from biodigesters as a fertiliser) and reducing deforestation.
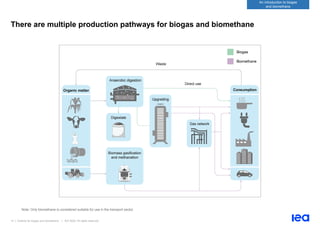
When upgraded, biomethane (also known as renewable natural gas) is
indistinguishable from natural gas and so can be transported and used
in the same way. Biomethane can deliver the energy system benefits of
natural gas while being carbon-neutral.
The value of biogas and biomethane is heightened in scenarios such
as the IEA Sustainable Development Scenario (SDS), which meet in full
the world’s goals to tackle climate change, improve air quality and
provide access to modern energy. Projections from the SDS provide an
essential benchmark for much of the discussion in this report.
Biogas and biomethane have the potential to support all aspects of the
SDS, which charts a path fully consistent with the Paris Agreement by
holding the rise in global temperatures to “well below 2°C … and
pursuing efforts to limit [it] to 1.5°C”, and meets objectives related to
universal energy access and cleaner air.
The other scenario referenced in the analysis is the Stated Policies
Scenario (STEPS), which provides an indication of where today’s policy
ambitions and plans, including national policy announcements and
pledges, would lead the energy sector.
Comparison between the outcomes in these two scenarios provides an
indication of the range of possible futures that are open to biogas and
biomethane, and the policy and technology levers that will affect which
pathway they ultimately follow.](https://image.slidesharecdn.com/outlookforbiogasandbiomethane-240207051242-1bffb676/85/Outlook_for_biogas_and_biomethane-pdf-3-320.jpg)

![10 | Outlook for biogas and biomethane | IEA 2020. All rights reserved
Key findings
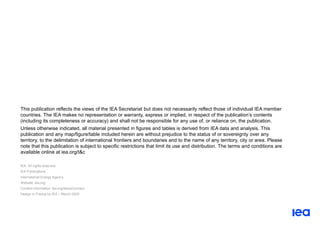
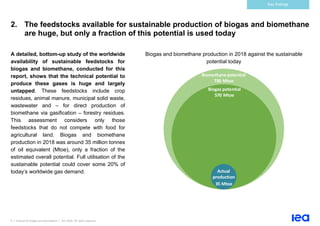
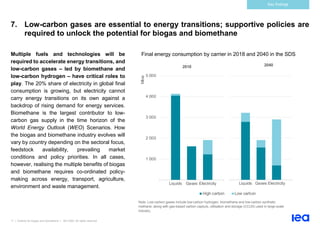
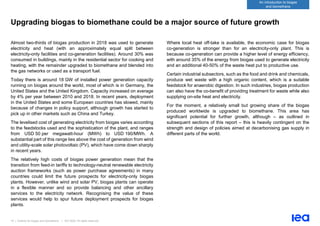
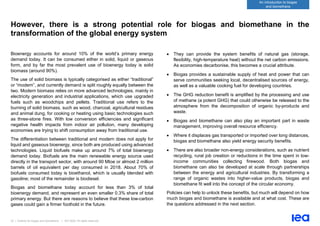
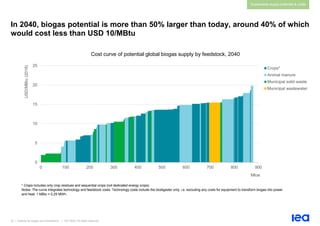
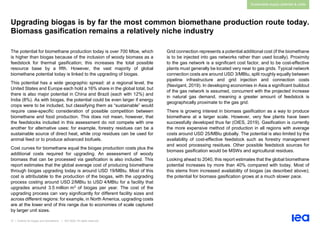
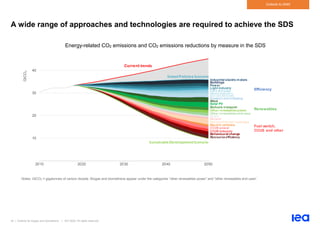
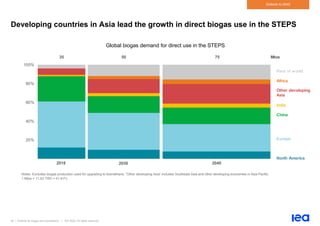
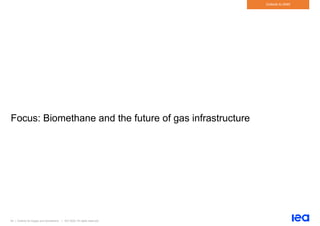
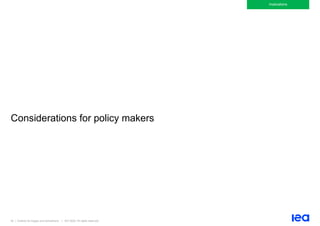
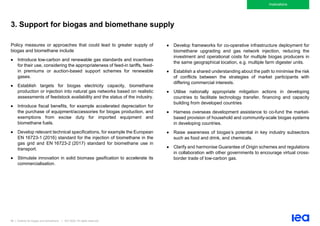
6. Most of the biomethane potential is more expensive than natural gas, but the
cost gap narrows over time
With the exception of some landfill gas, most
of the biomethane assessed in this report is
more expensive than the prevailing natural
gas prices in different regions. The average
price for biomethane produced today is around
USD 19 per million British thermal units (MBtu),
with some additional costs for grid injection.
However, this report estimates that around
30 Mtoe (~40 billion cubic metres [bcm]) of
biomethane – mostly landfill gas – could be
produced today at a price that undercuts the
domestic price of natural gas; this is already
ten times more than total biomethane
consumption today.
The cost gap is projected to narrow over time as
biomethane production technologies improve
and as carbon pricing in some regions makes
natural gas more expensive. Recognition of the
value of avoided CO2 and methane emissions
goes a long way towards improving the cost-
competitiveness of biomethane.
Cost ranges for developing global biomethane potential today
200
400
600
800
0-5 5-10 10-15 15-20 20-25 >25 Total
potential
Mtoe
20 Mtoe
35
150
210
190
125 730
USD/MBtu](https://image.slidesharecdn.com/outlookforbiogasandbiomethane-240207051242-1bffb676/85/Outlook_for_biogas_and_biomethane-pdf-10-320.jpg)
![29 | Outlook for biogas and biomethane | IEA 2020. All rights reserved
Sustainable supply potential & costs
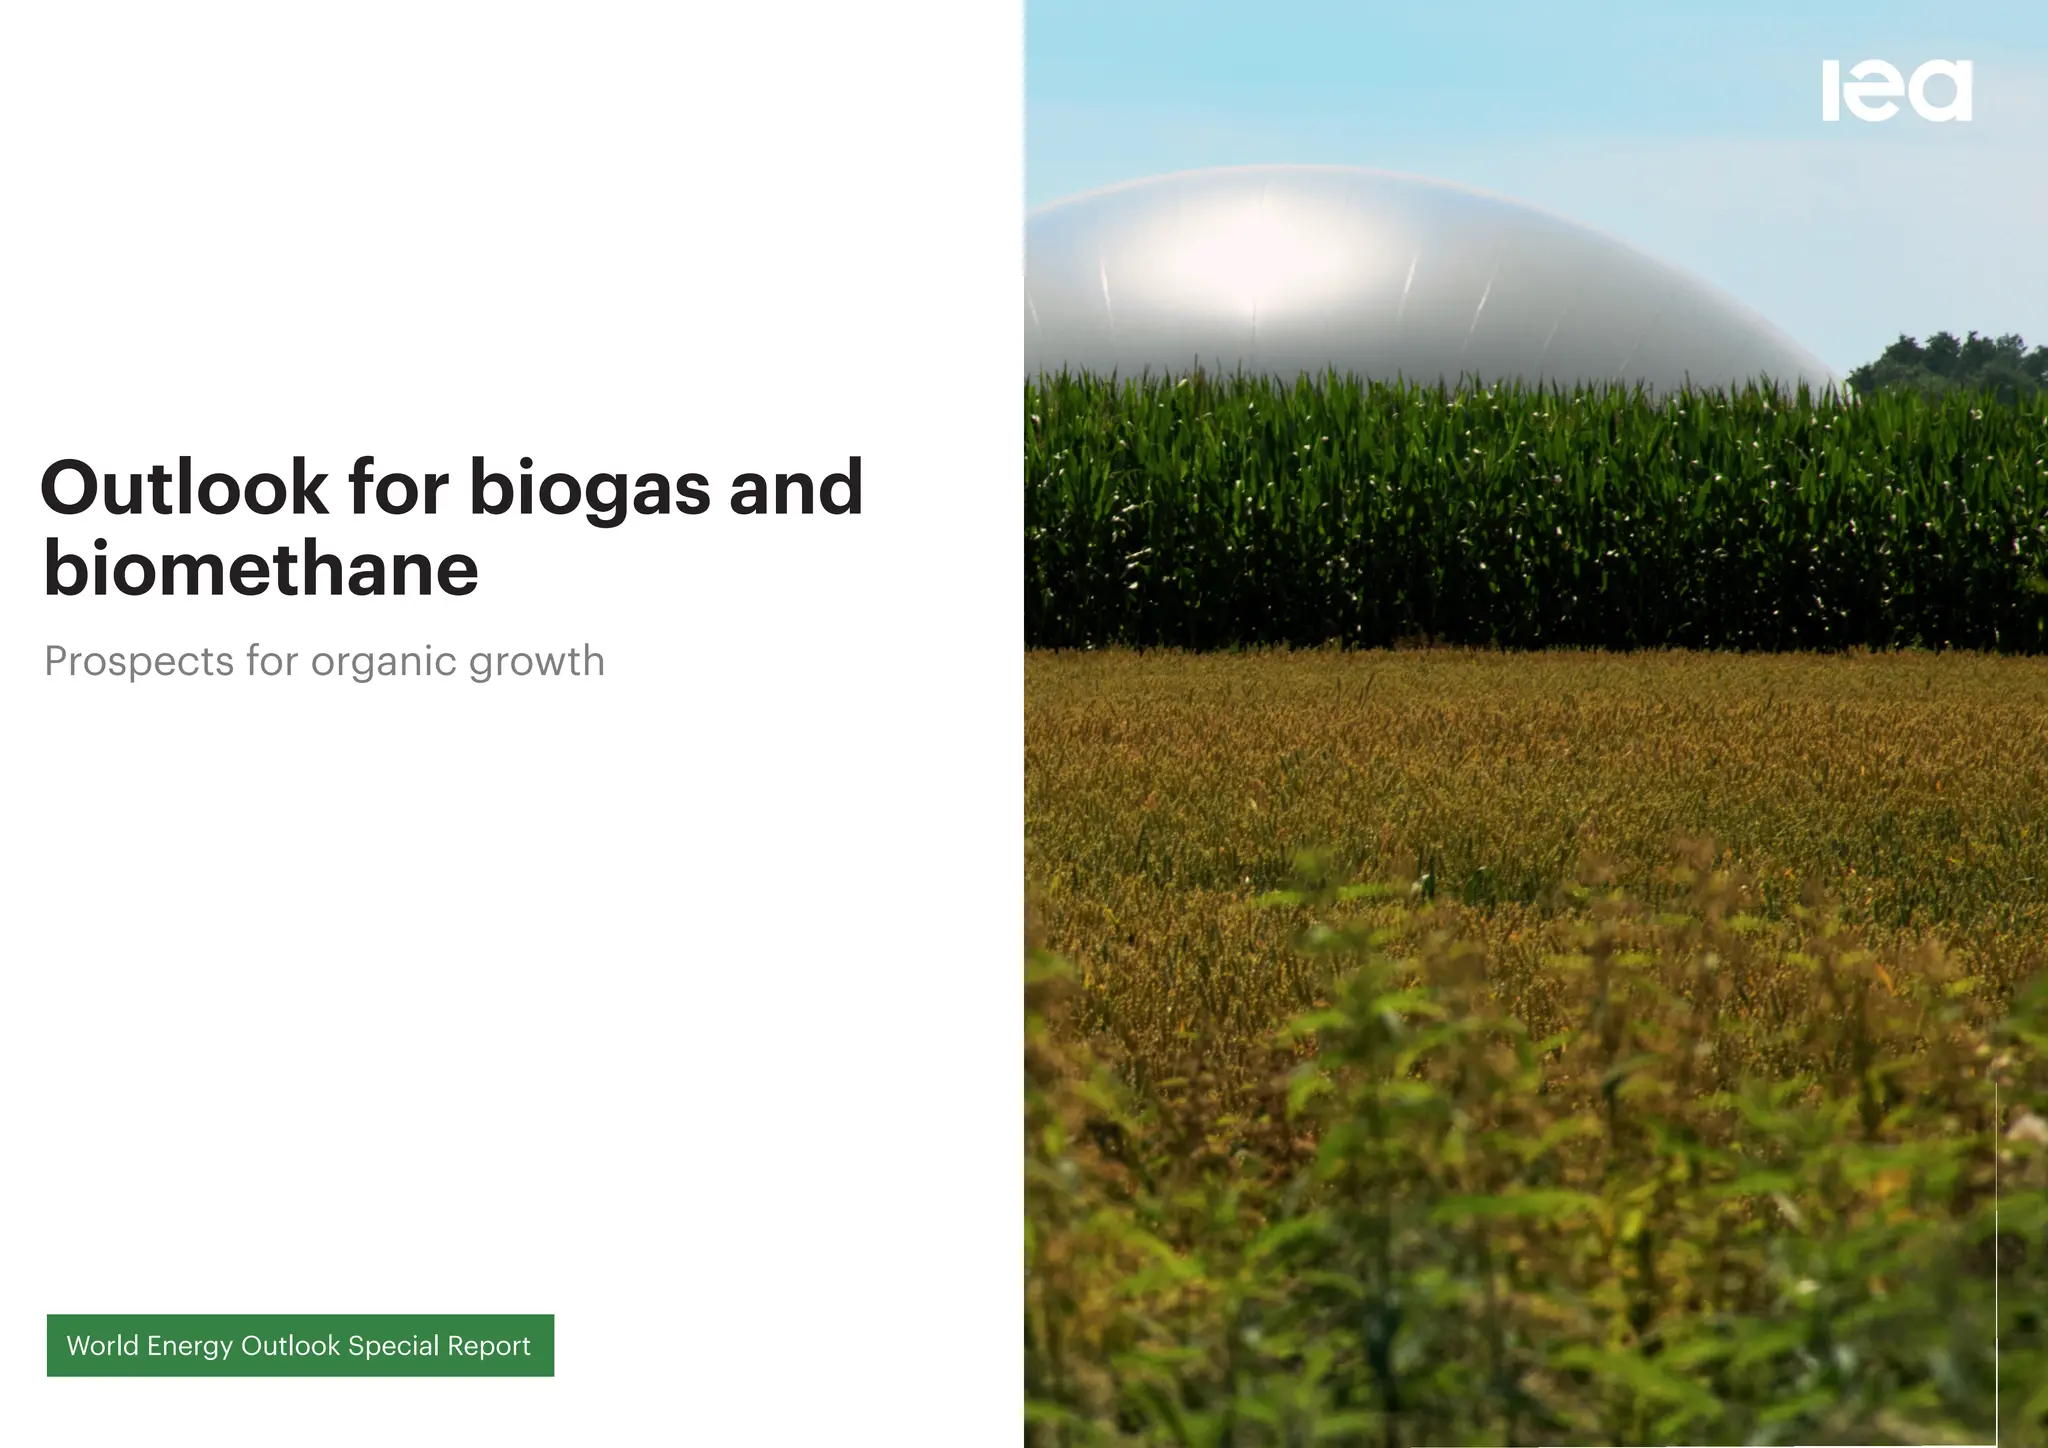
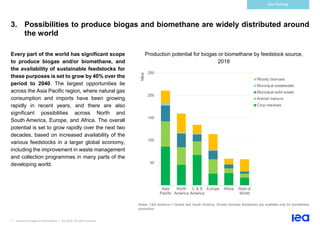
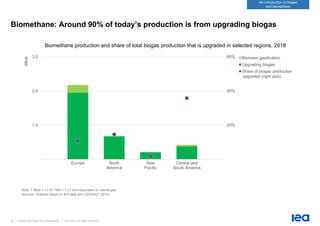
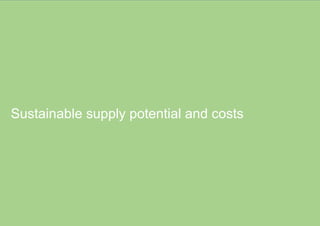
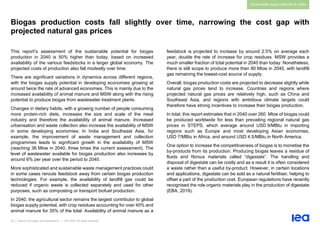
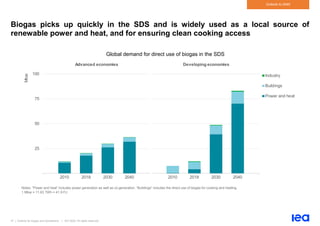
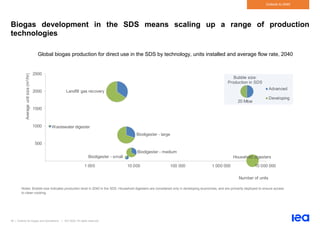
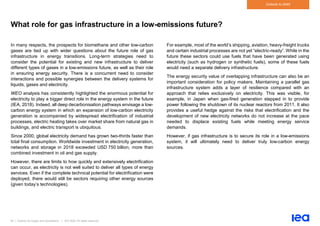
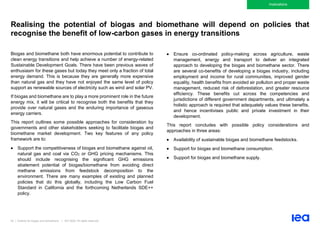
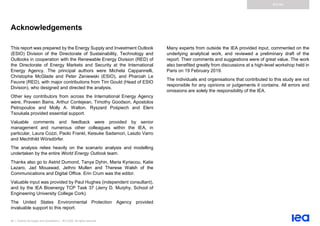
Each biogas technology is adapted for different types of user and use, and comes
with distinctive advantages and challenges
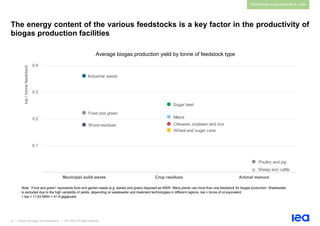
There are many different pathways for biogas production, involving
different feedstocks and biogas technologies. Livestock manure is the
most common feedstock, but the biogas production yield is significantly
lower than what could be obtained from crop residues. Industrial waste
is the highest-yielding feedstock, able to provide around 0.40 toe of
energy per tonne. Besides yields, there is variation in the cost and effort
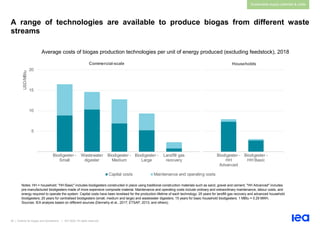
required for collecting different volumes of feedstock. Technologies also
vary; this report assessed the following:
• Decentralised biodigesters at household scale, categorised into
either basic or advanced technologies
• Centralised biodigesters systems categorised by small (100 cubic
metres per hour [m3/h]), medium (250 m3/h) and large scale output
flow rates (750 m3/h)
• Existing wastewater treatment plants adapted to process sludge
produced at the municipal level (1 000 m3/h)
• Landfill gas recovery systems to recover biogas produced from
closed landfill sites (2 000 m3/h).
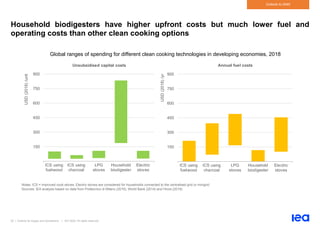
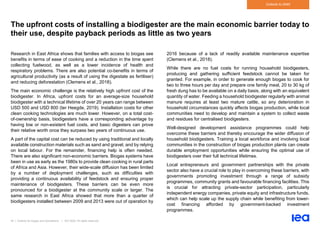
Household-scale biogas systems can provide heating and cooking fuels
in developing countries, as an alternative to the traditional use of solid
biomass. The output of these units are typically around 1 m3 per day,
providing two to three hours of gas-fired stove cooking time for every
20 to 30 kg of animal manure (SNV, 2019). The capital costs of these
basic technologies lie in a range of USD 3-8/MBtu (USD 10-30/MWh)
and generally have shorter lifetimes and variable production yields.
Feedstocks are usually available locally at zero cost, and in many cases
the deployment of these systems has been supported through
development programmes.
The picture changes when biodigesters scale up. Providing a
continuous flow of organic material in significant quantities requires a
more structured system to collect industrial quantities of feedstock. The
biogas output is then typically connected to a captive power or
co-generation plant involving additional investments. To ensure efficient
operation, temperatures need to be maintained generally in the range
of 30-45°C, and the feedstock must be continuously moved. For these
reasons, centralised commercial and industrial biogas plants are more
technologically sophisticated and their capital and operating costs per
unit of energy produced are higher, although they also offer higher
levels of efficiency and automation.
Anaerobic digestion systems can be installed at water treatment plants
(through the processing of sewage sludge with high moisture content).
Adapting a wastewater treatment plant entails high upfront investment
costs averaging around USD 15/MBtu, but can significantly improve the
longer-term economics of the plant. However, treatment capacities
must generally be higher than 5 000 m3 per day in order for the facility
to be cost-effective. Landfill gas extraction is possible for closed landfill
facilities containing MSW. This technology is best positioned to benefit
from economies of scale, with production costs below USD 3/MBtu.
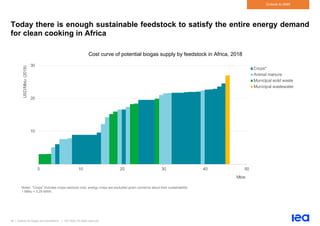
The suitability of these various technologies depend on factors such as
location, feedstock availability and end-use applications. In this analysis
each type of feedstock is allocated to the most suitable technology,
resulting in the supply cost curves, presented below, which combine
technology and feedstock costs.](https://image.slidesharecdn.com/outlookforbiogasandbiomethane-240207051242-1bffb676/85/Outlook_for_biogas_and_biomethane-pdf-29-320.jpg)
![41 | Outlook for biogas and biomethane | IEA 2020. All rights reserved
Outlook to 2040
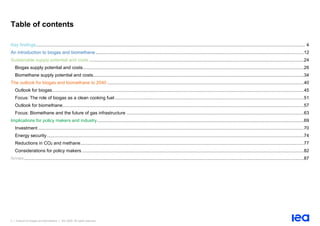
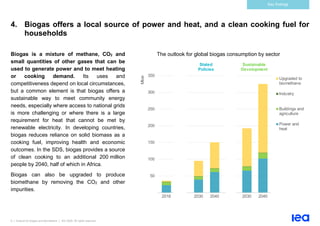
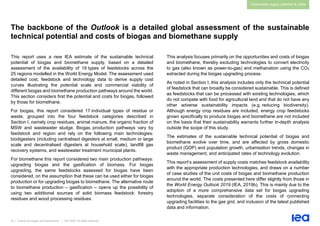
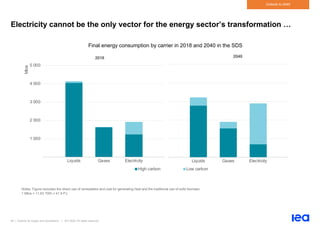
Scenarios for the future of energy
The future of biogas and biomethane cannot be considered separately
from the broader context of the global energy system. There is a huge
range of possible futures for global energy, depending on the pace of
technological innovation, the ambition of energy policies, market
dynamics, societal trends and many other factors. The analysis below
refers to two scenarios included in the IEA WEO, the Stated Policies
Scenario (STEPS) and the Sustainable Development Scenario (SDS).
The STEPS represents the IEA’s assessment of the implications of
today’s energy and climate policies, including those policies that have
been announced (for example, as part of the nationally determined
contributions under the Paris Agreement). This gives a sense of the
direction in which the global energy system is heading, based on the
latest available market and technology data and a defined set of starting
conditions and assumptions.
The SDS takes the opposite approach. It fixes the end point, in this case
full achievement of various energy-related sustainable development
goals, and then works out a feasible pathway to reach them. Most
significantly, it charts a pathway for the global energy sector to be fully
aligned with the Paris Agreement by holding the rise in global
temperatures to “well below 2°C … and pursuing efforts to limit [it] to
1.5°C”. It also meets goals relating to universal access to modern
energy, including access to both electricity and clean cooking fuels, as
well as a dramatic reduction in emissions of the pollutants that cause
poor air quality.
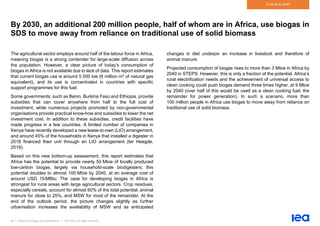
Achieving the SDS would require rapid and widespread changes across
all parts of the energy system, but there is a large gap between this
scenario and the direction outlined in STEPS. While the SDS requires
an early peak and a rapid decline in energy-related CO2 emissions, in
the STEPS there is no such peak in sight before 2040. And while the
SDS sees universal access to modern energy achieved by 2030, in the
STEPS there are still more than 600 million people remaining without
electricity in 2030, and well over 2 billion still reliant upon the traditional
use of solid biomass as a cooking fuel.
This disparity between the direction in which the world appears to be
heading, on the one hand, and what would be required to hit crucial
energy-related sustainable development goals, on the other, is a crucial
fault line in global energy. The production and use of biogas and
biomethane grow in both of these scenarios, but the STEPS and SDS
also provide divergent visions of the opportunities that might lie ahead.](https://image.slidesharecdn.com/outlookforbiogasandbiomethane-240207051242-1bffb676/85/Outlook_for_biogas_and_biomethane-pdf-41-320.jpg)


![73 | Outlook for biogas and biomethane | IEA 2020. All rights reserved
Implications
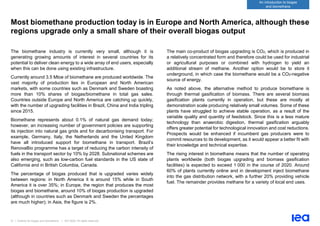
New business models and improved access to financing are critical to the
prospects for biogas and biomethane
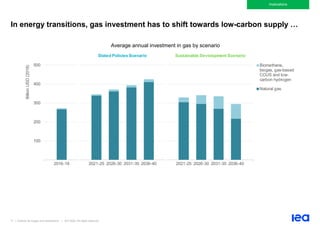
Currently, biogas and biomethane projects represent only a small
fraction of total global spending on gas. Investments have averaged
less than USD 4 billion per year over the last decade, the same amount
the natural gas industry typically spends every week.
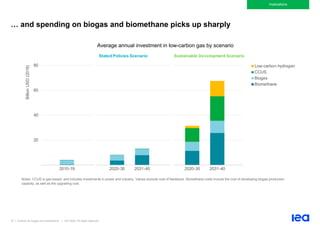
In the STEPS, annual spending on biogas and biomethane rises more
than threefold to reach around USD 14 billion by 2040. Rising spending
on biomethane eclipses the amount invested in the direct use of biogas
by the late 2020s. However, the share of biomethane and biogas in total
investment spending on gas remains well below 5%.
The SDS sees a significant upside to this trend. As investment in natural
gas declines, total capital spending on low-carbon gases rises to
capture over a quarter of total investment in global gas supply, as
biogas and biomethane are scaled up and hydrogen and CCUS are
added to the mix of low-carbon gases. Biomethane and biogas projects
remain the largest destination for low-carbon gas investment, capturing
40% of the total; by 2040, around USD 30 billion is spent on biomethane
injected into gas grids every year, around the same level of investment
being made in shale gas development in the United States today. These
investments are made primarily in developing economies in Asia,
particularly China and India, which together make up nearly 40% of total
global spending.
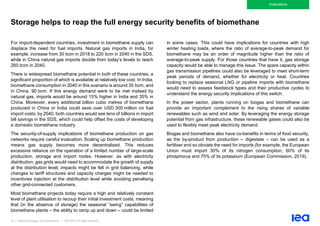
The investments made in the SDS assume that several financing
barriers are overcome. At the moment, biogas and biomethane projects
encounter some of the same financing challenges as other small-scale,
distributed renewable projects (especially in developing economies).
Local banks often serve as a first port of call for raising the capital
necessary for a biogas project; however, the loan requirements are
often too small to attract project finance, and also potentially too large
for individual investors (e.g. farmers) to raise the required equity. The
latter is usually around 20-25% of the initial capital costs (which, for a
medium-sized biogas plant producing around 2 million cubic metres per
year [1.7 kilotonnes of oil equivalent], would be in the range of
USD 1.5 million to USD 2 million).
From a banking perspective, there is often a lack of technical expertise
in this area and relatively few benchmarks to assess adequately the
risk/return profile for individual projects. There are also some risks that
can be difficult to assess, e.g. the ability to secure reliable feedstock of
consistent quality or, in the case of biomethane, to meet the rigorous
gas quality specifications for injection into national distribution networks.
These issues can increase risk perceptions and raise the cost of debt
or reduce the loan tenure available to potential investors.
Various models are being tested to overcome these hurdles; for
example, project sponsors such as energy companies or larger-scale
agricultural firms can offer an integrated business model to farming
communities, in order to take advantage of fixed feed-in tariffs or other
forms of subsidy, which typically yield a lower risk for securing finance.
Farming co-operatives or other models that aggregate feedstock
sources are also viable routes to scale up production.
Both biogas and biomethane projects might also benefit from the
growing accessibility of financial instruments focused on renewable
projects, such as green bonds or targeted institutional investor funds.](https://image.slidesharecdn.com/outlookforbiogasandbiomethane-240207051242-1bffb676/85/Outlook_for_biogas_and_biomethane-pdf-73-320.jpg)


![90 | Outlook for biogas and biomethane | IEA 2020. All rights reserved
Annex
References
Cedigaz (2019). Global biomethane market: Green gas goes global
(press release, 20 March). https://www.cedigaz.org/global-
biomethane-market-green-gas-goes-global/.
Clemens et al. (2018). Africa Biogas Partnership Program: A review of
clean cooking implementation trhough market development in
East Africa. Energy for Sustainable Development.
https://doi.org/10.1016/j.esd.2018.05.012.
Dennehy C. et al. (2017). Stochastic modelling of the economic
viability of on-farm co-digestion of pig manure and food waste
in Ireland. https://doi.org/10.1016/j.apenergy.2017.08.101.
EBA (European Biogas Association) (2019). Statistical Report.
https://www.europeanbiogas.eu/eba-statistical-report-2019/.
ETSAP (Energy Technology System Analysis Programme) (2013).
Biogas and Bio-syngas Production. https://iea-etsap.org/E-
TechDS/PDF/P11_BiogasProd_ML_Dec2013_GSOK.pdf.
European Commission. (2019). Fertilisers in the EU.
https://ec.europa.eu/info/sites/info/files/food-farming-
fisheries/farming/documents/market-brief-
fertilisers_june2019_en.pdf.
Giuntoli J. et al. (2015). Solid and Gaseous Bioenergy Pathways: Input
Values and GHG Emissions. Italy: European Commission Joint
Research Centre, Institute for Energy and Transport, Ispra.
https://ec.europa.eu/energy/sites/ener/files/documents/Solid%2
0and%20gaseous%20bioenergy%20pathways.pdf.
GMI (Global Methane Institute) (2019).
https://www.globalmethane.org/partners/partner.aspx?c=india,
(accessed 1 July 2019).
GRDF (Gaz réseau distribution France). (2018). Perspectives gaz
naturel & renouvelables sur l'horizon 2018-2035 [Natural gas
and renewables perspectives, 2018-2035].
http://www.grtgaz.com/fileadmin/plaquettes/fr/2019/Perspective
s-Gaz-2018.pdf.
Hivos. (2019). Beyond fire: How to achieve electrical cooking,
28 March, https://www.hivos.org/news/beyond-fire-how-to-
achieve-electric-cooking/.
IEA (International Energy Agency). (2019a). Renewables 2019.
https://www.iea.org/reports/renewables-2019.
IEA. (2019b). World Energy Outlook 2019.
https://www.iea.org/reports/world-energy-outlook-2019.
IEA. (2018). World Energy Outlook 2018.
https://www.iea.org/reports/world-energy-outlook-2018.
Koornneef J. et al. (2013). Potential for biomethane production with
carbon capture, transport and storage up to 2050.
https://doi.org/10.1016/j.egypro.2013.06.533
McDonagh S. et al. (2019). Are electro fuels a sustainable transport
fuel? Analysis of the effect of controls on carbon, curtailment,
and cost of hydrogen.
https://doi.org/10.1016/j.apenergy.2019.04.060.
Navigant (2019). Gas for Climate.
https://www.gasforclimate2050.eu/files/files/Navigant_Gas_for_](https://image.slidesharecdn.com/outlookforbiogasandbiomethane-240207051242-1bffb676/85/Outlook_for_biogas_and_biomethane-pdf-90-320.jpg)