KAHULUGAN AT KAHALAGAHAN NG GAWAING PANSIBIKO.pptx
ONT Airport In Charts
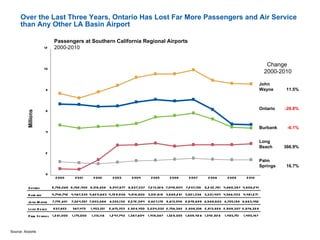
1. Over the Last Three Years, Ontario Has Lost Far More Passengers and Air Service than Any Other LA Basin Airport Passengers at Southern California Regional Airports 2000-2010 Source: Airports Change 2000-2010 John Wayne 11.5% Ontario -28.8% Burbank -6.1% Long Beach 366.9% Palm Springs 16.7%
2. Southern California Airport Regionalization – Since 2003, LAX’s market share has actually increased from 69.7% to 72.5% – Over the 20-year period from 1990, LAX’s market share has dropped only 2.5% Passenger Share of Southern California Airports LAX, Ontario, Burbank, John Wayne, Long Beach, Palm Springs Source: airports
3. Destinations and Departures Change in Number of Domestic Destinations Aug 2007 – August 2011 Change in Number of Domestic Departures Aug 2007 – August 2011 # of Domestic Destinations Airport Aug '07 Aug '11 Chg % ONT 32 14 (18) -56% SNA 24 19 (5) -21% PSP 10 9 (1) -10% BUR 12 12 0 0% LAX 89 94 5 6% LGB 11 17 6 55% Average Daily Departures Airport Aug '07 Aug '11 Chg % ONT 130 69 (62) -47% PSP 29 21 (8) -29% SNA 148 114 (34) -23% BUR 98 77 (21) -21% LAX 714 682 (32) -5% LGB 40 44 4 11%
4. ONT – Highest Cost per Enplaned Passenger among Similar Sized Airports Source: Jacobs Consultancy Report to Los Angeles World Airports, August 2010 – analysis commissioned by LAWA Cost per Enplaned Passenger for Airport Rent & Landing Fees
5. Low Fares and High Airport Costs Don’t Work ONT’s high airport costs make it difficult for airlines to make a profit Average One-Way Fares to Phoenix on Southwest (2009) Average One-Way Fares to Sacramento on Southwest (2009) Average Southwest System-wide Profit Margin 2 nd Qtr 2010 3.5% Full year 2009: 1.0% Average Southwest Profit on $90 Airfare (2 nd qtr) $3.15 Average Southwest Landing Fees and Non-aircraft Rent 7.1% of Costs Rent/Landing Fee Cost per Passenger Airport Differential Southwest system average: $7.10 Ontario: $14.50 -> $7.40 John Wayne: $9.93 -> $2.83 Burbank: $2.10 -> $5.00 Airport Rent/Landing Fees as % of One-Way $90 Fare
6. Southern California Airport Regionalization – From 2003 to 2010, LAX’s market share has actually increased from 69.7% to 72.5% – Projected 2011 growth at LAX will increase its share to 74.1% Passenger Share of Southern California Airports LAX, Ontario, Burbank, John Wayne, Long Beach, Palm Springs Source: airports * Projected, based on actual passengers Jan-May 2011 and projected seat change Jun-Dec 2011
7. ONT’s Passenger Level Has Fallen to the Lowest Point since 1987 All growth over the past 24 years has been lost ONT – Annual Passengers 1980-2010 actual, 2011 projected Source: LAWA 1980-2010; 2011 projected based on actual through June and projected through December 2011
8.
9. The FAA Forecasts that over the Next 20 Years, Most of the Region’s Air Traffic Growth will be Concentrated at LAX LAX is forecast to grow by over 50 million passengers and to increase its share of the region’s passengers by another 5 points to 76.4% FAA Forecast Passengers at Southern California Regional Airports Actual FY 2000-2009 and Forecast FY 2010-2030 Source: FAA TAF Enplanements (M)
Editor's Notes
Source file: C:\\Documents and Settings\\RiedlE\\Desktop\\SSF ERi\\Source
Source file: C:\\Documents and Settings\\RiedlE\\Desktop\\SSF ERi\\Source