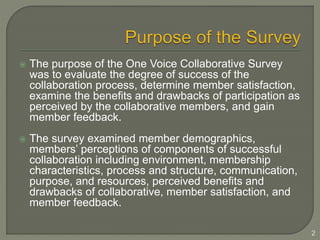
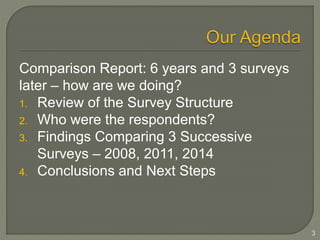
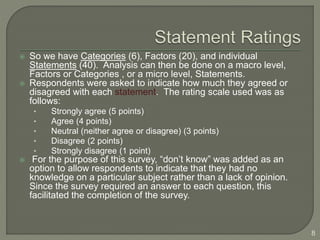
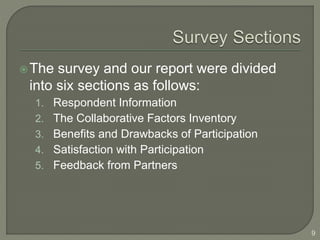
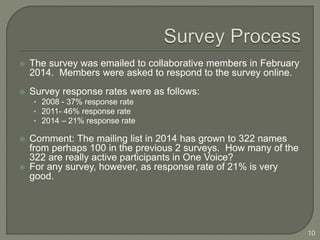
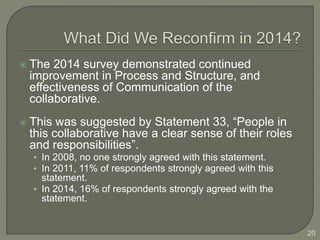
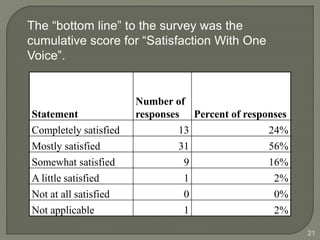
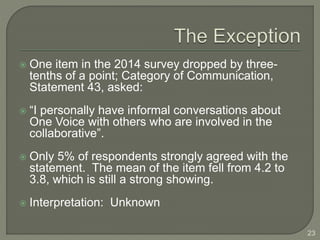
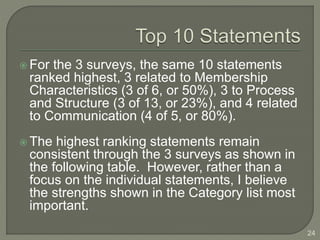
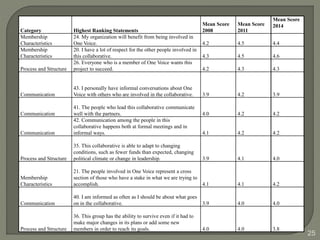
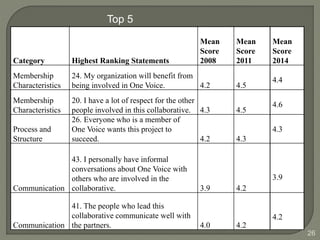
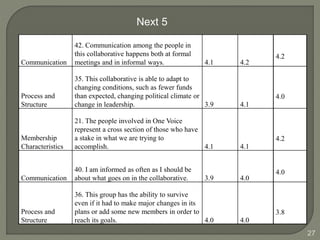
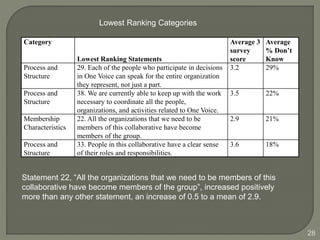
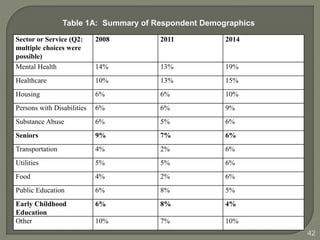
Presented at the One Voice Board Meeting 
June 20, 2014 
Gerald R. Goodman, DrPH 
Professor and Program Director 
Health Care Administration 
Texas Woman's University 
1
 The purpose of the One Voice Collaborative Survey 
was to evaluate the degree of success of the 
collaboration process, determine member satisfaction, 
examine the benefits and drawbacks of participation as 
perceived by the collaborative members, and gain 
member feedback. 
 The survey examined member demographics, 
members’ perceptions of components of successful 
collaboration including environment, membership 
characteristics, process and structure, communication, 
purpose, and resources, perceived benefits and 
drawbacks of collaborative, member satisfaction, and 
member feedback. 
2
Comparison Report: 6 years and 3 surveys 
later – how are we doing? 
1. Review of the Survey Structure 
2. Who were the respondents? 
3. Findings Comparing 3 Successive 
Surveys – 2008, 2011, 2014 
4. Conclusions and Next Steps 
3
 The survey statements were adapted from the Wilder 
Collaboration Factors Inventory developed by the Amherst H. 
Wilder Foundation. 
 The survey (inventory) was developed and tested over a 
period of eight years. The inventory is designed to help 
collaboratives and community collaboratives assess their 
strengths and weaknesses relative to 20 success factors. 
 Research suggests that these factors can apply to 
collaborative efforts of nonprofit, governmental and other 
organizations. 
 Respondents are asked to rate their level of agreement with 
40 different statements ** about the collaborative. 
4
Category (6) 
Category Factory (20) 
Category Statement (40) 
• The survey respondents answered statement 
questions. The statement questions are grouped 
into 6 categories for analysis. 
5
6 
Example of Rank Order 
Category Factor Statement 
Environment History of collaboration in the community 5. Agencies in our community have a history of 
working together. 
6. Trying to solve problems through collaboration has 
been common in this community. It's been done a lot 
before. 
Collaborative group seen as a legitimate leader 
in the community 
7. Leaders in this community who are not part of 
Care for Elders seem hopeful about what we can 
accomplish. 
8. Others (in this community) who are not part of 
Care for Elders would generally agree that the 
organizations involved in this partnership are the 
"right" organizations to make this work. 
Favorable political and social climate 9. The political and social climate seems to be "right" 
for a partnership like this one. 
14. The time is right for this partnership.
To simplify analysis, the authors grouped the 
40 individual statements into six global 
categories, which were in turn grouped into 
20 success factors: 
 Categories: 
1. Environment 
2. Membership Characteristics 
3. Process and Structure 
4. Communication 
5. Purpose 
6. Resources 
7
 So we have Categories (6), Factors (20), and individual 
Statements (40). Analysis can then be done on a macro level, 
Factors or Categories , or a micro level, Statements. 
 Respondents were asked to indicate how much they agreed or 
disagreed with each statement. The rating scale used was as 
follows: 
• Strongly agree (5 points) 
• Agree (4 points) 
• Neutral (neither agree or disagree) (3 points) 
• Disagree (2 points) 
• Strongly disagree (1 point) 
 For the purpose of this survey, “don’t know” was added as an 
option to allow respondents to indicate that they had no 
knowledge on a particular subject rather than a lack of opinion. 
Since the survey required an answer to each question, this 
facilitated the completion of the survey. 
8
The survey and our report were divided 
into six sections as follows: 
1. Respondent Information 
2. The Collaborative Factors Inventory 
3. Benefits and Drawbacks of Participation 
4. Satisfaction with Participation 
5. Feedback from Partners 
9
 The survey was emailed to collaborative members in February 
2014. Members were asked to respond to the survey online. 
 Survey response rates were as follows: 
• 2008 - 37% response rate 
• 2011- 46% response rate 
• 2014 – 21% response rate 
 Comment: The mailing list in 2014 has grown to 322 names 
from perhaps 100 in the previous 2 surveys. How many of the 
322 are really active participants in One Voice? 
 For any survey, however, as response rate of 21% is very 
good. 
10
11
12 
Table 1A: Summary of Respondent Demographics 
Type of 
Participation 
(Q1: only 1 
answer possible 
2008 2011 2014 
Part of a non-profit 
organization 
80% 74% 69% 
Part of a 
governmental 
agency 
17% 11% 18% 
Other 2% 5% 13%
13 
Table 1A: Summary of Respondent Demographics 
Sector or Service (Q2: 
multiple choices were 
possible) 
2008 2011 2014 
Mental Health 14% 13% 19% 
Healthcare 10% 13% 15% 
Housing 6% 6% 10% 
Persons with Disabilities 6% 6% 9% 
Substance Abuse 6% 5% 6% 
Seniors 9% 7% 6% 
Transportation 4% 2% 6% 
Utilities 5% 5% 6% 
Food 4% 2% 6% 
Public Education 6% 8% 5% 
Early Childhood 
Education 
6% 8% 4% 
Other 10% 7% 10%
14 
Sector or Service-Other 2014 
Child Welfare (deleted as a category in 2014). 
Health Assessment, Education & Outreach. 
We are a non-profit funder. 
Multi discipline including seniors, health care, mental health, 
utilities. 
Veterans. 
Adult Education. 
Community based organization - healthcare, seniors, trans, 
housing, utilities and food.
15 
Table 1B: Participation 
Level of Participation 
(Q12: one choice was 
possible) 
% 2008 % 2011 % 2014 
Less than 2 meetings 19% 13% 22% 
2 to 6 meetings 37% 44% 38% 
7 to 12 meetings 22% 32% 27% 
13 or more meetings 22% 12% 13% 
Two comments about participation: 
(1) There was a statistically significant relationship found between a 
higher level of participation and the answer to the statement “My 
organization benefits from being involved”. 
(2) The change over the past several years in participation in 13 or 
more meetings may be explained by the changing frequency for 
workgroup and collaborative-wide meetings.
16 
Issue 
2011 
Weighted 
Rank 
2014 
Weighted 
Rank 
Availability of appropriate services 292 253 
Sustainable funding 311 249 
Availability of comprehensive services 
286 233 
Capacity to deliver needed services 288 231 
Accessibility to needed services 286 226 
Affordability of services 278 176
17 
Other Issues Noted 
The ACA and Ryan White Care Act. What is the impact? 
We are not a direct service provider so our interests aren't really any of the above. We 
are more focused on transforming the homeless response system and making sure the 
supportive laws, funding and other resources are there to integrate the changes into 
long term practices. 
Public awareness about our program. 
Fostering partnership and support from other organizations. 
Quality of HC. 
The need for local organizations to continue to collaborate and provide shared services 
to increase efficiency and comprehensive programming. 
The mentally ill have special problems as well as special needs that need to be 
addressed. Co dependency being one. 
Medication and crisis services before people are danger to self or others. 
Stopping the cycle of juveniles and adults through the juvenile and criminal justice 
systems, particularly those with mental health and substance abuse issues. 
Specialty Health Care Services for low income and Women's Health Care.
Looking at Statements and Categories 
18
 In the 2008 and 2011 surveys, the factors with overall 
means greater than 4.0 were related to the unique 
purpose of the collaborative as demonstrated in the 
mission statement: “…working together to ensure that 
the health and human service needs of all Texans are 
addressed in public policy, legislative and regulatory 
initiatives”. 
 The previous 2 surveys rated the categories 
Environment and Purpose as 4.0, excellent. The 
category Resources had 3 questions, 2 of which 
consistently had 30% of respondents answer “Don’t 
Know”. All 3 of these categories were not included in 
the 2014 survey. 
19
 The 2014 survey demonstrated continued 
improvement in Process and Structure, and 
effectiveness of Communication of the 
collaborative. 
 This was suggested by Statement 33, “People in 
this collaborative have a clear sense of their roles 
and responsibilities”. 
• In 2008, no one strongly agreed with this statement. 
• In 2011, 11% of respondents strongly agreed with this 
statement. 
• In 2014, 16% of respondents strongly agreed with the 
statement. 
20
21 
The “bottom line” to the survey was the 
cumulative score for “Satisfaction With One 
Voice”. 
Statement 
Number of 
responses Percent of responses 
Completely satisfied 13 24% 
Mostly satisfied 31 56% 
Somewhat satisfied 9 16% 
A little satisfied 1 2% 
Not at all satisfied 0 0% 
Not applicable 1 2%
Collaborative Factors Results 
 As a general rule, the instrument developers recommend: 
• Scores of 4.0 or higher show a strength and probably don’t 
need special attention 
• Scores from 3.0 to 3.9 are borderline and should be 
discussed by the group to see if they deserve attention. 
• Scores of 2.9 or lower reveal a concern and should be 
addressed. 
 The mean scores on the statements ranged from: 
• 2008: a range of 2.3 to 4.2, average of 3.7 
• 2011: a range of 2.4 to 4.5, average of 3.8 
• 2014: a range of 2.9 to 4.4, average of 3.8 
 The differences are slight but interesting. In the 2014 
survey, the results reflect a more positive opinion overall. 
In 2014, 8 items were ranked below the 2008 level. Those 
differences were typically one-tenth of a point drop. 
22
 One item in the 2014 survey dropped by three-tenths 
of a point; Category of Communication, 
Statement 43, asked: 
 “I personally have informal conversations about 
One Voice with others who are involved in the 
collaborative”. 
 Only 5% of respondents strongly agreed with the 
statement. The mean of the item fell from 4.2 to 
3.8, which is still a strong showing. 
 Interpretation: Unknown 
23
 For the 3 surveys, the same 10 statements 
ranked highest, 3 related to Membership 
Characteristics (3 of 6, or 50%), 3 to Process 
and Structure (3 of 13, or 23%), and 4 related 
to Communication (4 of 5, or 80%). 
 The highest ranking statements remain 
consistent through the 3 surveys as shown in 
the following table. However, rather than a 
focus on the individual statements, I believe 
the strengths shown in the Category list most 
important. 
24
25 
Category Highest Ranking Statements 
Mean Score 
2008 
Mean Score 
2011 
Mean Score 
2014 
Membership 
Characteristics 
24. My organization will benefit from being involved in 
One Voice. 4.2 4.5 4.4 
Membership 
Characteristics 
20. I have a lot of respect for the other people involved in 
this collaborative. 4.3 4.5 4.6 
Process and Structure 
26. Everyone who is a member of One Voice wants this 
project to succeed. 4.2 4.3 4.3 
Communication 
43. I personally have informal conversations about One 
Voice with others who are involved in the collaborative. 3.9 4.2 3.9 
Communication 
41. The people who lead this collaborative communicate 
well with the partners. 4.0 4.2 4.2 
Communication 
42. Communication among the people in this 
collaborative happens both at formal meetings and in 
informal ways. 4.1 4.2 4.2 
Process and Structure 
35. This collaborative is able to adapt to changing 
conditions, such as fewer funds than expected, changing 
political climate or change in leadership. 3.9 4.1 4.0 
Membership 
Characteristics 
21. The people involved in One Voice represent a cross 
section of those who have a stake in what we are trying to 
accomplish. 4.1 4.1 4.2 
Communication 
40. I am informed as often as I should be about what goes 
on in the collaborative. 3.9 4.0 4.0 
Process and Structure 
36. This group has the ability to survive even if it had to 
make major changes in its plans or add some new 
members in order to reach its goals. 4.0 4.0 3.8
26 
Category Highest Ranking Statements 
Mean 
Score 
2008 
Mean 
Score 
2011 
Mean 
Score 
2014 
Membership 
Characteristics 
24. My organization will benefit from 
being involved in One Voice. 4.2 4.5 
4.4 
Membership 
Characteristics 
20. I have a lot of respect for the other 
people involved in this collaborative. 4.3 4.5 
4.6 
Process and 
Structure 
26. Everyone who is a member of 
One Voice wants this project to 
succeed. 4.2 4.3 
4.3 
Communication 
43. I personally have informal 
conversations about One Voice with 
others who are involved in the 
collaborative. 3.9 4.2 
3.9 
Communication 
41. The people who lead this 
collaborative communicate well with 
the partners. 4.0 4.2 
4.2 
Top 5
27 
Communication 
42. Communication among the people in 
this collaborative happens both at formal 
meetings and in informal ways. 4.1 4.2 
4.2 
Process and 
Structure 
35. This collaborative is able to adapt to 
changing conditions, such as fewer funds 
than expected, changing political climate or 
change in leadership. 3.9 4.1 
4.0 
Membership 
Characteristics 
21. The people involved in One Voice 
represent a cross section of those who have 
a stake in what we are trying to 
accomplish. 4.1 4.1 
4.2 
Communication 
40. I am informed as often as I should be 
about what goes on in the collaborative. 3.9 4.0 
4.0 
Process and 
Structure 
36. This group has the ability to survive 
even if it had to make major changes in its 
plans or add some new members in order to 
reach its goals. 4.0 4.0 
3.8 
Next 5
28 
Category 
Lowest Ranking Statements 
Average 3 
survey 
score 
Average 
% Don’t 
Know 
Process and 
Structure 
29. Each of the people who participate in decisions 
in One Voice can speak for the entire organization 
they represent, not just a part. 
3.2 29% 
Process and 
Structure 
38. We are currently able to keep up with the work 
necessary to coordinate all the people, 
organizations, and activities related to One Voice. 
3.5 22% 
Membership 
Characteristics 
22. All the organizations that we need to be 
members of this collaborative have become 
members of the group. 
2.9 21% 
Process and 
Structure 
33. People in this collaborative have a clear sense 
of their roles and responsibilities. 
3.6 18% 
Lowest Ranking Categories 
Statement 22, “All the organizations that we need to be members of this 
collaborative have become members of the group”, increased positively 
more than any other statement, an increase of 0.5 to a mean of 2.9.
29 
Table 7: Benefits of Participation ranked according to frequency 
selected (respondents could select more than one option) (ranked high to 
low) 
Benefits 2014 % of Partners Experiencing 
Benefit 
Acquired useful knowledge about services, 
programs, or people 
86% 
Enhanced ability to address an important issue 62% 
Developed valuable relationships 66% 
Provided ability to have a greater impact than I/we 
53% 
could have had on my/our own 
Enhanced ability to affect public policy 55% 
Enhanced ability to make contribution to the 
51% 
community 
Heightened public profile 40% 
Increased utilization of our expertise or services 29% 
Enhanced ability to meet the needs of our 
27% 
constituents or clients 
Developed new skills 26% 
Acquired additional financial support 9% 
None of the above 4%
30 
Table 8: Drawbacks of Collaborative: (could select more than one option) 
(ranked low to high by 2014 ranking) 
Choice #/Drawbacks 2008% of 
Partners 
Experiencing 
a Drawback 
2011% of 
Partners 
Experiencing a 
Drawback 
2014% of 
Partners 
Experiencing 
a Drawback 
Choice 3. Viewed negatively due to 
association with other partners or the 
collaborative 
17% (n=6) 0% (n=0) 2%(n=1) 
Choice 5. Received insufficient credit for 
contributing to the accomplishments of the 
collaborative 
3% (n=1) 0% (n=0) 4% (n=2) 
Choice 6. Created conflict between my job 
and the collaborative’s work 
6% (n=2) 4% (n=1) 2% (n=1) 
Choice 2. Wielded insufficient influence in 
collaborative activities 
6% (n=2) 13% (n=3) 7% (n=4) 
Choice 4. Resulted in frustration or 
aggravation 
11% (n=4) 30% (n=7) 9% (n=5) 
Choice 1. Diverted time and resources 
away from other priorities 
57% (n=20) 52% (n=12) 16% (n=9)
31
32 
Statement 
Table 9: Satisfaction Means by Statement 
How 
satisfied are 
you with the 
way the 
people and 
organizations 
in One Voice 
work 
together? 
(1 is excellent, 5 is poor) 
How satisfied 
are you with 
your 
influence in 
the 
collaborative? 
How 
satisfied are 
you with 
your role in 
the 
collaborativ 
e? 
How satisfied 
are you with 
the 
collaborative’s 
plans for 
achieving its 
goals? 
How satisfied 
are you with 
the way the 
collaborative 
is 
implementing 
its plans? 
2008 
Statement 
Mean 2.2 2.2 2.3 2.2 2.1 
2011 
Statement 
Mean 2.1 2.2 2.2 2.0 2.0 
2014 
Statement 
Mean 2.0 2.5 2.5 Not included 2.2
A recommendation following the 2008 survey 
was that there should be a well-planned 
response to the feedback provided by the 
responding partners. This was seen as 
having the potential to help the collaborative 
move to a higher level of collaboration. We 
suggested that the collaborative administer 
the collaborative inventory on an annual 
basis, or as needed, to provide on-going 
feedback on the status of the organization’s 
functioning. 
33
The leadership of One Voice has done 
exactly as recommended. A survey 
specific to the functioning of the work 
groups was conducted in 2009. The 
follow-up collaborative survey was initiated 
in 2011. The 2011 survey provided 
outcome measures of the effectiveness of 
the organizational and executive-level 
changes implemented in 2008 and 2009. 
34
 As noted in the previous surveys, the scores on 
the Collaboration Factors Inventory are not an 
absolute reflection of the collaborative’s ability to 
work effectively. There is no critical value on each 
factor to ensure success. As suggested earlier, 
scores of 4.0 or higher probably indicate strength 
on a factor (factor as opposed to a category). 
Scores from 3.0 to 3.9 ought to prompt some 
discussion to determine if the collaborative needs 
to devote attention to them. 
 Based on the category results, with a mean of 4.0 
being excellent, we find the following: 
35
36 
Category Finding 
Membership 
Characteristics 
Appropriate cross-section 
of members 
Mutual respect, 
understanding and trust 
3 survey mean of 3.9; median of 4.2. 
 Only 1 of the responses fell below 3.0. Statement 22 
had a mean of 2.9 – “All of the organizations that we 
need to be members of this collaborative have become 
members of the group”. And, as noted, this statement 
increased positively more than any other statement, an 
increase of 0.5 to a mean of 2.9, with 21% answering 
“Don’t Know”. 
 Without Statement 22, the mean is 4.15. 
 The median is the more accurate rating for this 
category. 
 Possible focus area, Statement 19 – “People involved 
in our collaborative always trust one another”. Four 
responded as strongly disagree, 10 responded as 
disagree with the statement. The outcome improved 
from earlier surveys with a 3 survey average of 3.5. 
However, only 10% responded as “Don’t Know” over 
the 3 surveys.
37 
Category Finding 
Process and 
Structure 
Multiple layers of 
decision making 
Members share a stake 
in both process and 
outcomes 
3 survey mean of 3.7, median of 3.9. 
 The category is large, 16 statements. 1 statement 
was below 3.5, Statement 29 – “Each of the 
people who participate in decisions in One Voice 
can speak for the entire organization they 
represent, not just a part”. Over 3 surveys, 29% 
answered “Don’t Know”. The statement answers 
reflect a normal lack of information about 
member organizations in a large collaborative 
such as One Voice. 
 Statement 31 – “The organizations that belong to 
One Voice invest the right amount of time in our 
collaborative efforts”, is similar. 3 survey mean 
of 3.4, but 23% of respondents answered “Don’t 
Know”. 
 The Median is the more accurate score. 
 No specific intervention is indicated.
38 
Category Finding 
Communication 
Open and frequent 
communication 
Established informal 
relationships and 
communication links 
3 survey mean of 3.8, median of 4.0. 
 For the 3 survey average, 4 of 5 statements ranked 4.0 or 
higher. 
 One statement ranked below 4.0, Statement 39 - “People 
in this collaborative communicate openly with one 
another”. The score on this response over 3 surveys has 
averaged 3.8. Average answering “Don’t Know” for the 3 
surveys is 12%. Without this statement, the overall mean 
score is 4.1. 
 The median is a more accurate measure than the mean. 
 An area to watch is reflected by the one item in the 2014 
survey that dropped by three-tenths of a point, Statement 
43 - “I personally have informal conversations about One 
Voice with others who are involved in the collaborative”. 
Only 5% of respondents strongly agreed with the 
statement. The mean of the item fell from 4.2 to 3.8. 
The 3 survey average was 4.0, with 2% answering “Don’t 
Know”. 
 However, Statement 39, above, with only 12% answering 
“Don’t Know”, may also be an area for additional study.
39 
Table 11: Drawbacks to Participation (reference Table 8) 
Comment 2008 
Survey 
2011 Survey 2014 
Survey 
Choice 2. Wielded insufficient 
influence in collaborative activities 
6% (n=2) 13% (n=3) 7% (n=4) 
Choice 4. Resulted in frustration or 
aggravation 
11% (n=4) 30% (n=7) 9% (n=5) 
Choice 1. Diverted time and 
resources away from other 
priorities 
57% (n=20) 52% (n=12) 16% (n=9) 
The drop in negative comments on Choice 1, diverted 
time, is important and reflects the change in meeting 
format and frequency. Also possibly the better 
organization of the workgroups.
“I am very dismayed that all issues 
pertaining to seniors in our community are 
being ignored while it seems that all efforts 
and all committees and workgroups are 
being focused on the issues of children. 
While the issues of children are important, I 
am very disappointed at this ongoing 
development”. 
40
 It is perhaps worth the time to track and 
report by service sector (Table 1A) the 
primary activities of the collaborative, 
noting how well the collaborative activities 
match (and don’t match) member’s service 
sectors. 
• If growth is important, do we need to be more 
inclusive? 
Bottom line, we have the data to make that 
determination. 
41
42 
Table 1A: Summary of Respondent Demographics 
Sector or Service (Q2: 
multiple choices were 
possible) 
2008 2011 2014 
Mental Health 14% 13% 19% 
Healthcare 10% 13% 15% 
Housing 6% 6% 10% 
Persons with Disabilities 6% 6% 9% 
Substance Abuse 6% 5% 6% 
Seniors 9% 7% 6% 
Transportation 4% 2% 6% 
Utilities 5% 5% 6% 
Food 4% 2% 6% 
Public Education 6% 8% 5% 
Early Childhood 
Education 
6% 8% 4% 
Other 10% 7% 10%
• Plan to resurvey the workgroups based on 
the legislative agenda submitted in 2016. 
• Consider, as a research agenda, why 
some issues succeed as regards a place 
on the legislative agenda, and some do not 
succeed? 
43

One Voice Texas Member Survey 2014

  • 1.
    Presented at theOne Voice Board Meeting June 20, 2014 Gerald R. Goodman, DrPH Professor and Program Director Health Care Administration Texas Woman's University 1
  • 2.
     The purposeof the One Voice Collaborative Survey was to evaluate the degree of success of the collaboration process, determine member satisfaction, examine the benefits and drawbacks of participation as perceived by the collaborative members, and gain member feedback.  The survey examined member demographics, members’ perceptions of components of successful collaboration including environment, membership characteristics, process and structure, communication, purpose, and resources, perceived benefits and drawbacks of collaborative, member satisfaction, and member feedback. 2
  • 3.
    Comparison Report: 6years and 3 surveys later – how are we doing? 1. Review of the Survey Structure 2. Who were the respondents? 3. Findings Comparing 3 Successive Surveys – 2008, 2011, 2014 4. Conclusions and Next Steps 3
  • 4.
     The surveystatements were adapted from the Wilder Collaboration Factors Inventory developed by the Amherst H. Wilder Foundation.  The survey (inventory) was developed and tested over a period of eight years. The inventory is designed to help collaboratives and community collaboratives assess their strengths and weaknesses relative to 20 success factors.  Research suggests that these factors can apply to collaborative efforts of nonprofit, governmental and other organizations.  Respondents are asked to rate their level of agreement with 40 different statements ** about the collaborative. 4
  • 5.
    Category (6) CategoryFactory (20) Category Statement (40) • The survey respondents answered statement questions. The statement questions are grouped into 6 categories for analysis. 5
  • 6.
    6 Example ofRank Order Category Factor Statement Environment History of collaboration in the community 5. Agencies in our community have a history of working together. 6. Trying to solve problems through collaboration has been common in this community. It's been done a lot before. Collaborative group seen as a legitimate leader in the community 7. Leaders in this community who are not part of Care for Elders seem hopeful about what we can accomplish. 8. Others (in this community) who are not part of Care for Elders would generally agree that the organizations involved in this partnership are the "right" organizations to make this work. Favorable political and social climate 9. The political and social climate seems to be "right" for a partnership like this one. 14. The time is right for this partnership.
  • 7.
    To simplify analysis,the authors grouped the 40 individual statements into six global categories, which were in turn grouped into 20 success factors:  Categories: 1. Environment 2. Membership Characteristics 3. Process and Structure 4. Communication 5. Purpose 6. Resources 7
  • 8.
     So wehave Categories (6), Factors (20), and individual Statements (40). Analysis can then be done on a macro level, Factors or Categories , or a micro level, Statements.  Respondents were asked to indicate how much they agreed or disagreed with each statement. The rating scale used was as follows: • Strongly agree (5 points) • Agree (4 points) • Neutral (neither agree or disagree) (3 points) • Disagree (2 points) • Strongly disagree (1 point)  For the purpose of this survey, “don’t know” was added as an option to allow respondents to indicate that they had no knowledge on a particular subject rather than a lack of opinion. Since the survey required an answer to each question, this facilitated the completion of the survey. 8
  • 9.
    The survey andour report were divided into six sections as follows: 1. Respondent Information 2. The Collaborative Factors Inventory 3. Benefits and Drawbacks of Participation 4. Satisfaction with Participation 5. Feedback from Partners 9
  • 10.
     The surveywas emailed to collaborative members in February 2014. Members were asked to respond to the survey online.  Survey response rates were as follows: • 2008 - 37% response rate • 2011- 46% response rate • 2014 – 21% response rate  Comment: The mailing list in 2014 has grown to 322 names from perhaps 100 in the previous 2 surveys. How many of the 322 are really active participants in One Voice?  For any survey, however, as response rate of 21% is very good. 10
  • 11.
  • 12.
    12 Table 1A:Summary of Respondent Demographics Type of Participation (Q1: only 1 answer possible 2008 2011 2014 Part of a non-profit organization 80% 74% 69% Part of a governmental agency 17% 11% 18% Other 2% 5% 13%
  • 13.
    13 Table 1A:Summary of Respondent Demographics Sector or Service (Q2: multiple choices were possible) 2008 2011 2014 Mental Health 14% 13% 19% Healthcare 10% 13% 15% Housing 6% 6% 10% Persons with Disabilities 6% 6% 9% Substance Abuse 6% 5% 6% Seniors 9% 7% 6% Transportation 4% 2% 6% Utilities 5% 5% 6% Food 4% 2% 6% Public Education 6% 8% 5% Early Childhood Education 6% 8% 4% Other 10% 7% 10%
  • 14.
    14 Sector orService-Other 2014 Child Welfare (deleted as a category in 2014). Health Assessment, Education & Outreach. We are a non-profit funder. Multi discipline including seniors, health care, mental health, utilities. Veterans. Adult Education. Community based organization - healthcare, seniors, trans, housing, utilities and food.
  • 15.
    15 Table 1B:Participation Level of Participation (Q12: one choice was possible) % 2008 % 2011 % 2014 Less than 2 meetings 19% 13% 22% 2 to 6 meetings 37% 44% 38% 7 to 12 meetings 22% 32% 27% 13 or more meetings 22% 12% 13% Two comments about participation: (1) There was a statistically significant relationship found between a higher level of participation and the answer to the statement “My organization benefits from being involved”. (2) The change over the past several years in participation in 13 or more meetings may be explained by the changing frequency for workgroup and collaborative-wide meetings.
  • 16.
    16 Issue 2011 Weighted Rank 2014 Weighted Rank Availability of appropriate services 292 253 Sustainable funding 311 249 Availability of comprehensive services 286 233 Capacity to deliver needed services 288 231 Accessibility to needed services 286 226 Affordability of services 278 176
  • 17.
    17 Other IssuesNoted The ACA and Ryan White Care Act. What is the impact? We are not a direct service provider so our interests aren't really any of the above. We are more focused on transforming the homeless response system and making sure the supportive laws, funding and other resources are there to integrate the changes into long term practices. Public awareness about our program. Fostering partnership and support from other organizations. Quality of HC. The need for local organizations to continue to collaborate and provide shared services to increase efficiency and comprehensive programming. The mentally ill have special problems as well as special needs that need to be addressed. Co dependency being one. Medication and crisis services before people are danger to self or others. Stopping the cycle of juveniles and adults through the juvenile and criminal justice systems, particularly those with mental health and substance abuse issues. Specialty Health Care Services for low income and Women's Health Care.
  • 18.
    Looking at Statementsand Categories 18
  • 19.
     In the2008 and 2011 surveys, the factors with overall means greater than 4.0 were related to the unique purpose of the collaborative as demonstrated in the mission statement: “…working together to ensure that the health and human service needs of all Texans are addressed in public policy, legislative and regulatory initiatives”.  The previous 2 surveys rated the categories Environment and Purpose as 4.0, excellent. The category Resources had 3 questions, 2 of which consistently had 30% of respondents answer “Don’t Know”. All 3 of these categories were not included in the 2014 survey. 19
  • 20.
     The 2014survey demonstrated continued improvement in Process and Structure, and effectiveness of Communication of the collaborative.  This was suggested by Statement 33, “People in this collaborative have a clear sense of their roles and responsibilities”. • In 2008, no one strongly agreed with this statement. • In 2011, 11% of respondents strongly agreed with this statement. • In 2014, 16% of respondents strongly agreed with the statement. 20
  • 21.
    21 The “bottomline” to the survey was the cumulative score for “Satisfaction With One Voice”. Statement Number of responses Percent of responses Completely satisfied 13 24% Mostly satisfied 31 56% Somewhat satisfied 9 16% A little satisfied 1 2% Not at all satisfied 0 0% Not applicable 1 2%
  • 22.
    Collaborative Factors Results  As a general rule, the instrument developers recommend: • Scores of 4.0 or higher show a strength and probably don’t need special attention • Scores from 3.0 to 3.9 are borderline and should be discussed by the group to see if they deserve attention. • Scores of 2.9 or lower reveal a concern and should be addressed.  The mean scores on the statements ranged from: • 2008: a range of 2.3 to 4.2, average of 3.7 • 2011: a range of 2.4 to 4.5, average of 3.8 • 2014: a range of 2.9 to 4.4, average of 3.8  The differences are slight but interesting. In the 2014 survey, the results reflect a more positive opinion overall. In 2014, 8 items were ranked below the 2008 level. Those differences were typically one-tenth of a point drop. 22
  • 23.
     One itemin the 2014 survey dropped by three-tenths of a point; Category of Communication, Statement 43, asked:  “I personally have informal conversations about One Voice with others who are involved in the collaborative”.  Only 5% of respondents strongly agreed with the statement. The mean of the item fell from 4.2 to 3.8, which is still a strong showing.  Interpretation: Unknown 23
  • 24.
     For the3 surveys, the same 10 statements ranked highest, 3 related to Membership Characteristics (3 of 6, or 50%), 3 to Process and Structure (3 of 13, or 23%), and 4 related to Communication (4 of 5, or 80%).  The highest ranking statements remain consistent through the 3 surveys as shown in the following table. However, rather than a focus on the individual statements, I believe the strengths shown in the Category list most important. 24
  • 25.
    25 Category HighestRanking Statements Mean Score 2008 Mean Score 2011 Mean Score 2014 Membership Characteristics 24. My organization will benefit from being involved in One Voice. 4.2 4.5 4.4 Membership Characteristics 20. I have a lot of respect for the other people involved in this collaborative. 4.3 4.5 4.6 Process and Structure 26. Everyone who is a member of One Voice wants this project to succeed. 4.2 4.3 4.3 Communication 43. I personally have informal conversations about One Voice with others who are involved in the collaborative. 3.9 4.2 3.9 Communication 41. The people who lead this collaborative communicate well with the partners. 4.0 4.2 4.2 Communication 42. Communication among the people in this collaborative happens both at formal meetings and in informal ways. 4.1 4.2 4.2 Process and Structure 35. This collaborative is able to adapt to changing conditions, such as fewer funds than expected, changing political climate or change in leadership. 3.9 4.1 4.0 Membership Characteristics 21. The people involved in One Voice represent a cross section of those who have a stake in what we are trying to accomplish. 4.1 4.1 4.2 Communication 40. I am informed as often as I should be about what goes on in the collaborative. 3.9 4.0 4.0 Process and Structure 36. This group has the ability to survive even if it had to make major changes in its plans or add some new members in order to reach its goals. 4.0 4.0 3.8
  • 26.
    26 Category HighestRanking Statements Mean Score 2008 Mean Score 2011 Mean Score 2014 Membership Characteristics 24. My organization will benefit from being involved in One Voice. 4.2 4.5 4.4 Membership Characteristics 20. I have a lot of respect for the other people involved in this collaborative. 4.3 4.5 4.6 Process and Structure 26. Everyone who is a member of One Voice wants this project to succeed. 4.2 4.3 4.3 Communication 43. I personally have informal conversations about One Voice with others who are involved in the collaborative. 3.9 4.2 3.9 Communication 41. The people who lead this collaborative communicate well with the partners. 4.0 4.2 4.2 Top 5
  • 27.
    27 Communication 42.Communication among the people in this collaborative happens both at formal meetings and in informal ways. 4.1 4.2 4.2 Process and Structure 35. This collaborative is able to adapt to changing conditions, such as fewer funds than expected, changing political climate or change in leadership. 3.9 4.1 4.0 Membership Characteristics 21. The people involved in One Voice represent a cross section of those who have a stake in what we are trying to accomplish. 4.1 4.1 4.2 Communication 40. I am informed as often as I should be about what goes on in the collaborative. 3.9 4.0 4.0 Process and Structure 36. This group has the ability to survive even if it had to make major changes in its plans or add some new members in order to reach its goals. 4.0 4.0 3.8 Next 5
  • 28.
    28 Category LowestRanking Statements Average 3 survey score Average % Don’t Know Process and Structure 29. Each of the people who participate in decisions in One Voice can speak for the entire organization they represent, not just a part. 3.2 29% Process and Structure 38. We are currently able to keep up with the work necessary to coordinate all the people, organizations, and activities related to One Voice. 3.5 22% Membership Characteristics 22. All the organizations that we need to be members of this collaborative have become members of the group. 2.9 21% Process and Structure 33. People in this collaborative have a clear sense of their roles and responsibilities. 3.6 18% Lowest Ranking Categories Statement 22, “All the organizations that we need to be members of this collaborative have become members of the group”, increased positively more than any other statement, an increase of 0.5 to a mean of 2.9.
  • 29.
    29 Table 7:Benefits of Participation ranked according to frequency selected (respondents could select more than one option) (ranked high to low) Benefits 2014 % of Partners Experiencing Benefit Acquired useful knowledge about services, programs, or people 86% Enhanced ability to address an important issue 62% Developed valuable relationships 66% Provided ability to have a greater impact than I/we 53% could have had on my/our own Enhanced ability to affect public policy 55% Enhanced ability to make contribution to the 51% community Heightened public profile 40% Increased utilization of our expertise or services 29% Enhanced ability to meet the needs of our 27% constituents or clients Developed new skills 26% Acquired additional financial support 9% None of the above 4%
  • 30.
    30 Table 8:Drawbacks of Collaborative: (could select more than one option) (ranked low to high by 2014 ranking) Choice #/Drawbacks 2008% of Partners Experiencing a Drawback 2011% of Partners Experiencing a Drawback 2014% of Partners Experiencing a Drawback Choice 3. Viewed negatively due to association with other partners or the collaborative 17% (n=6) 0% (n=0) 2%(n=1) Choice 5. Received insufficient credit for contributing to the accomplishments of the collaborative 3% (n=1) 0% (n=0) 4% (n=2) Choice 6. Created conflict between my job and the collaborative’s work 6% (n=2) 4% (n=1) 2% (n=1) Choice 2. Wielded insufficient influence in collaborative activities 6% (n=2) 13% (n=3) 7% (n=4) Choice 4. Resulted in frustration or aggravation 11% (n=4) 30% (n=7) 9% (n=5) Choice 1. Diverted time and resources away from other priorities 57% (n=20) 52% (n=12) 16% (n=9)
  • 31.
  • 32.
    32 Statement Table9: Satisfaction Means by Statement How satisfied are you with the way the people and organizations in One Voice work together? (1 is excellent, 5 is poor) How satisfied are you with your influence in the collaborative? How satisfied are you with your role in the collaborativ e? How satisfied are you with the collaborative’s plans for achieving its goals? How satisfied are you with the way the collaborative is implementing its plans? 2008 Statement Mean 2.2 2.2 2.3 2.2 2.1 2011 Statement Mean 2.1 2.2 2.2 2.0 2.0 2014 Statement Mean 2.0 2.5 2.5 Not included 2.2
  • 33.
    A recommendation followingthe 2008 survey was that there should be a well-planned response to the feedback provided by the responding partners. This was seen as having the potential to help the collaborative move to a higher level of collaboration. We suggested that the collaborative administer the collaborative inventory on an annual basis, or as needed, to provide on-going feedback on the status of the organization’s functioning. 33
  • 34.
    The leadership ofOne Voice has done exactly as recommended. A survey specific to the functioning of the work groups was conducted in 2009. The follow-up collaborative survey was initiated in 2011. The 2011 survey provided outcome measures of the effectiveness of the organizational and executive-level changes implemented in 2008 and 2009. 34
  • 35.
     As notedin the previous surveys, the scores on the Collaboration Factors Inventory are not an absolute reflection of the collaborative’s ability to work effectively. There is no critical value on each factor to ensure success. As suggested earlier, scores of 4.0 or higher probably indicate strength on a factor (factor as opposed to a category). Scores from 3.0 to 3.9 ought to prompt some discussion to determine if the collaborative needs to devote attention to them.  Based on the category results, with a mean of 4.0 being excellent, we find the following: 35
  • 36.
    36 Category Finding Membership Characteristics Appropriate cross-section of members Mutual respect, understanding and trust 3 survey mean of 3.9; median of 4.2.  Only 1 of the responses fell below 3.0. Statement 22 had a mean of 2.9 – “All of the organizations that we need to be members of this collaborative have become members of the group”. And, as noted, this statement increased positively more than any other statement, an increase of 0.5 to a mean of 2.9, with 21% answering “Don’t Know”.  Without Statement 22, the mean is 4.15.  The median is the more accurate rating for this category.  Possible focus area, Statement 19 – “People involved in our collaborative always trust one another”. Four responded as strongly disagree, 10 responded as disagree with the statement. The outcome improved from earlier surveys with a 3 survey average of 3.5. However, only 10% responded as “Don’t Know” over the 3 surveys.
  • 37.
    37 Category Finding Process and Structure Multiple layers of decision making Members share a stake in both process and outcomes 3 survey mean of 3.7, median of 3.9.  The category is large, 16 statements. 1 statement was below 3.5, Statement 29 – “Each of the people who participate in decisions in One Voice can speak for the entire organization they represent, not just a part”. Over 3 surveys, 29% answered “Don’t Know”. The statement answers reflect a normal lack of information about member organizations in a large collaborative such as One Voice.  Statement 31 – “The organizations that belong to One Voice invest the right amount of time in our collaborative efforts”, is similar. 3 survey mean of 3.4, but 23% of respondents answered “Don’t Know”.  The Median is the more accurate score.  No specific intervention is indicated.
  • 38.
    38 Category Finding Communication Open and frequent communication Established informal relationships and communication links 3 survey mean of 3.8, median of 4.0.  For the 3 survey average, 4 of 5 statements ranked 4.0 or higher.  One statement ranked below 4.0, Statement 39 - “People in this collaborative communicate openly with one another”. The score on this response over 3 surveys has averaged 3.8. Average answering “Don’t Know” for the 3 surveys is 12%. Without this statement, the overall mean score is 4.1.  The median is a more accurate measure than the mean.  An area to watch is reflected by the one item in the 2014 survey that dropped by three-tenths of a point, Statement 43 - “I personally have informal conversations about One Voice with others who are involved in the collaborative”. Only 5% of respondents strongly agreed with the statement. The mean of the item fell from 4.2 to 3.8. The 3 survey average was 4.0, with 2% answering “Don’t Know”.  However, Statement 39, above, with only 12% answering “Don’t Know”, may also be an area for additional study.
  • 39.
    39 Table 11:Drawbacks to Participation (reference Table 8) Comment 2008 Survey 2011 Survey 2014 Survey Choice 2. Wielded insufficient influence in collaborative activities 6% (n=2) 13% (n=3) 7% (n=4) Choice 4. Resulted in frustration or aggravation 11% (n=4) 30% (n=7) 9% (n=5) Choice 1. Diverted time and resources away from other priorities 57% (n=20) 52% (n=12) 16% (n=9) The drop in negative comments on Choice 1, diverted time, is important and reflects the change in meeting format and frequency. Also possibly the better organization of the workgroups.
  • 40.
    “I am verydismayed that all issues pertaining to seniors in our community are being ignored while it seems that all efforts and all committees and workgroups are being focused on the issues of children. While the issues of children are important, I am very disappointed at this ongoing development”. 40
  • 41.
     It isperhaps worth the time to track and report by service sector (Table 1A) the primary activities of the collaborative, noting how well the collaborative activities match (and don’t match) member’s service sectors. • If growth is important, do we need to be more inclusive? Bottom line, we have the data to make that determination. 41
  • 42.
    42 Table 1A:Summary of Respondent Demographics Sector or Service (Q2: multiple choices were possible) 2008 2011 2014 Mental Health 14% 13% 19% Healthcare 10% 13% 15% Housing 6% 6% 10% Persons with Disabilities 6% 6% 9% Substance Abuse 6% 5% 6% Seniors 9% 7% 6% Transportation 4% 2% 6% Utilities 5% 5% 6% Food 4% 2% 6% Public Education 6% 8% 5% Early Childhood Education 6% 8% 4% Other 10% 7% 10%
  • 43.
    • Plan toresurvey the workgroups based on the legislative agenda submitted in 2016. • Consider, as a research agenda, why some issues succeed as regards a place on the legislative agenda, and some do not succeed? 43