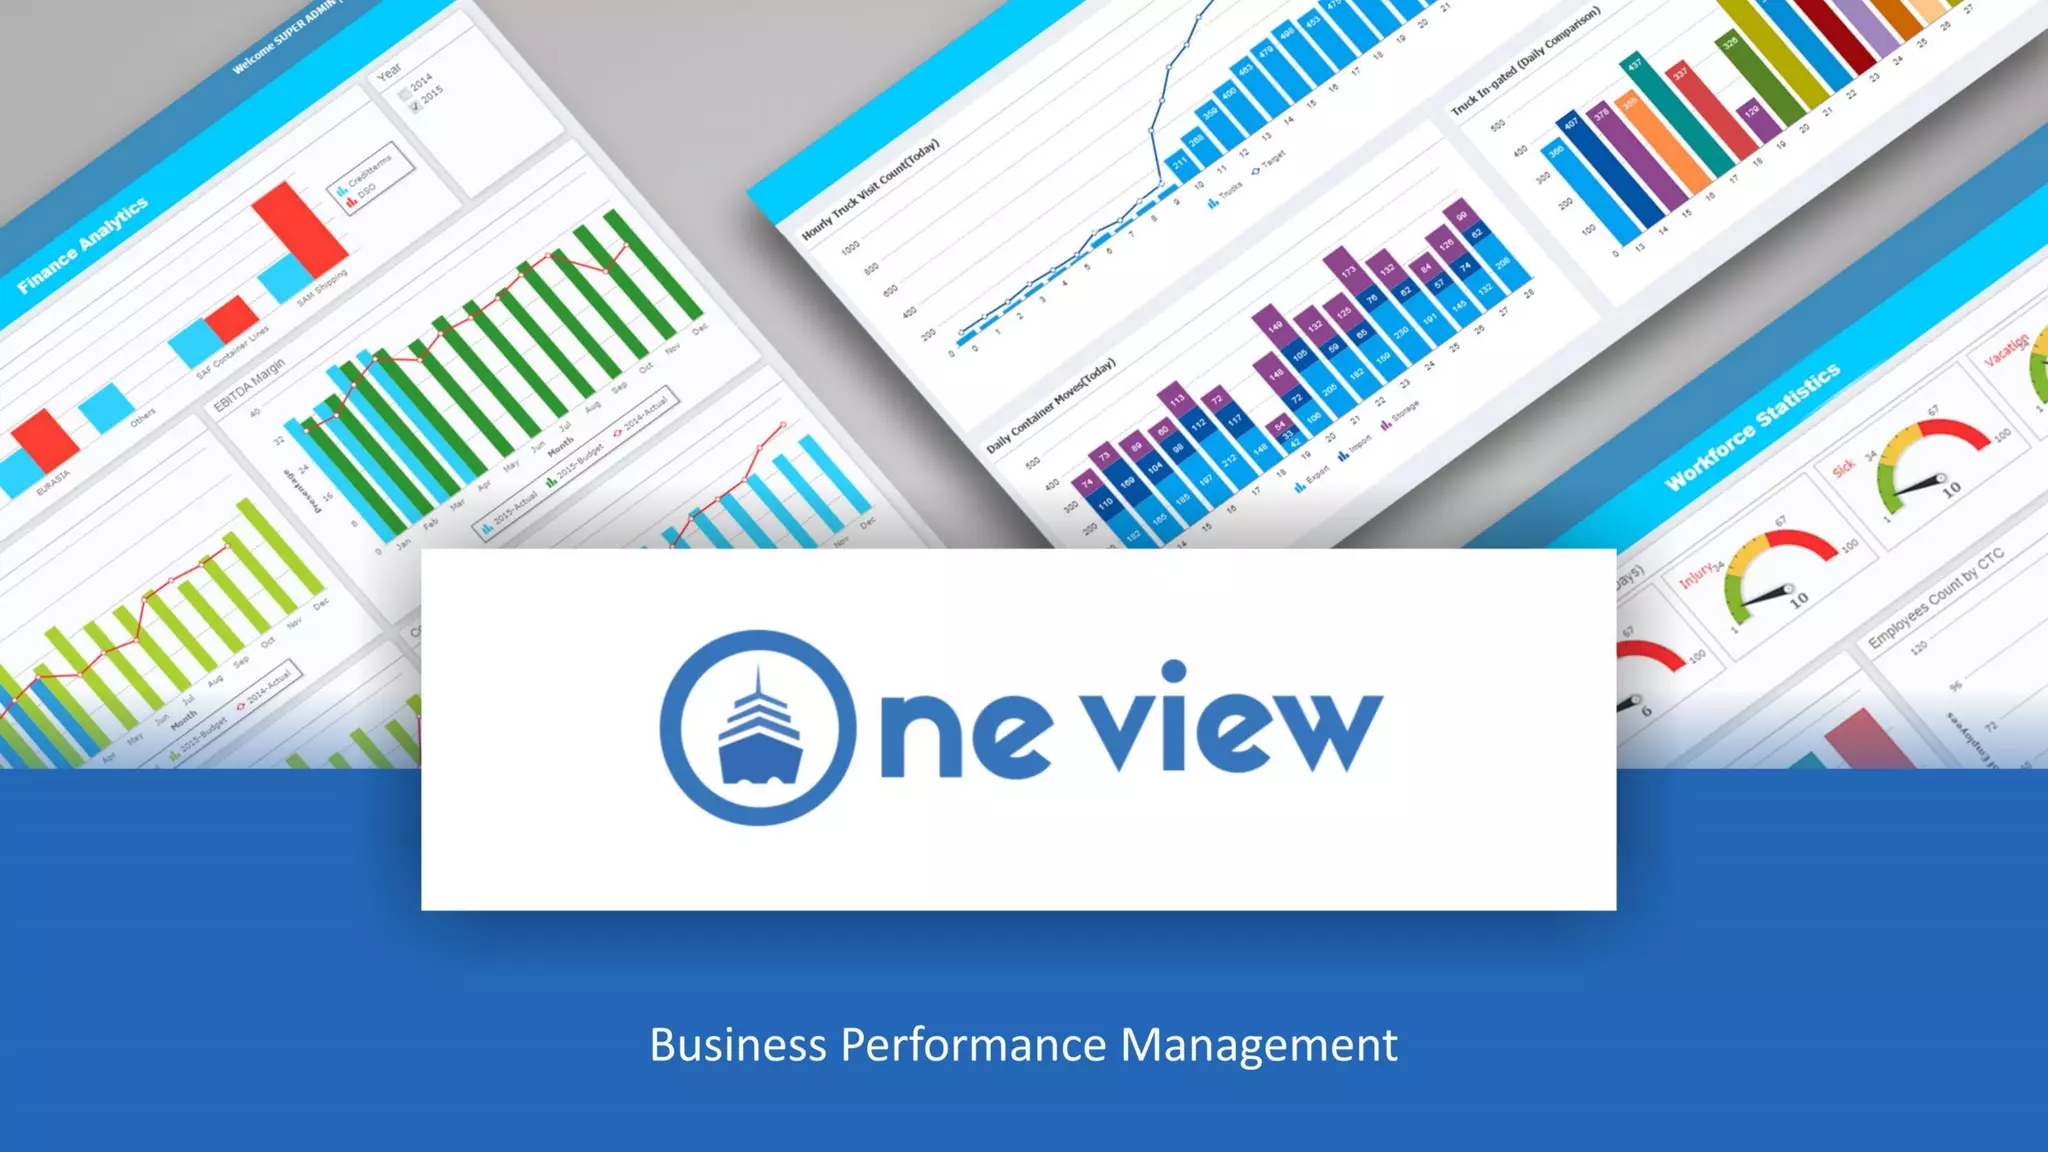
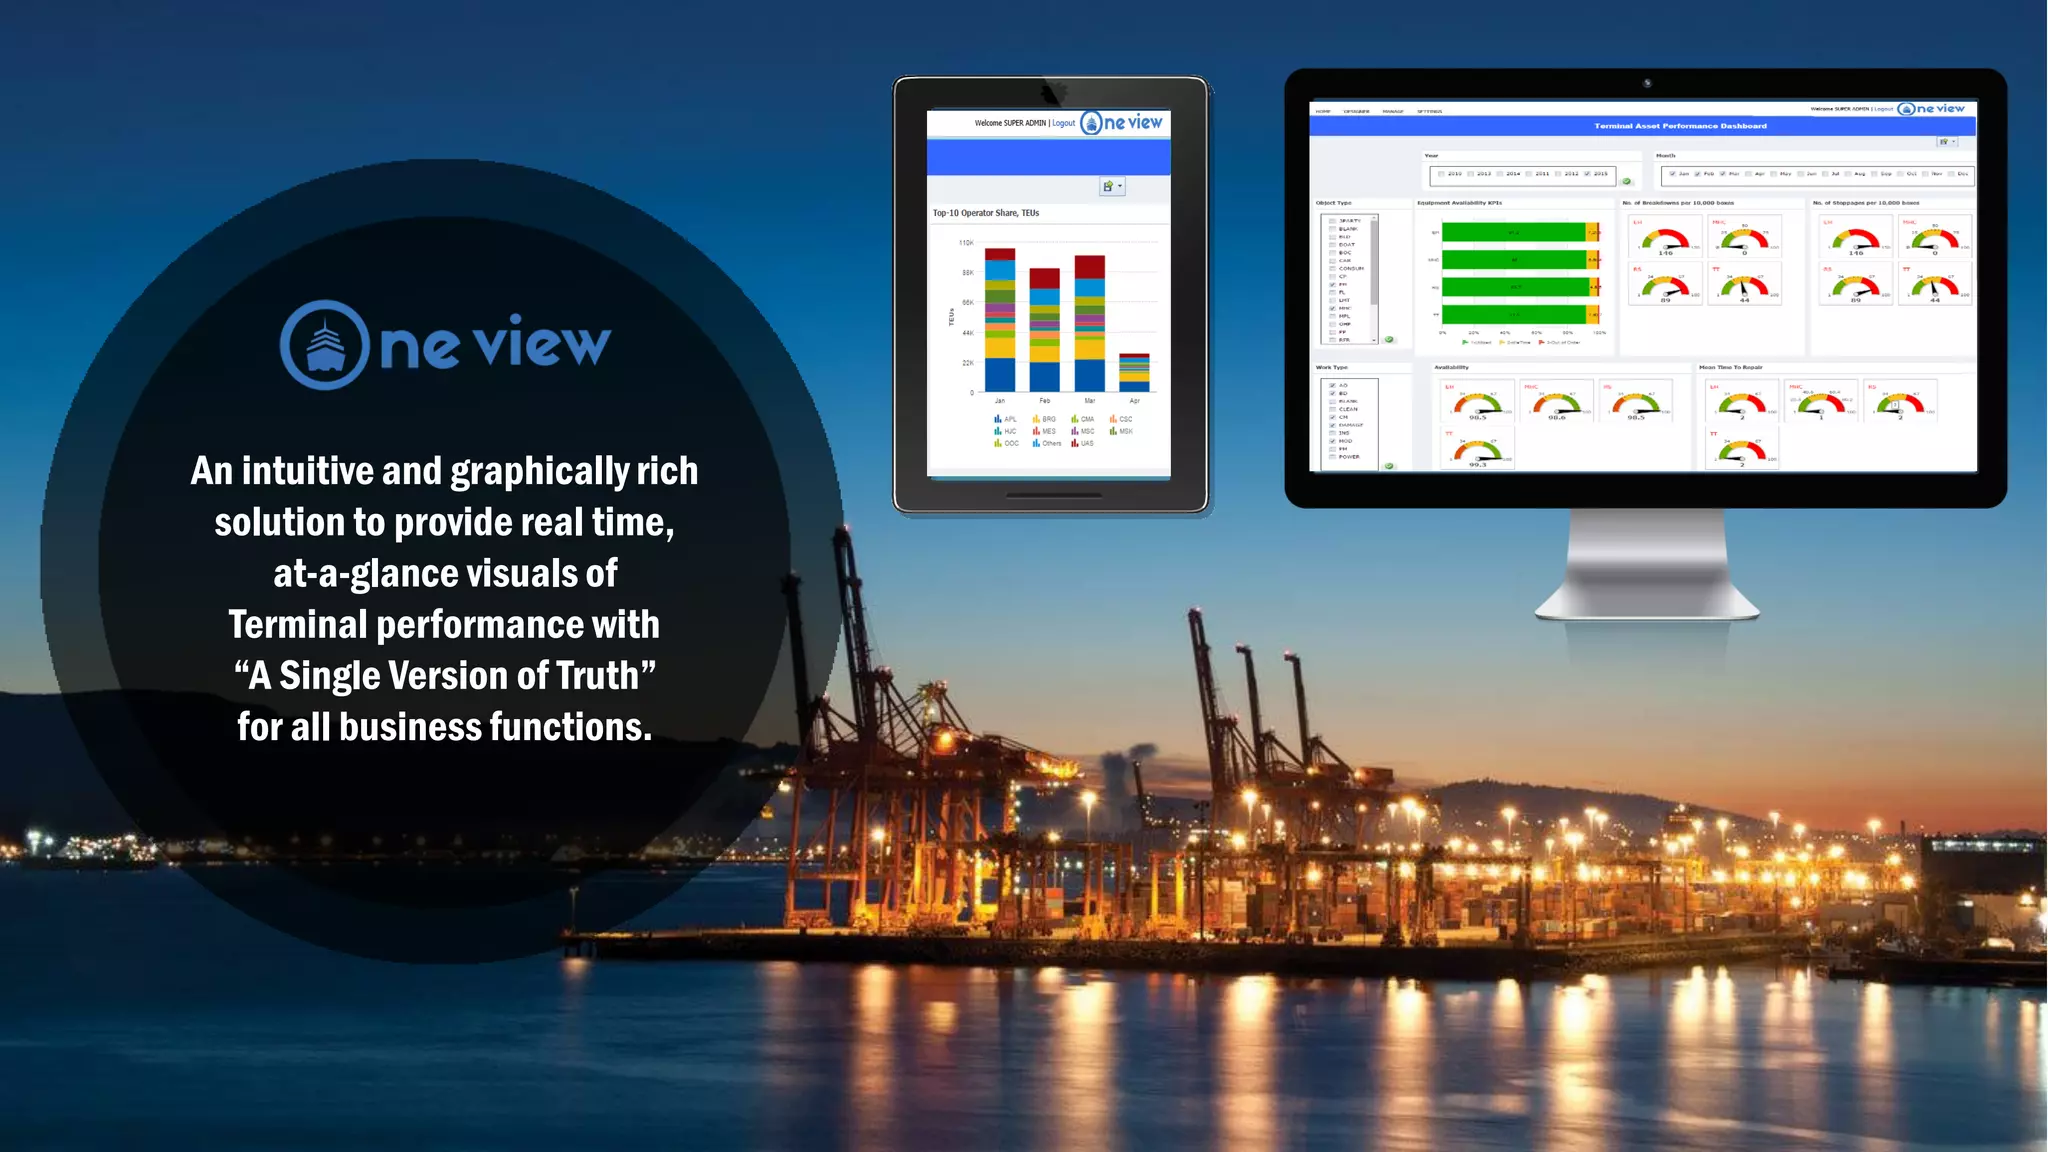
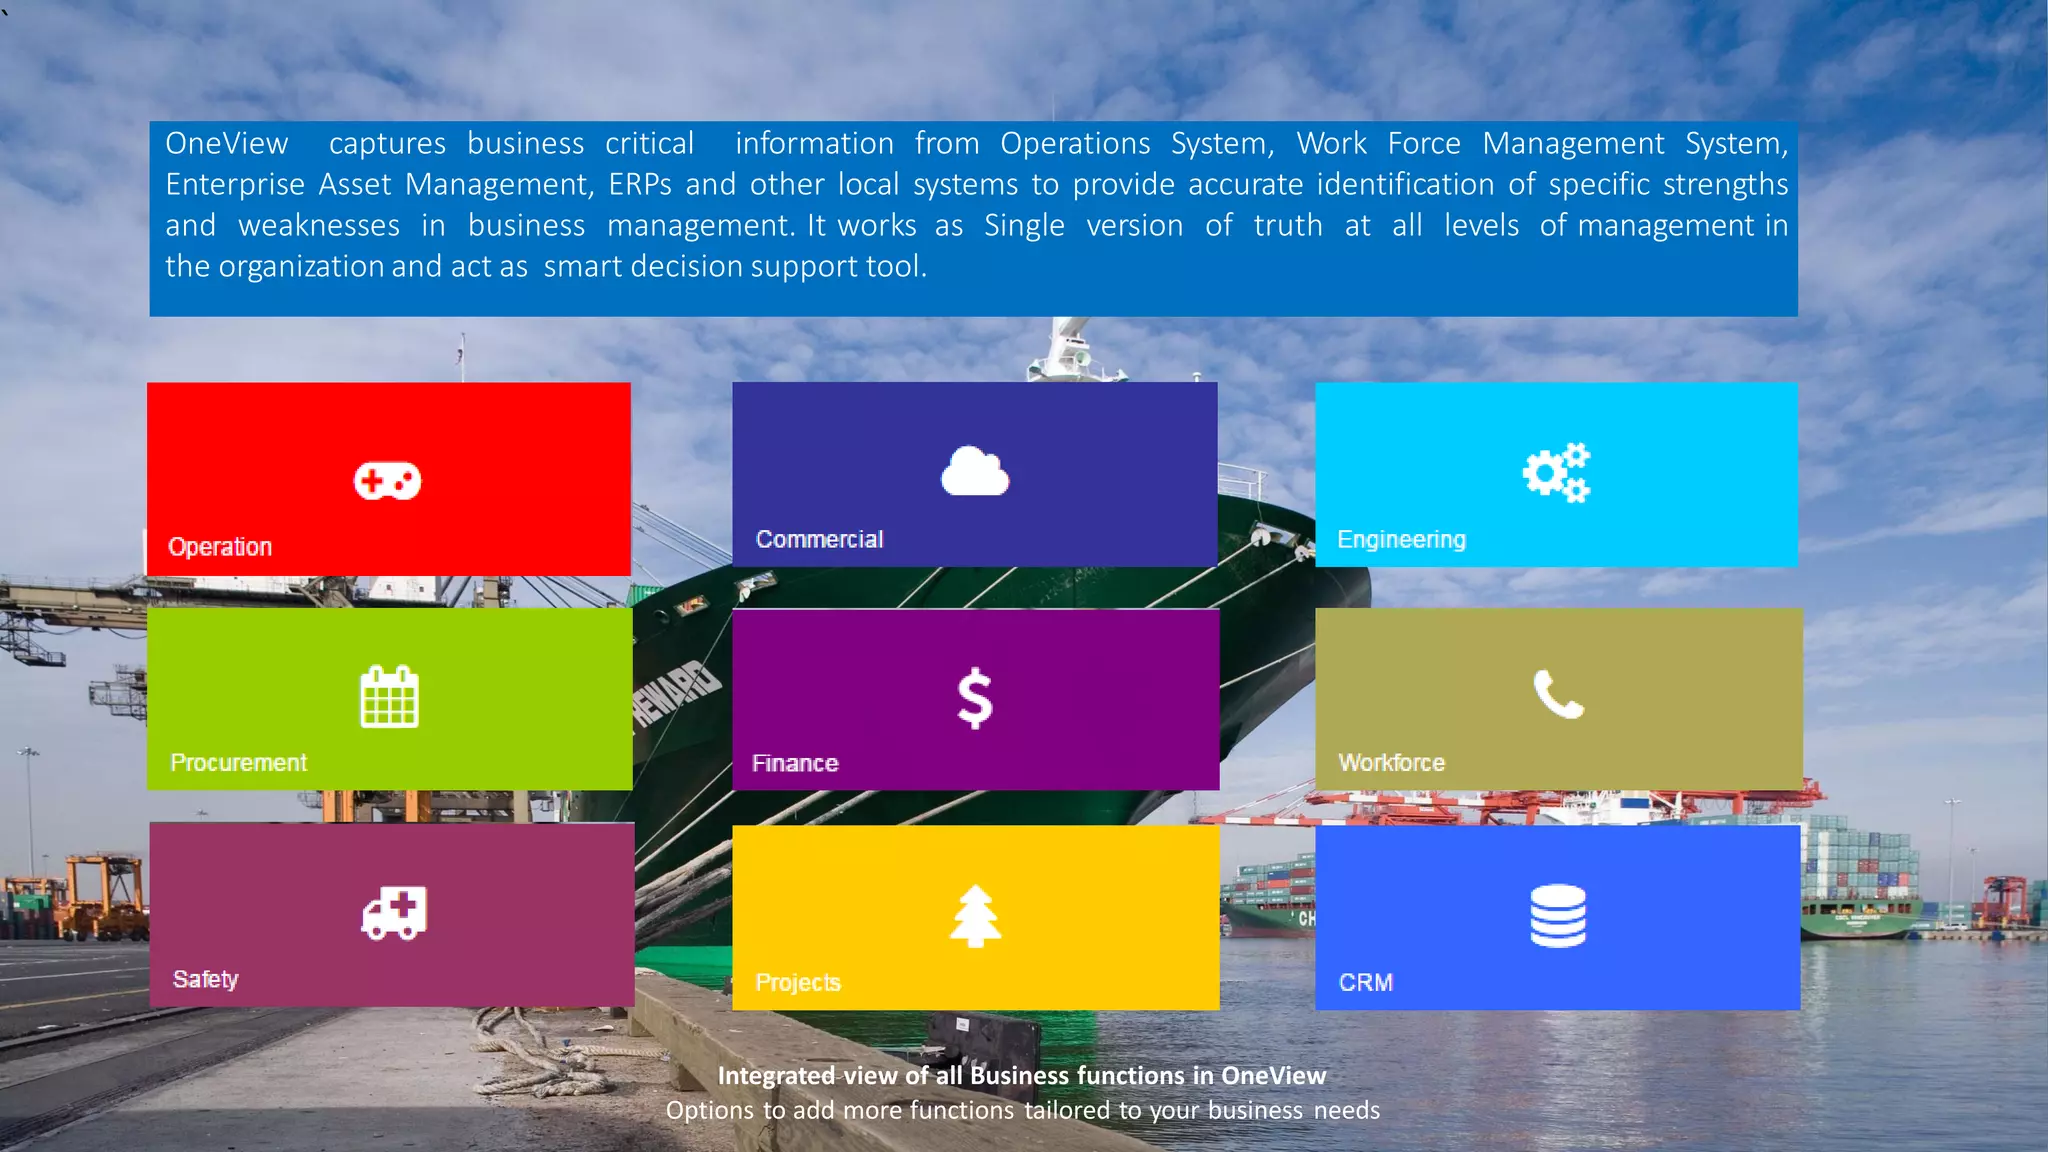
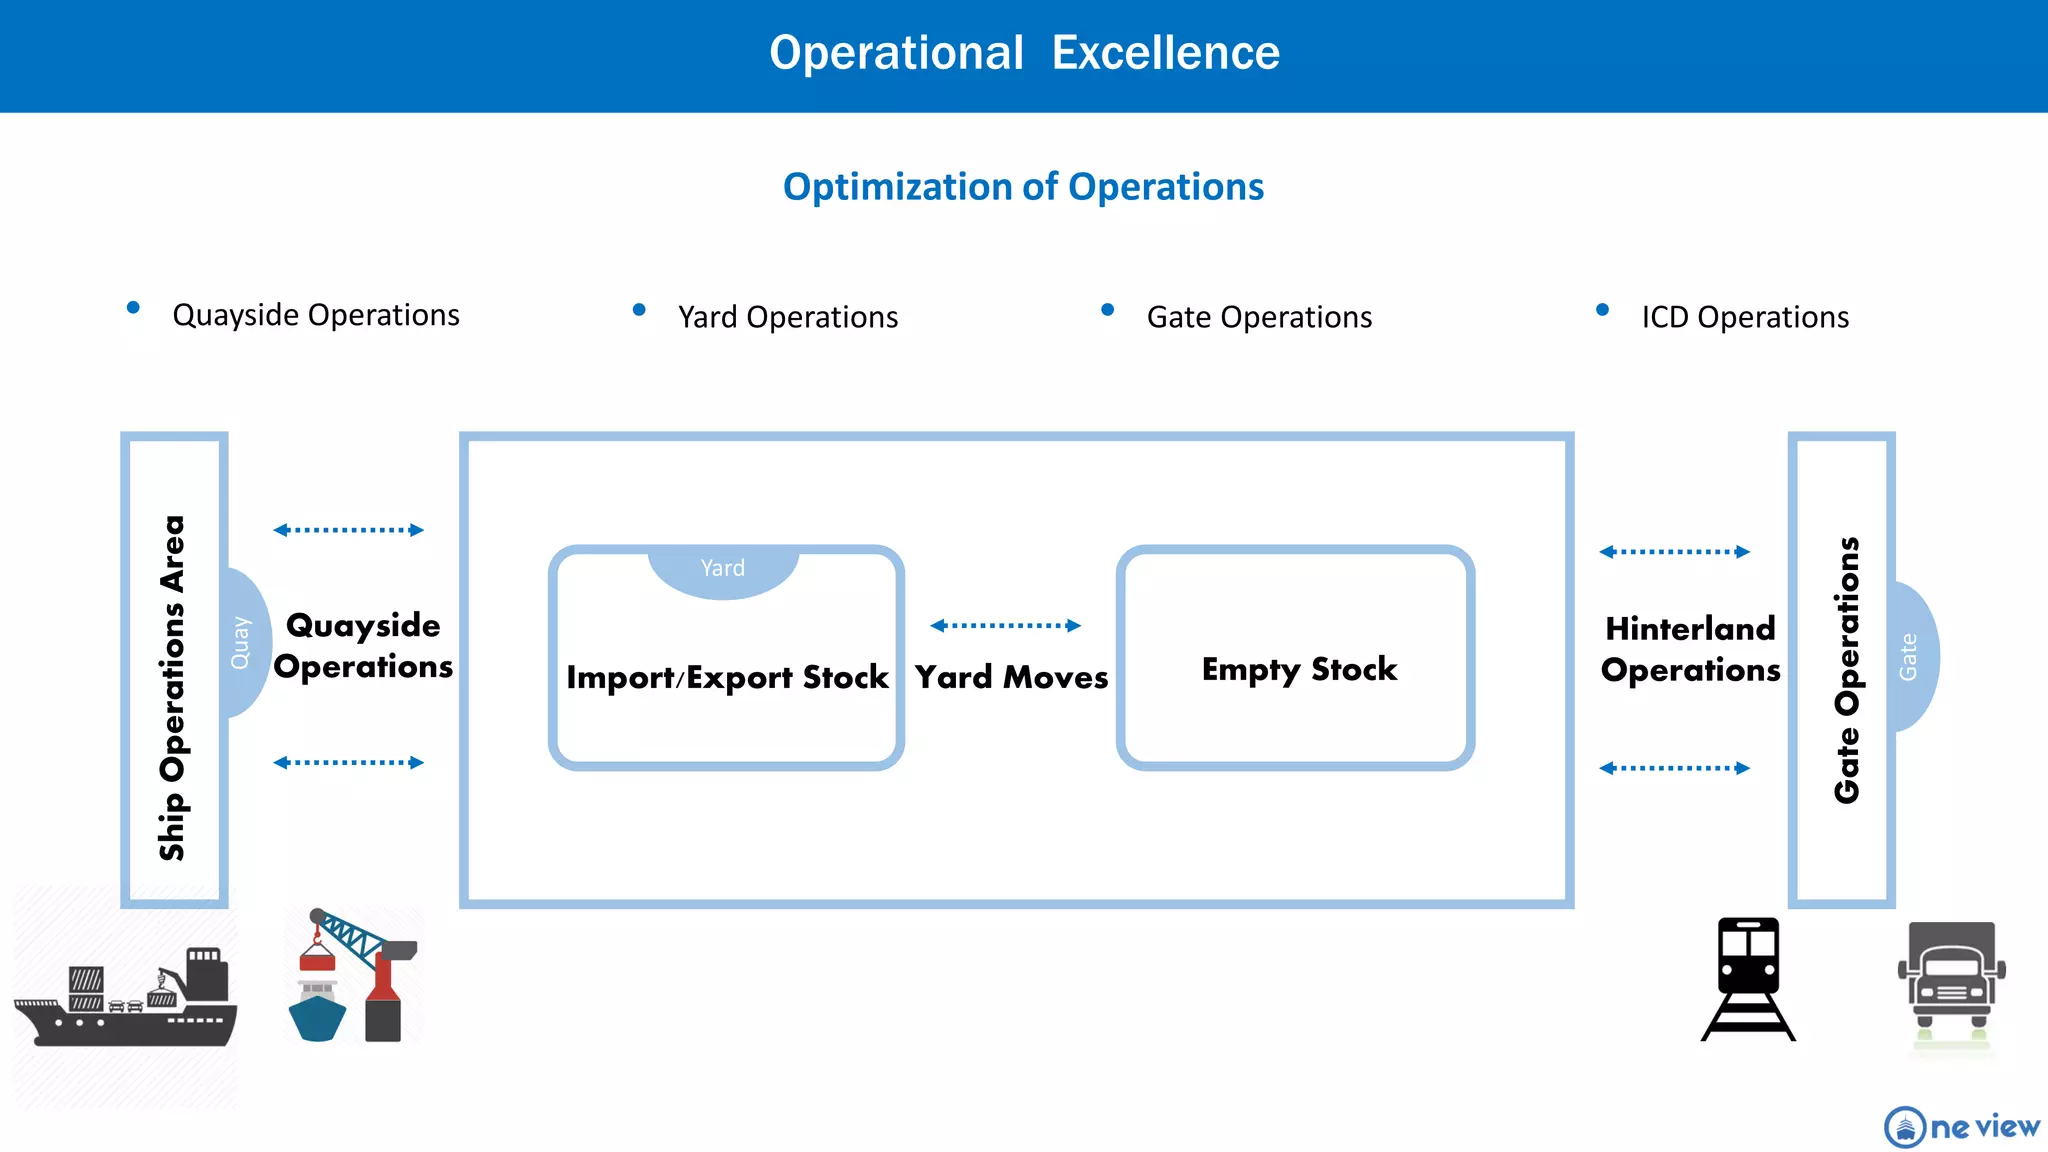
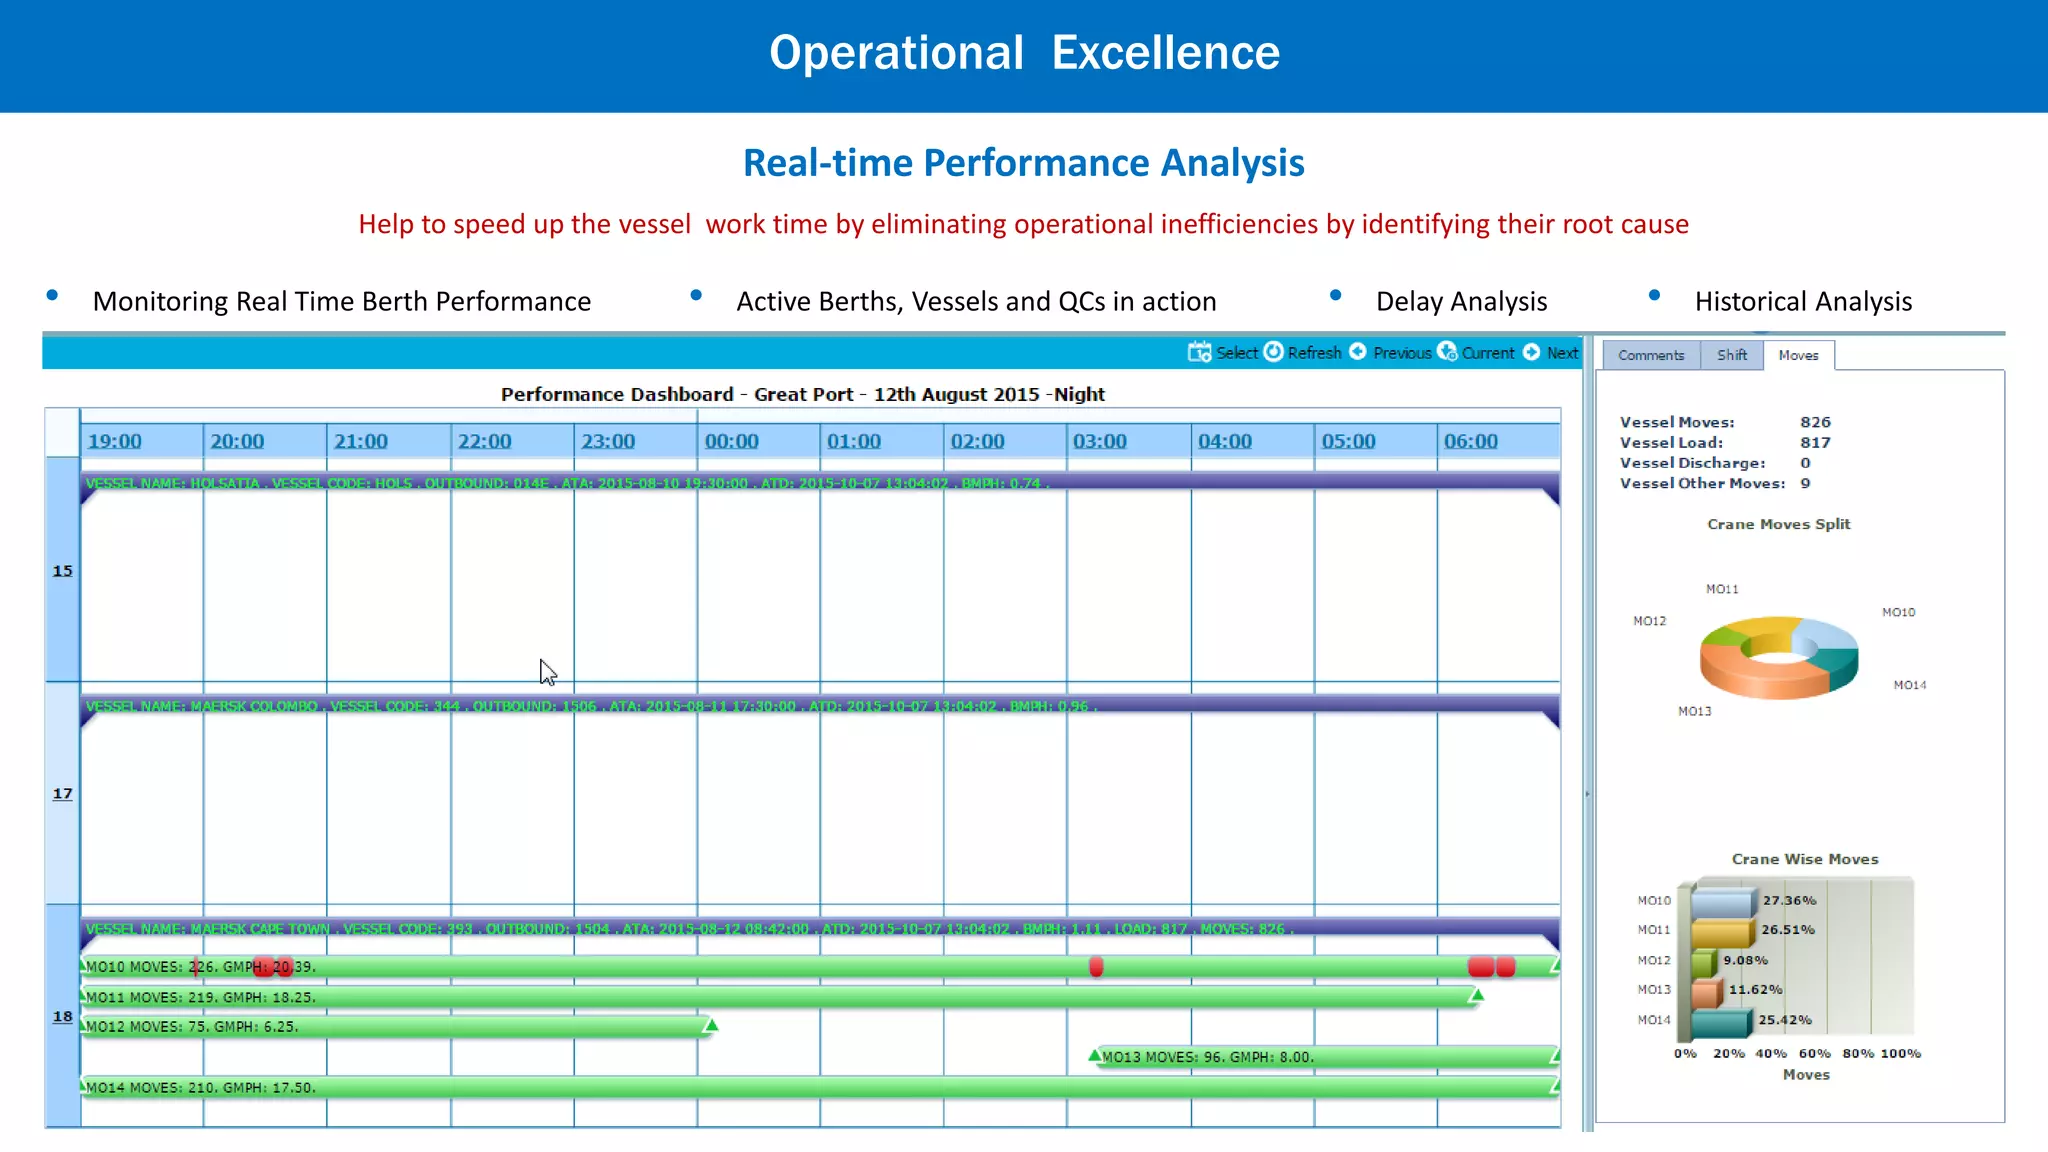
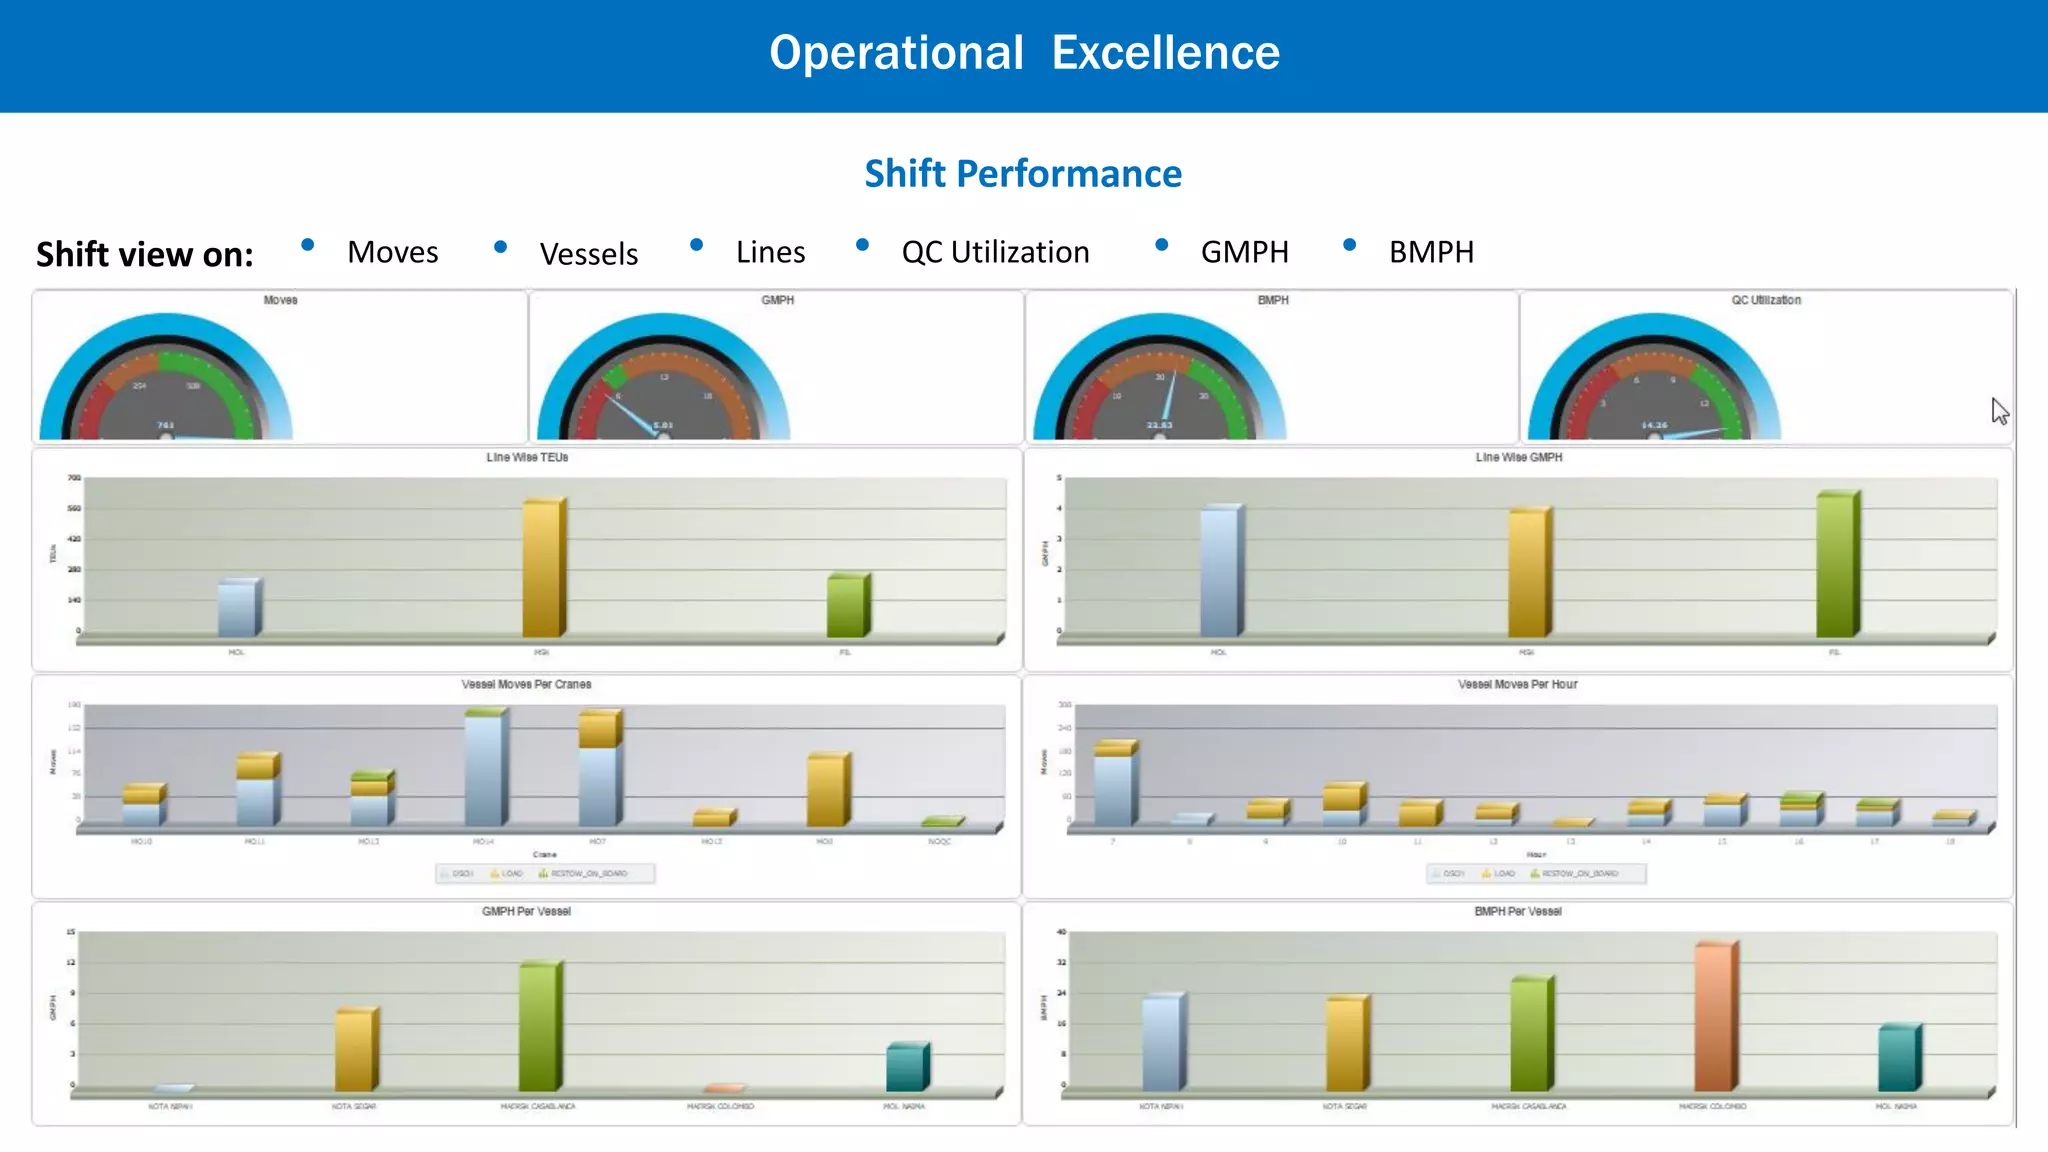
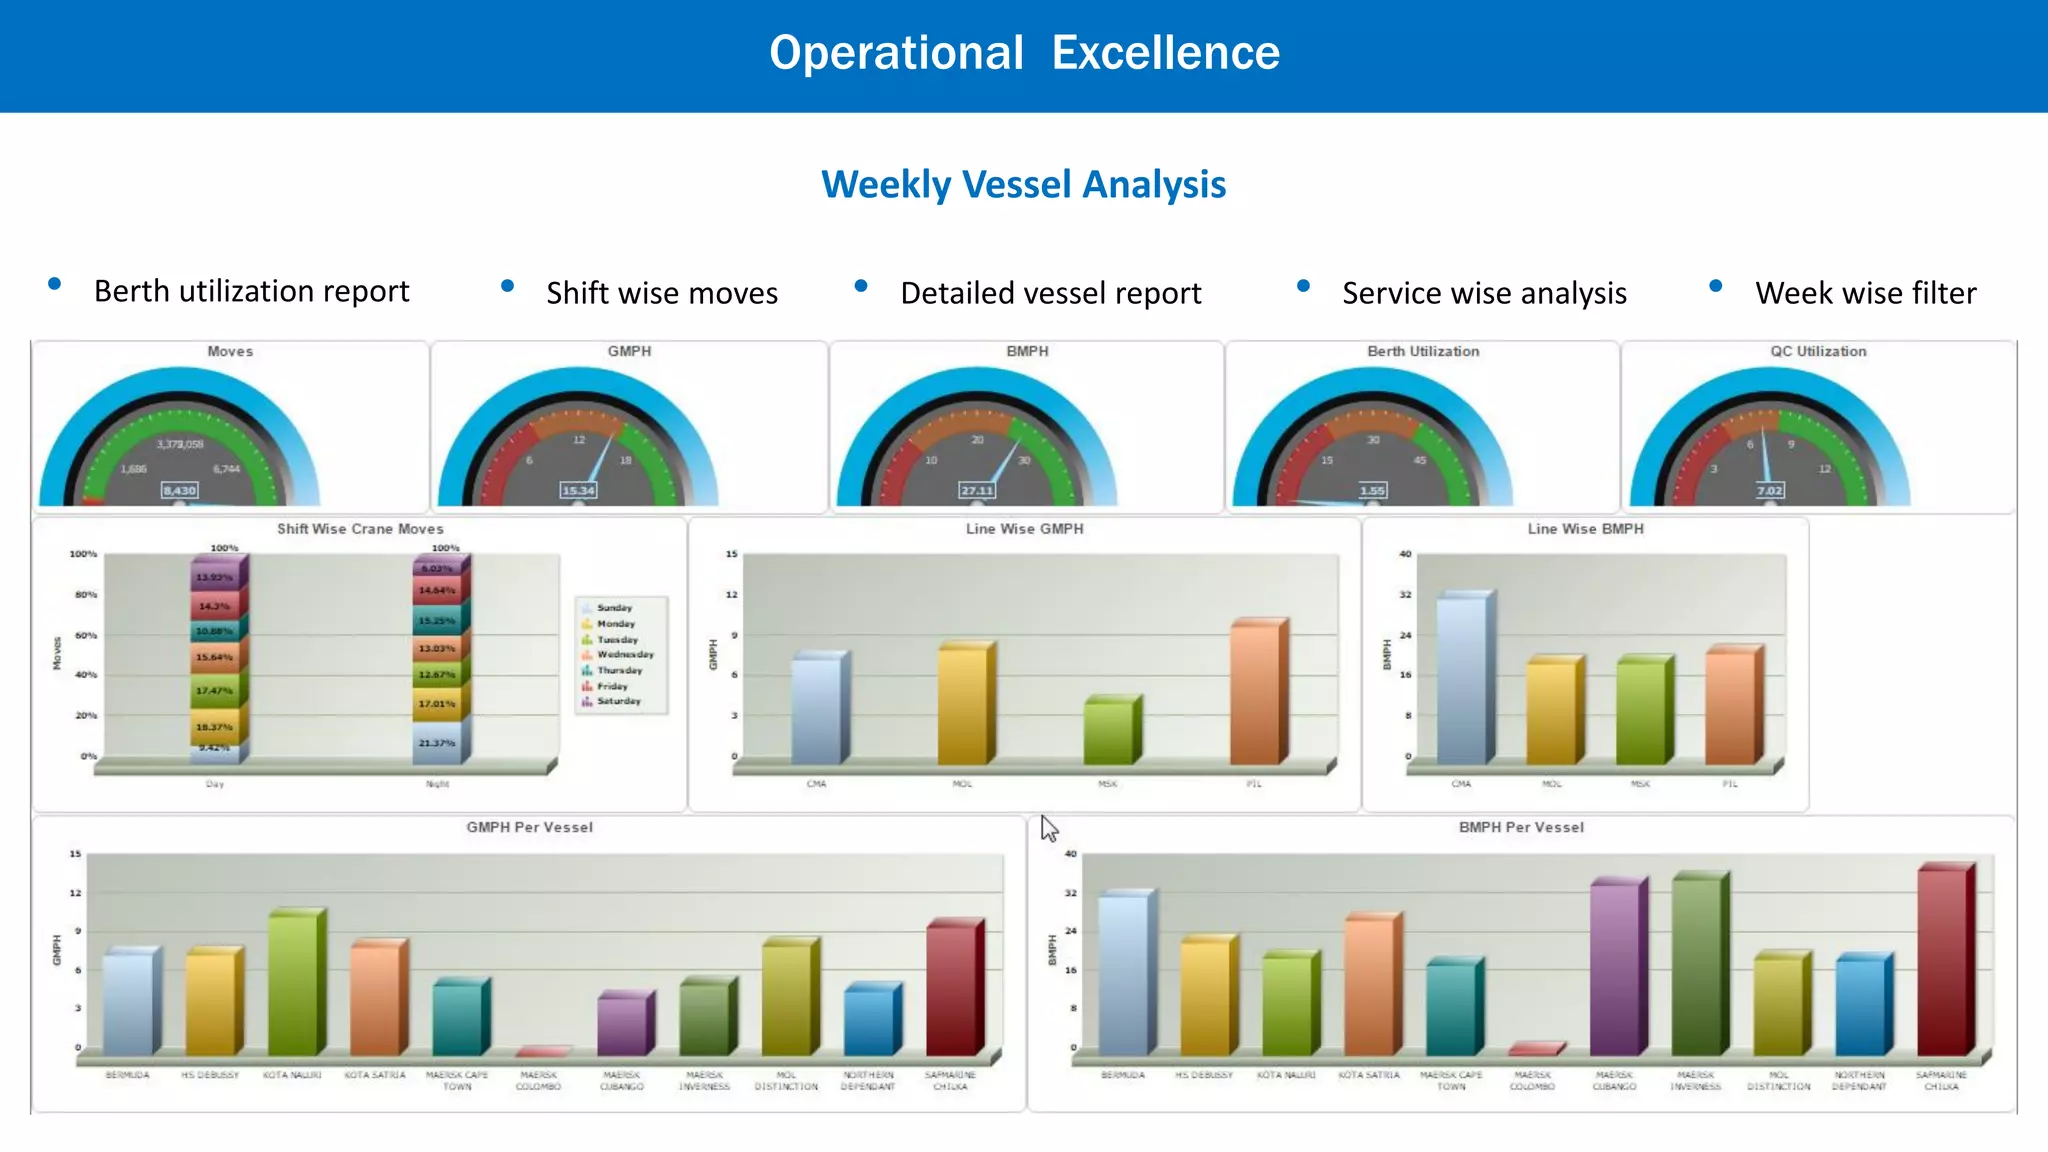
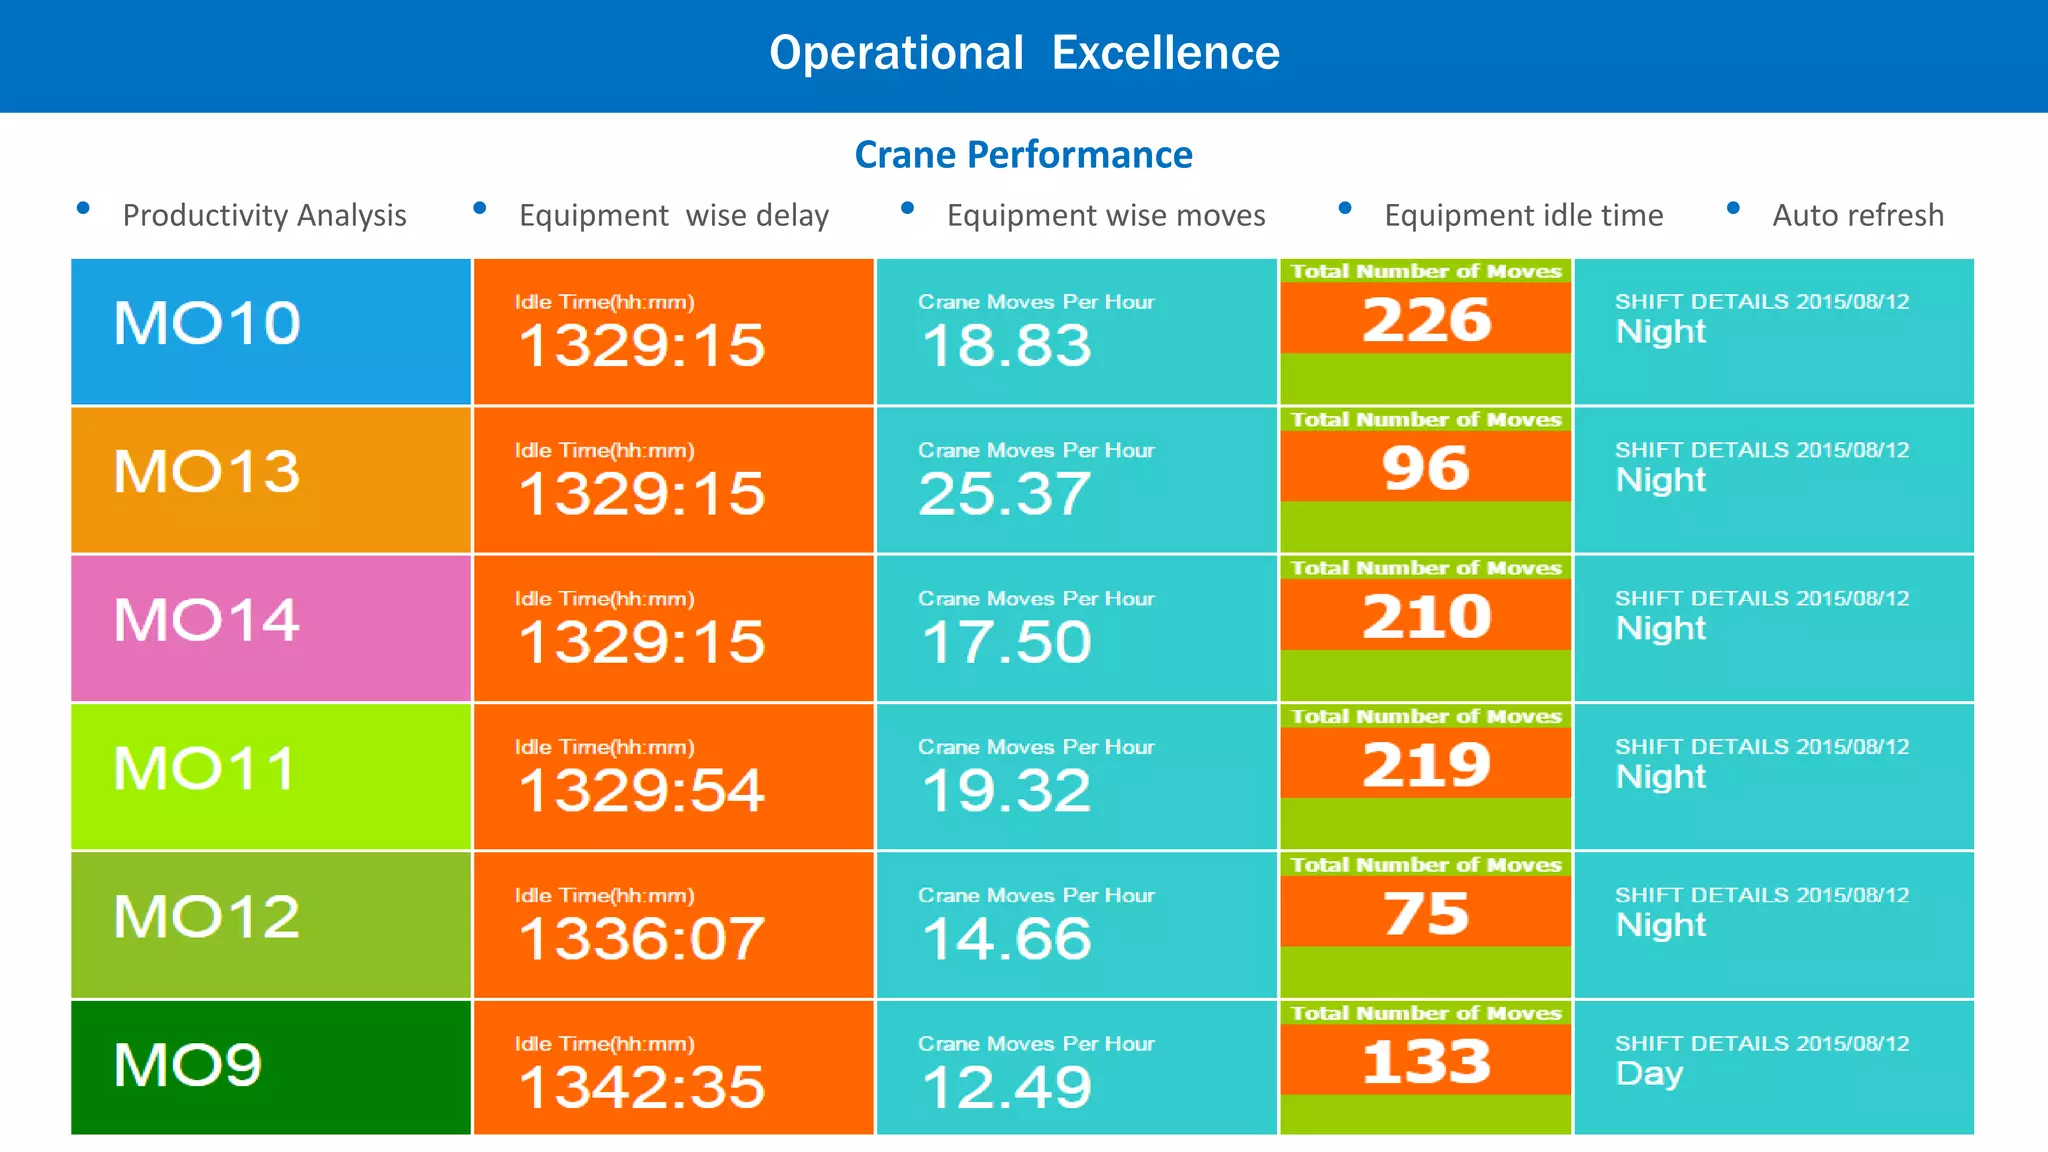
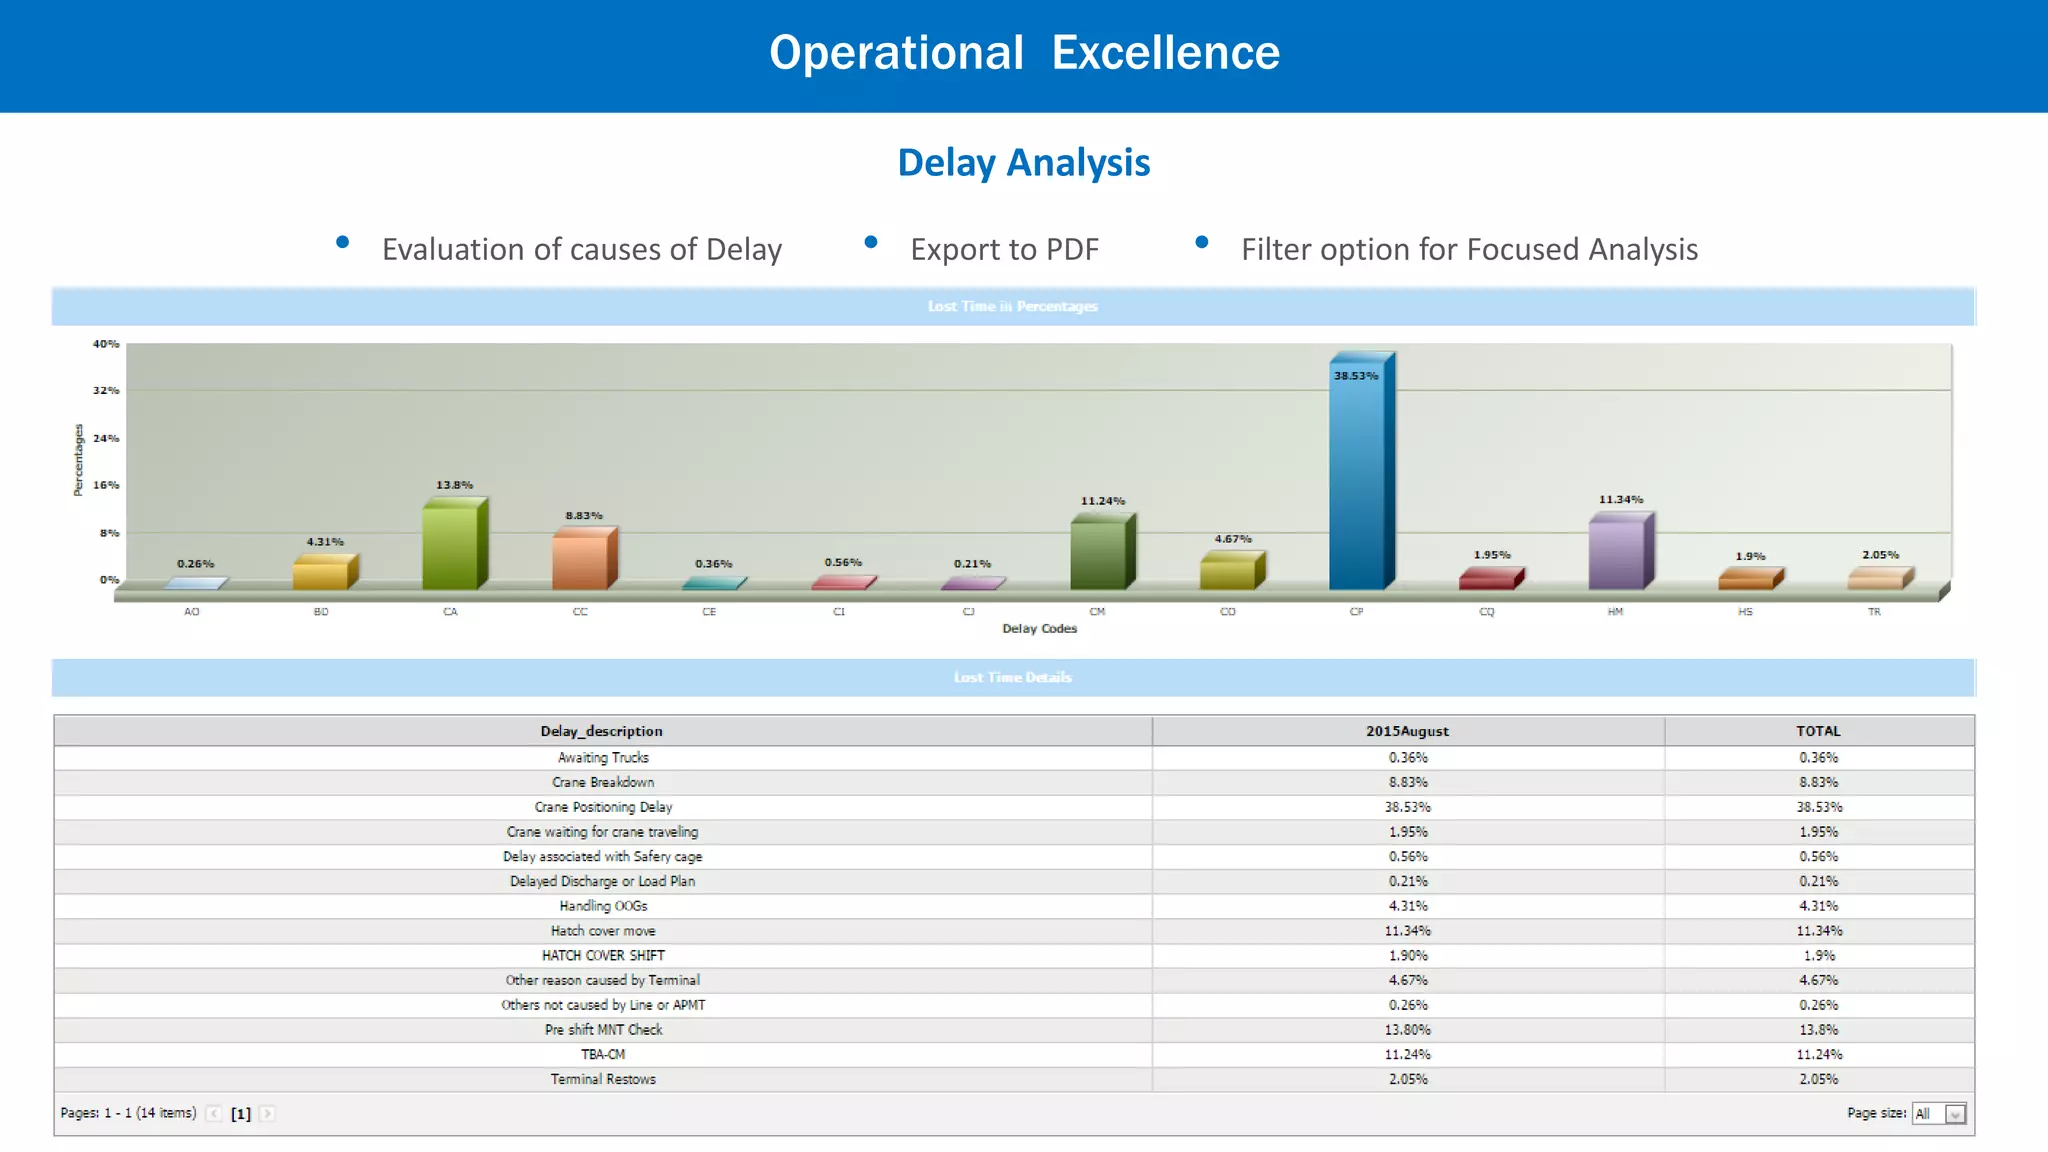
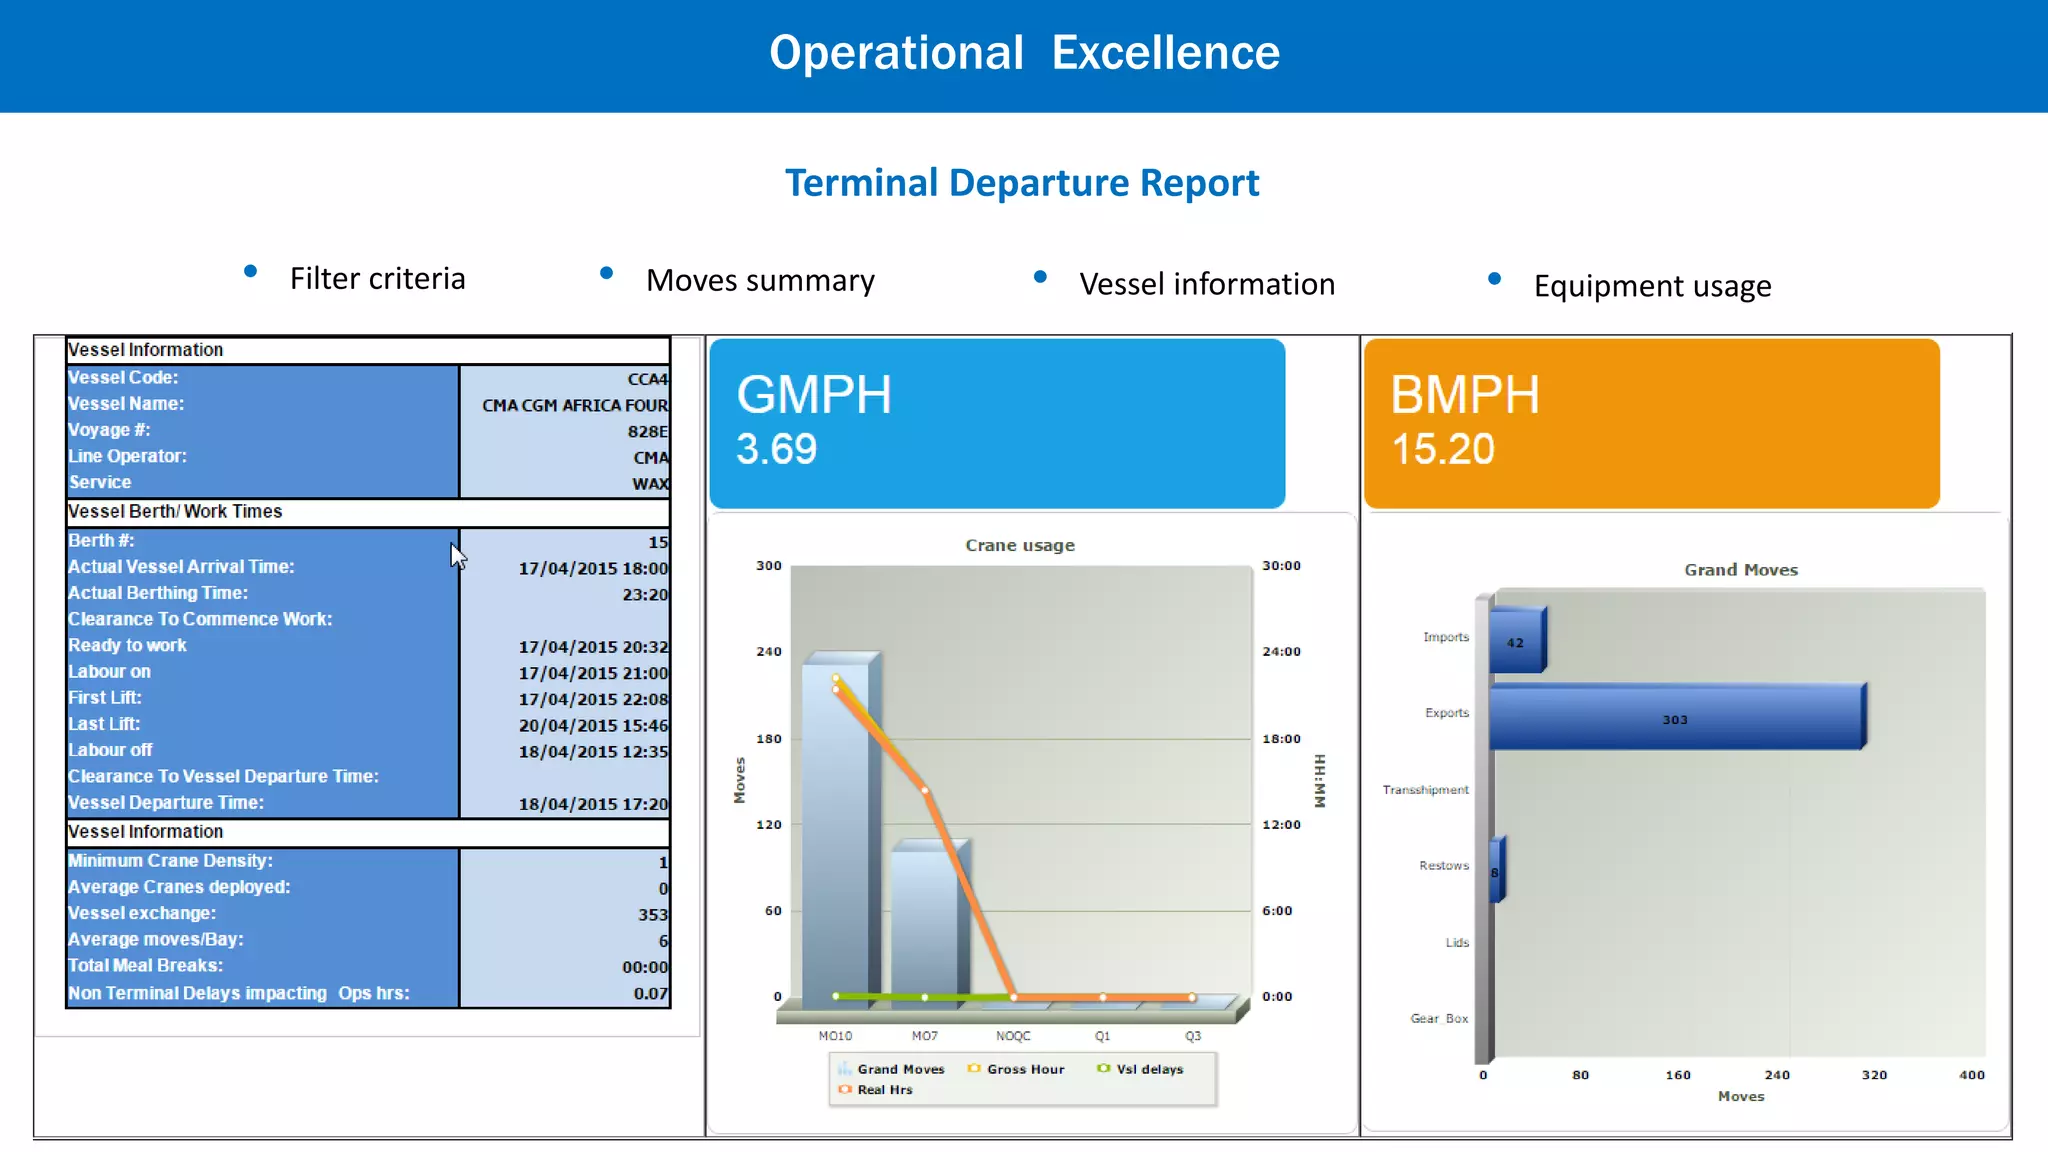
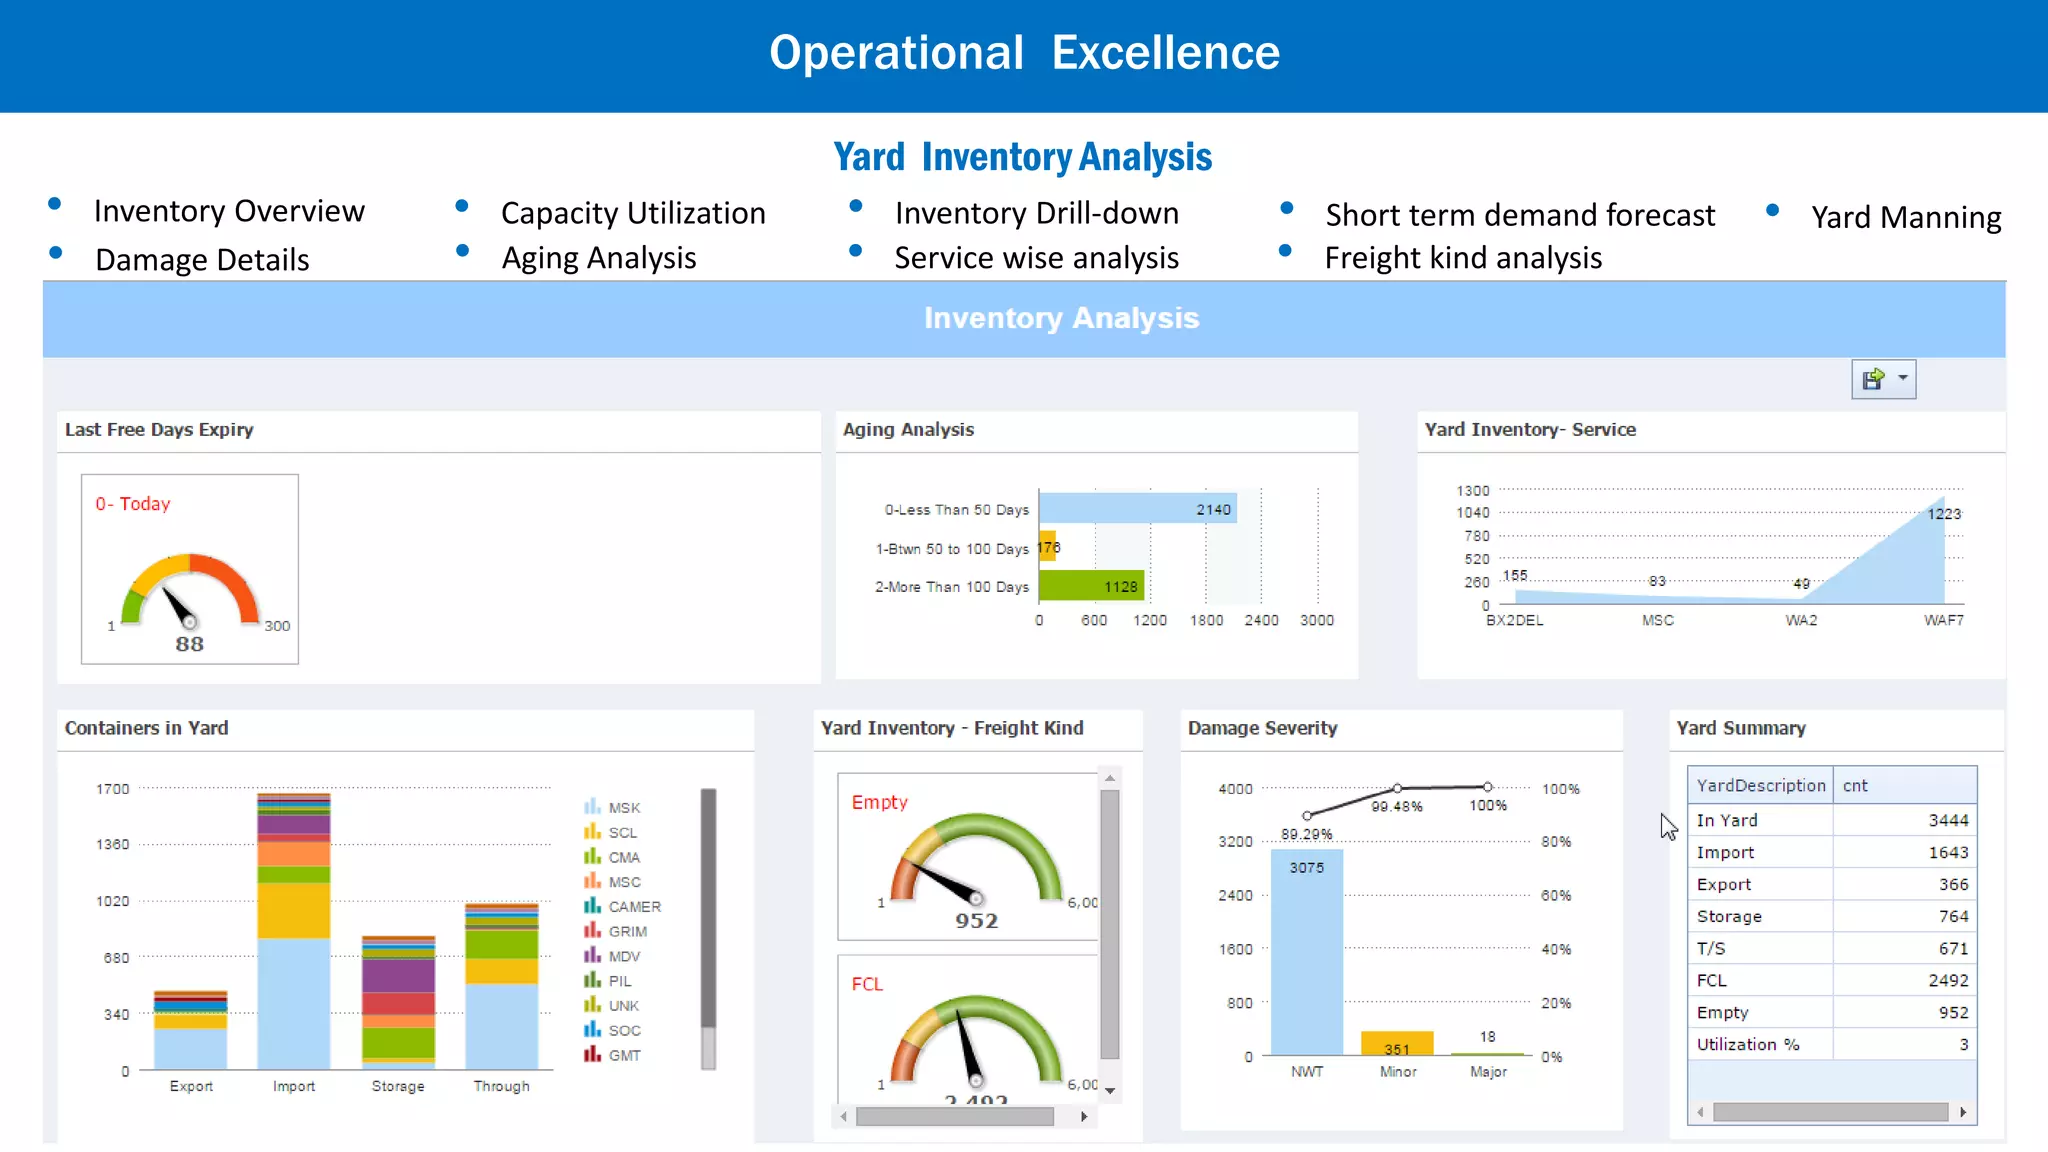
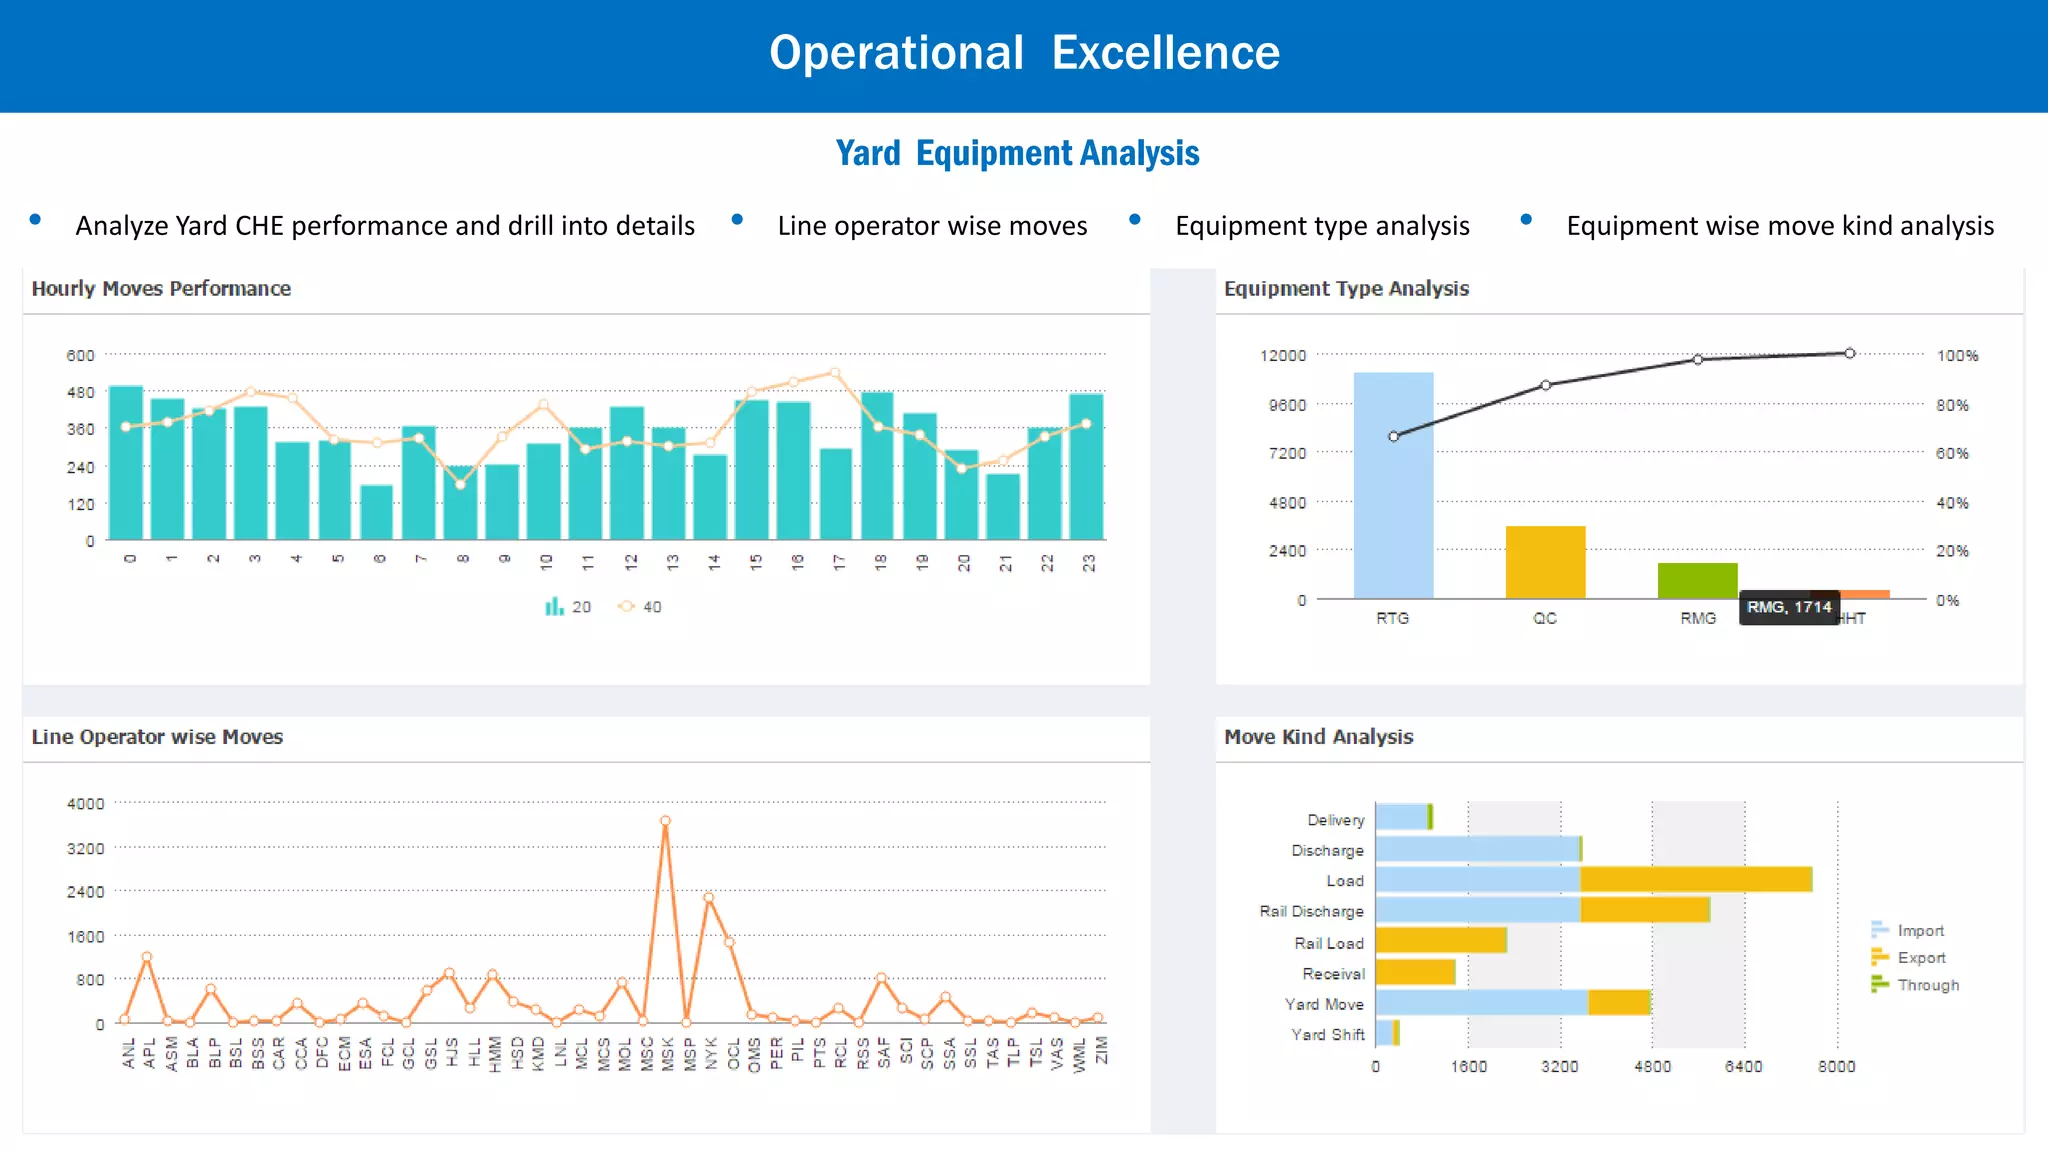
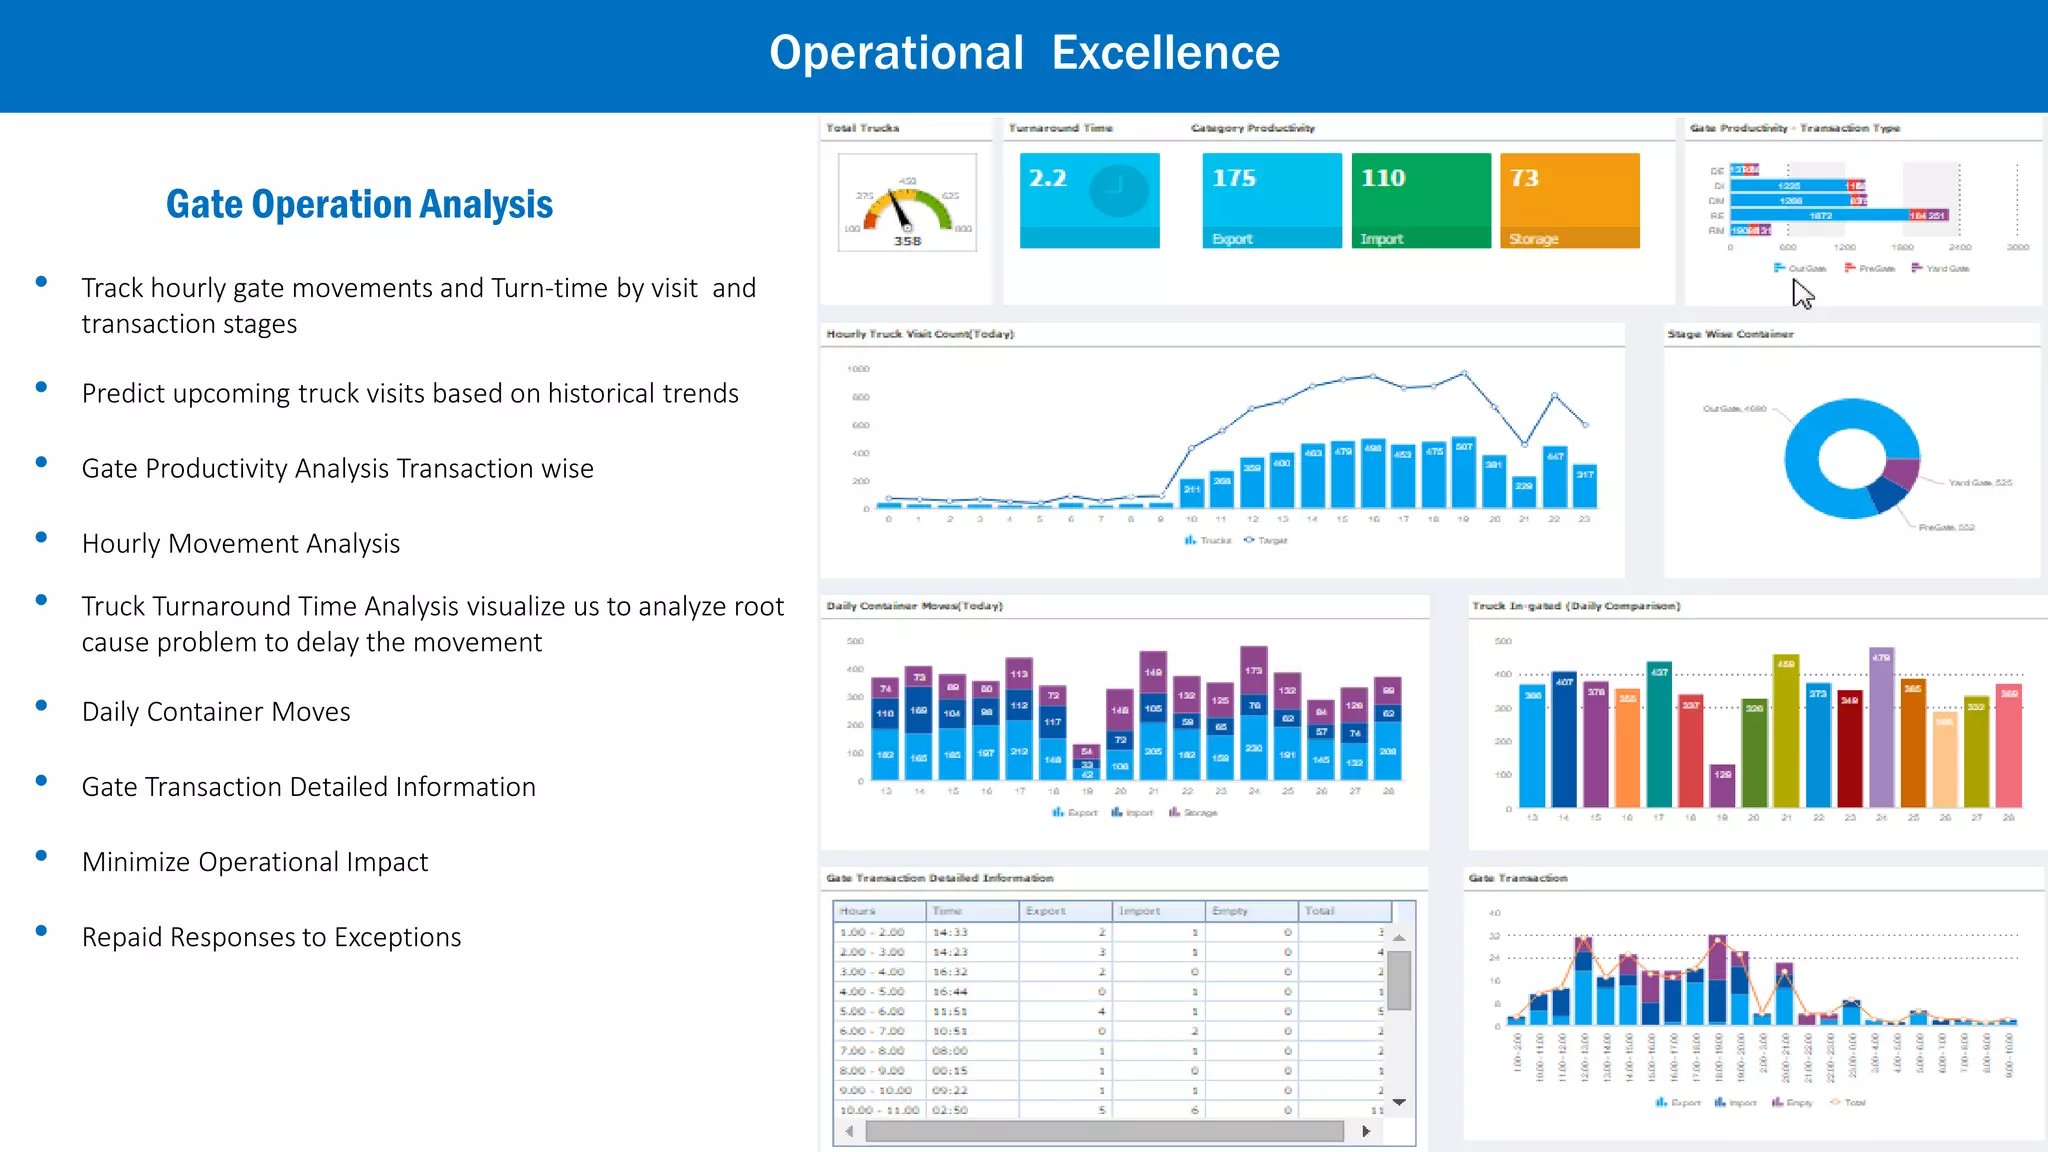
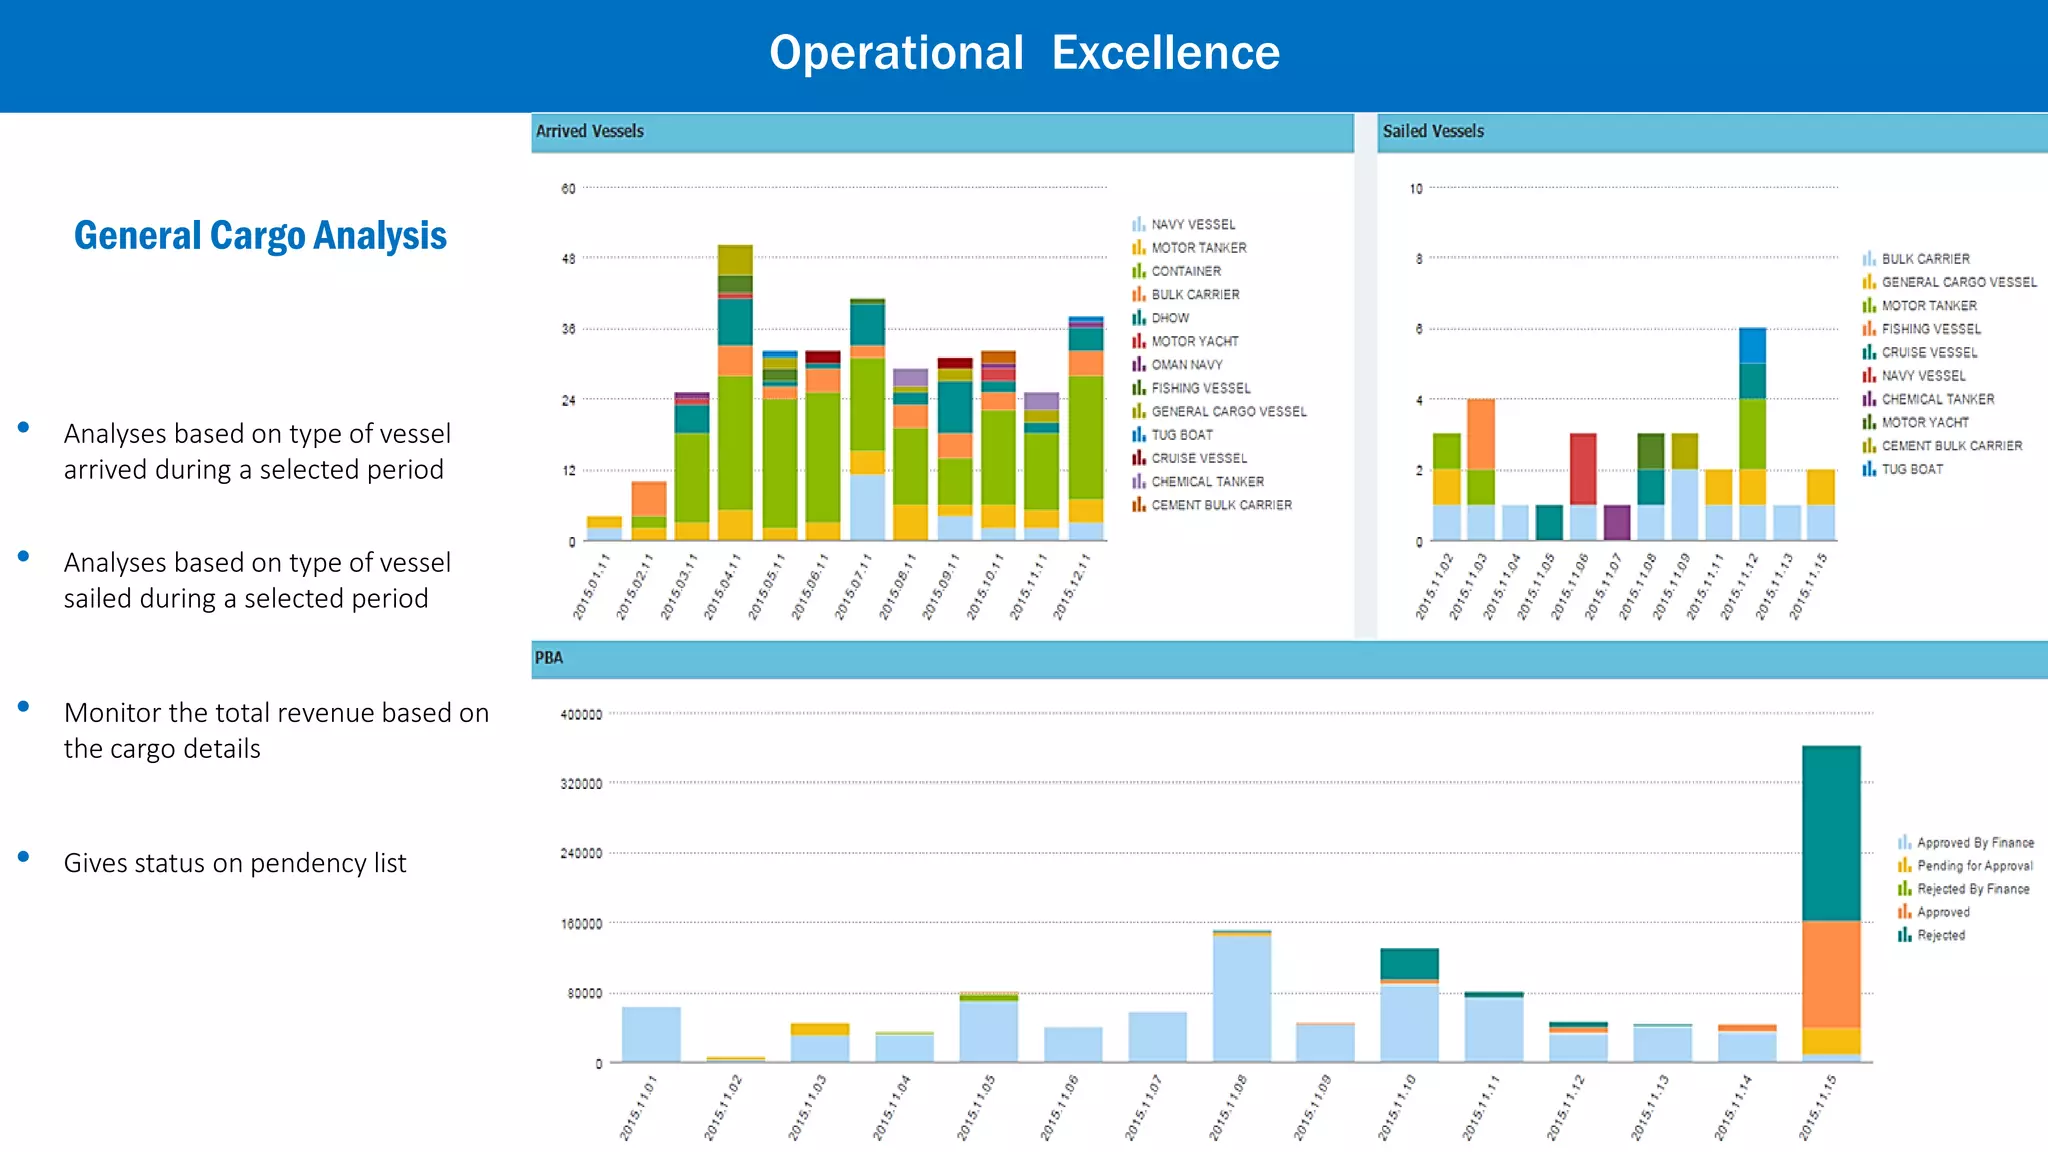
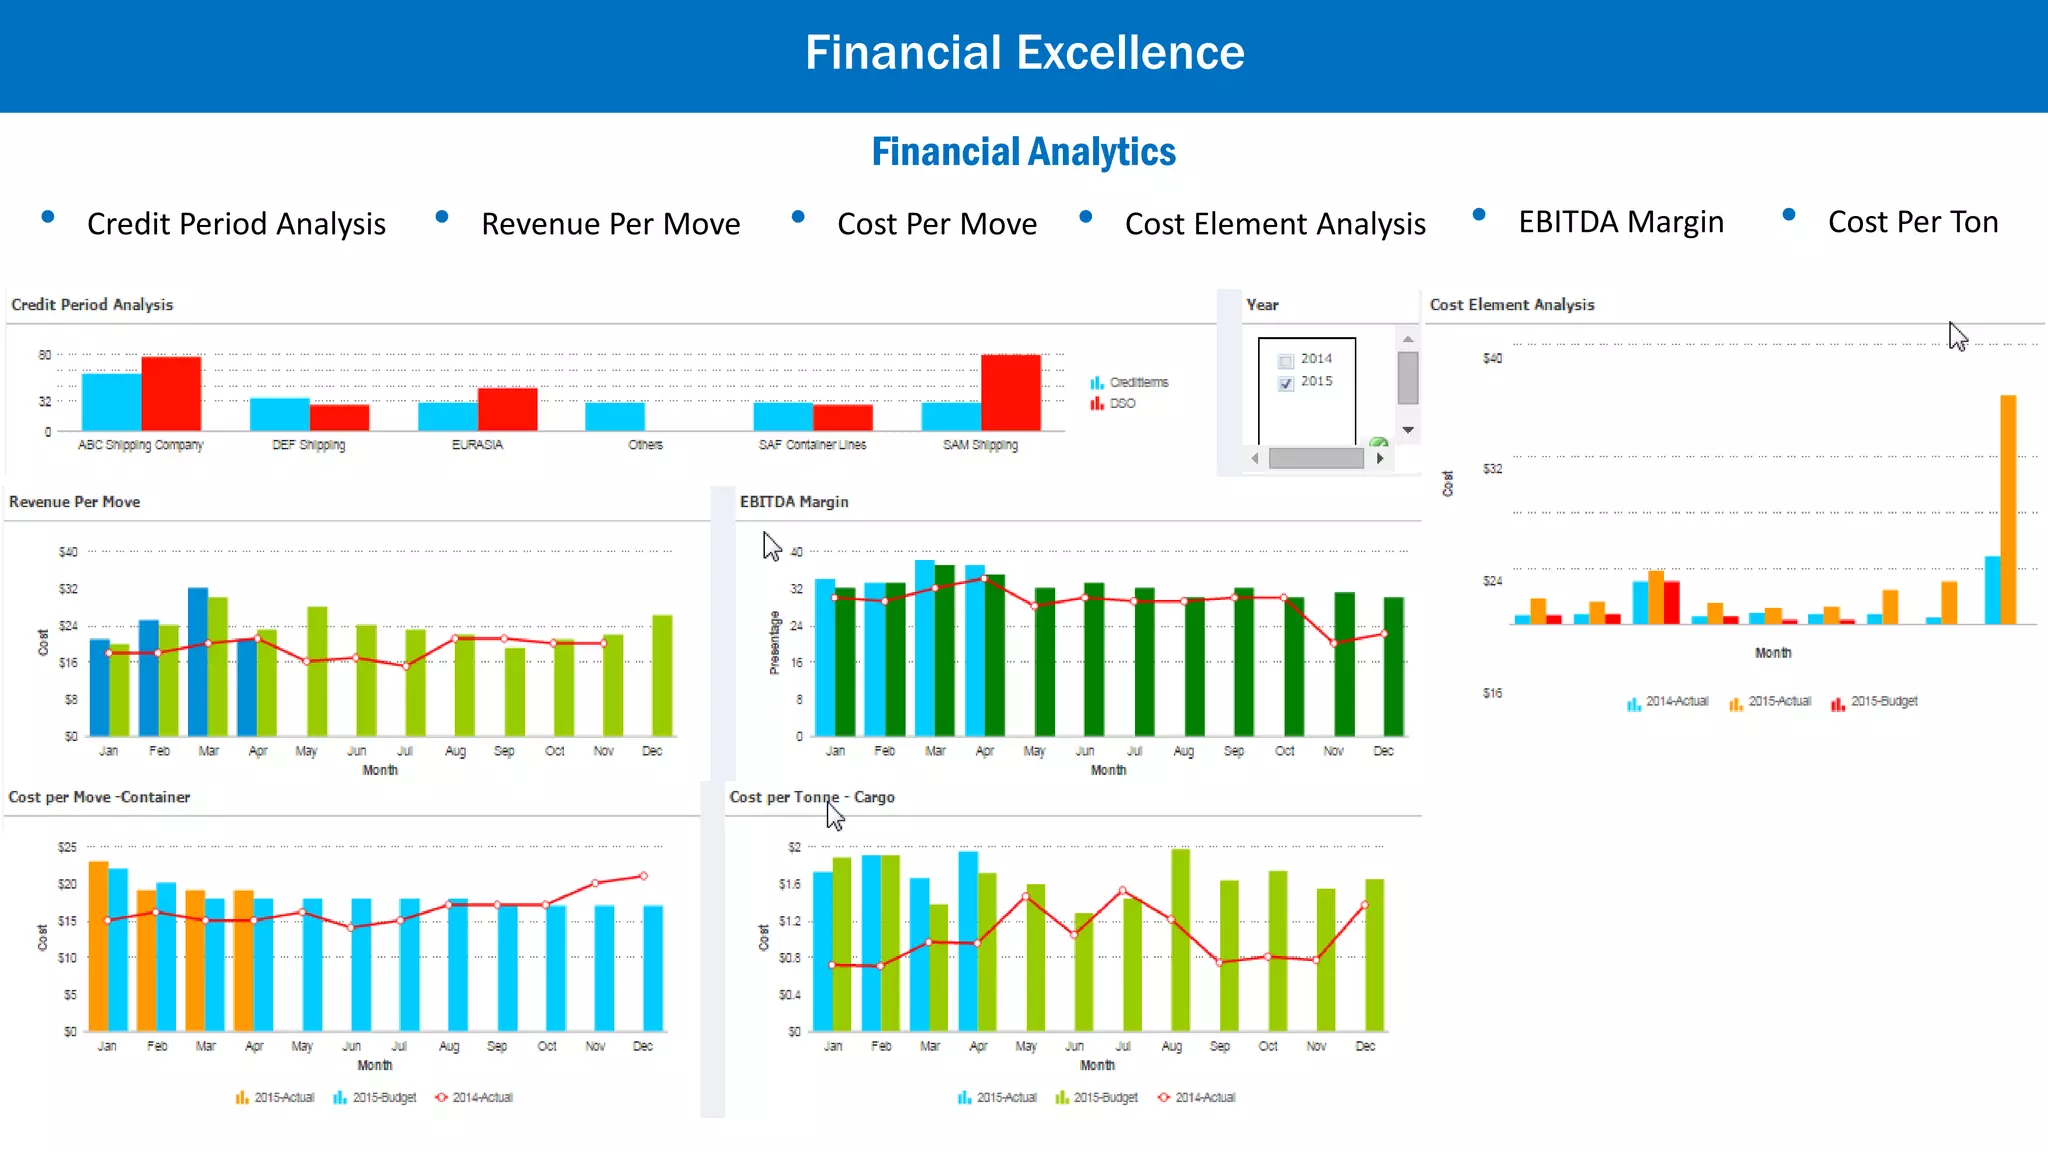
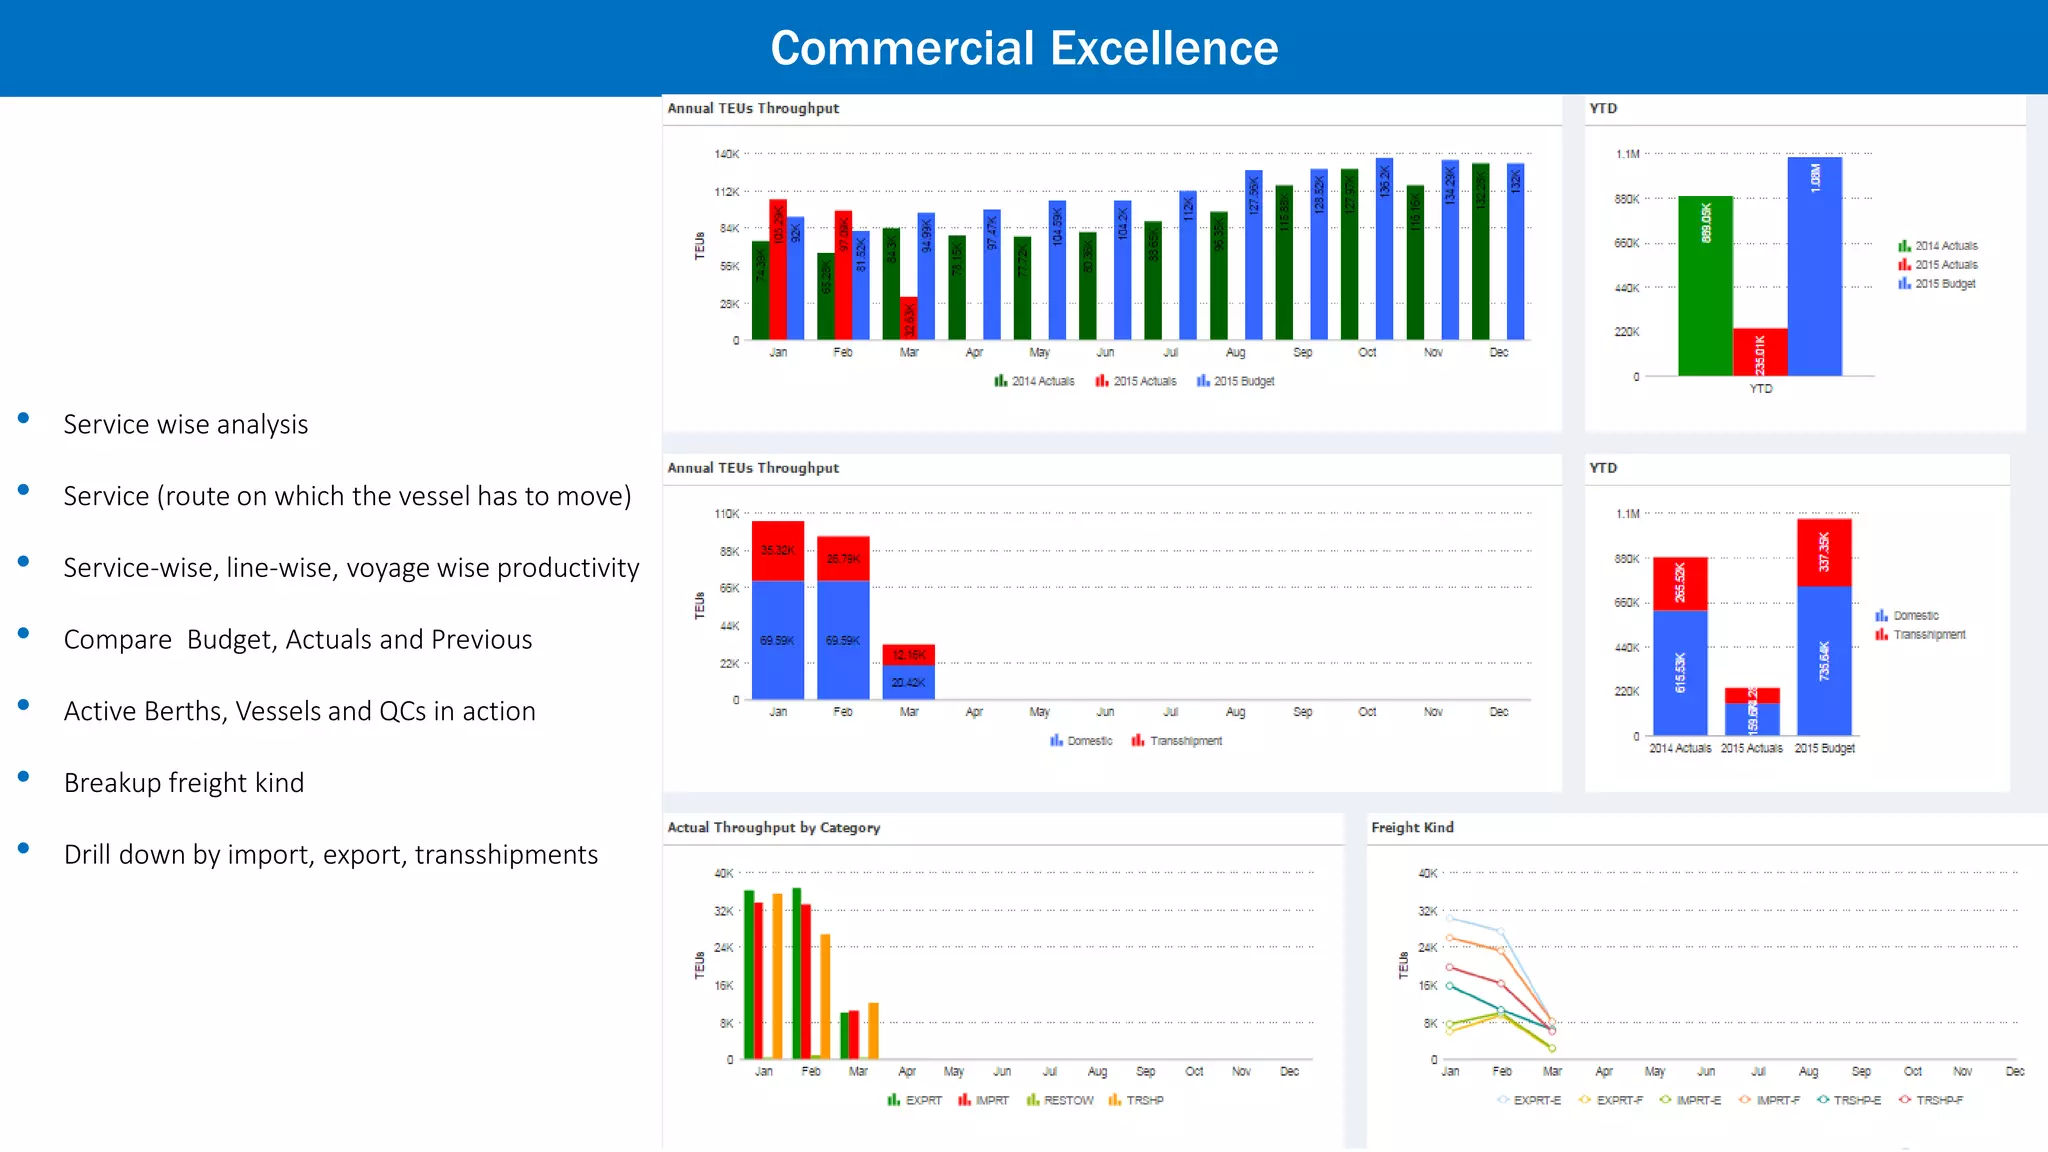
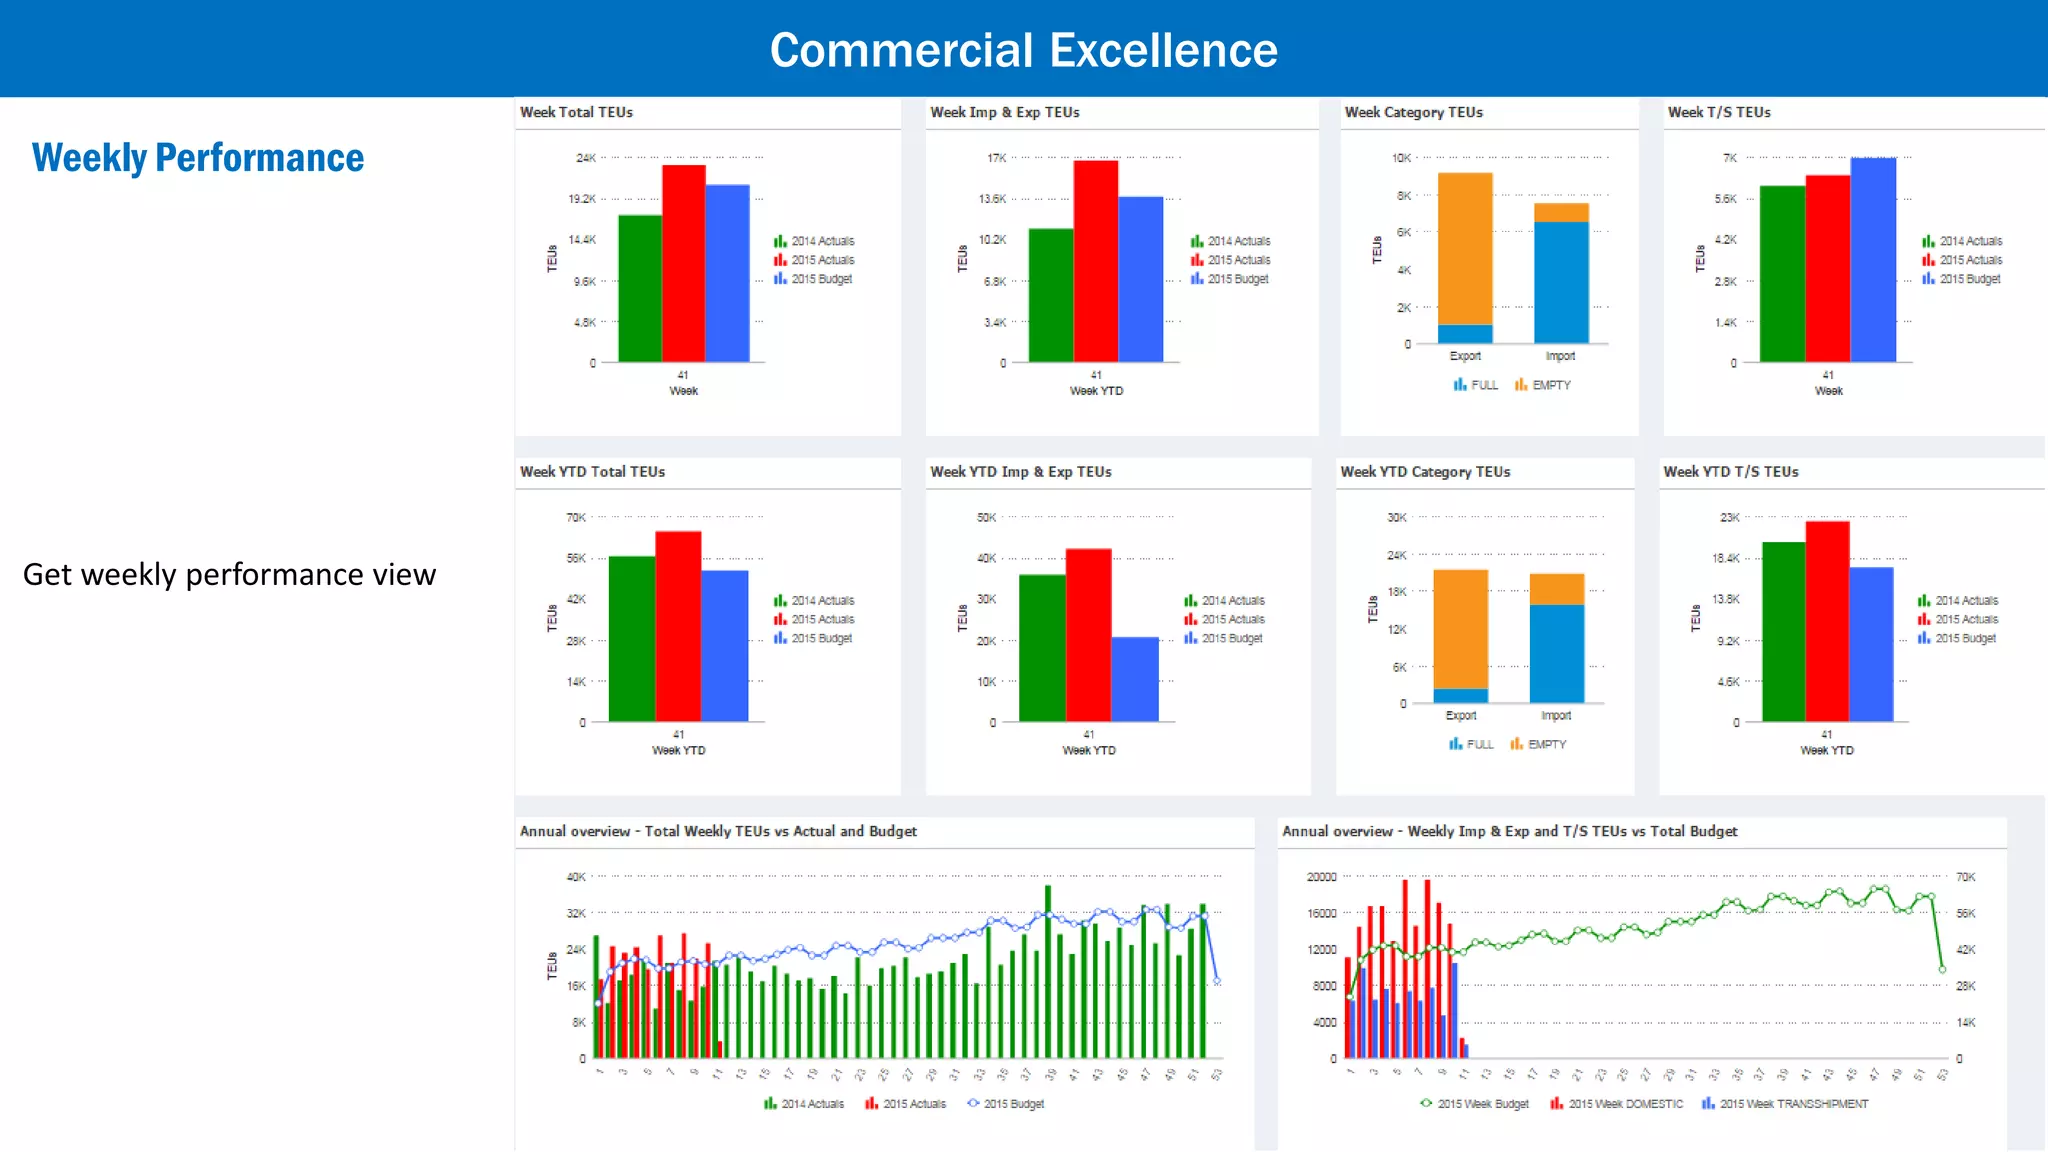
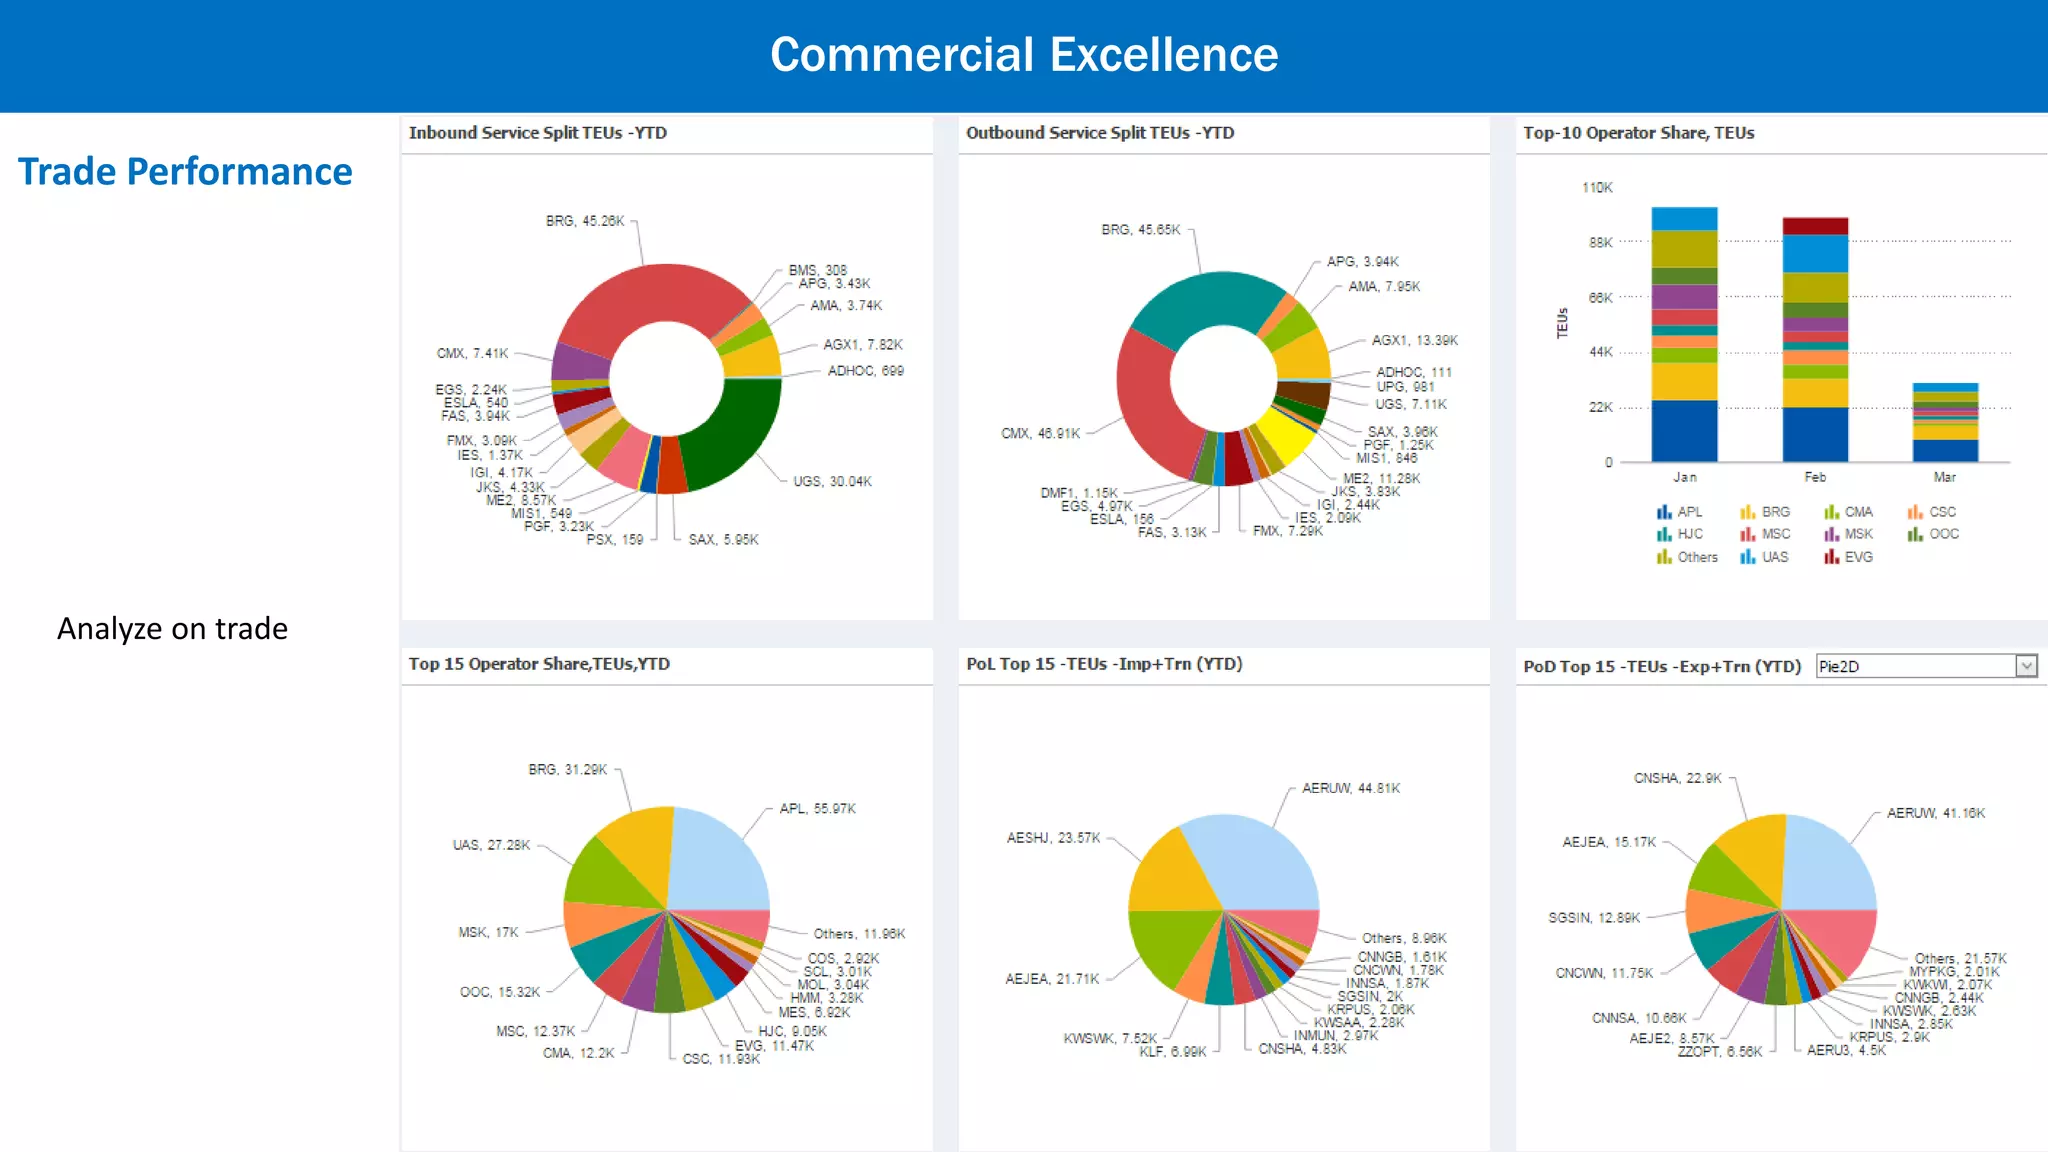
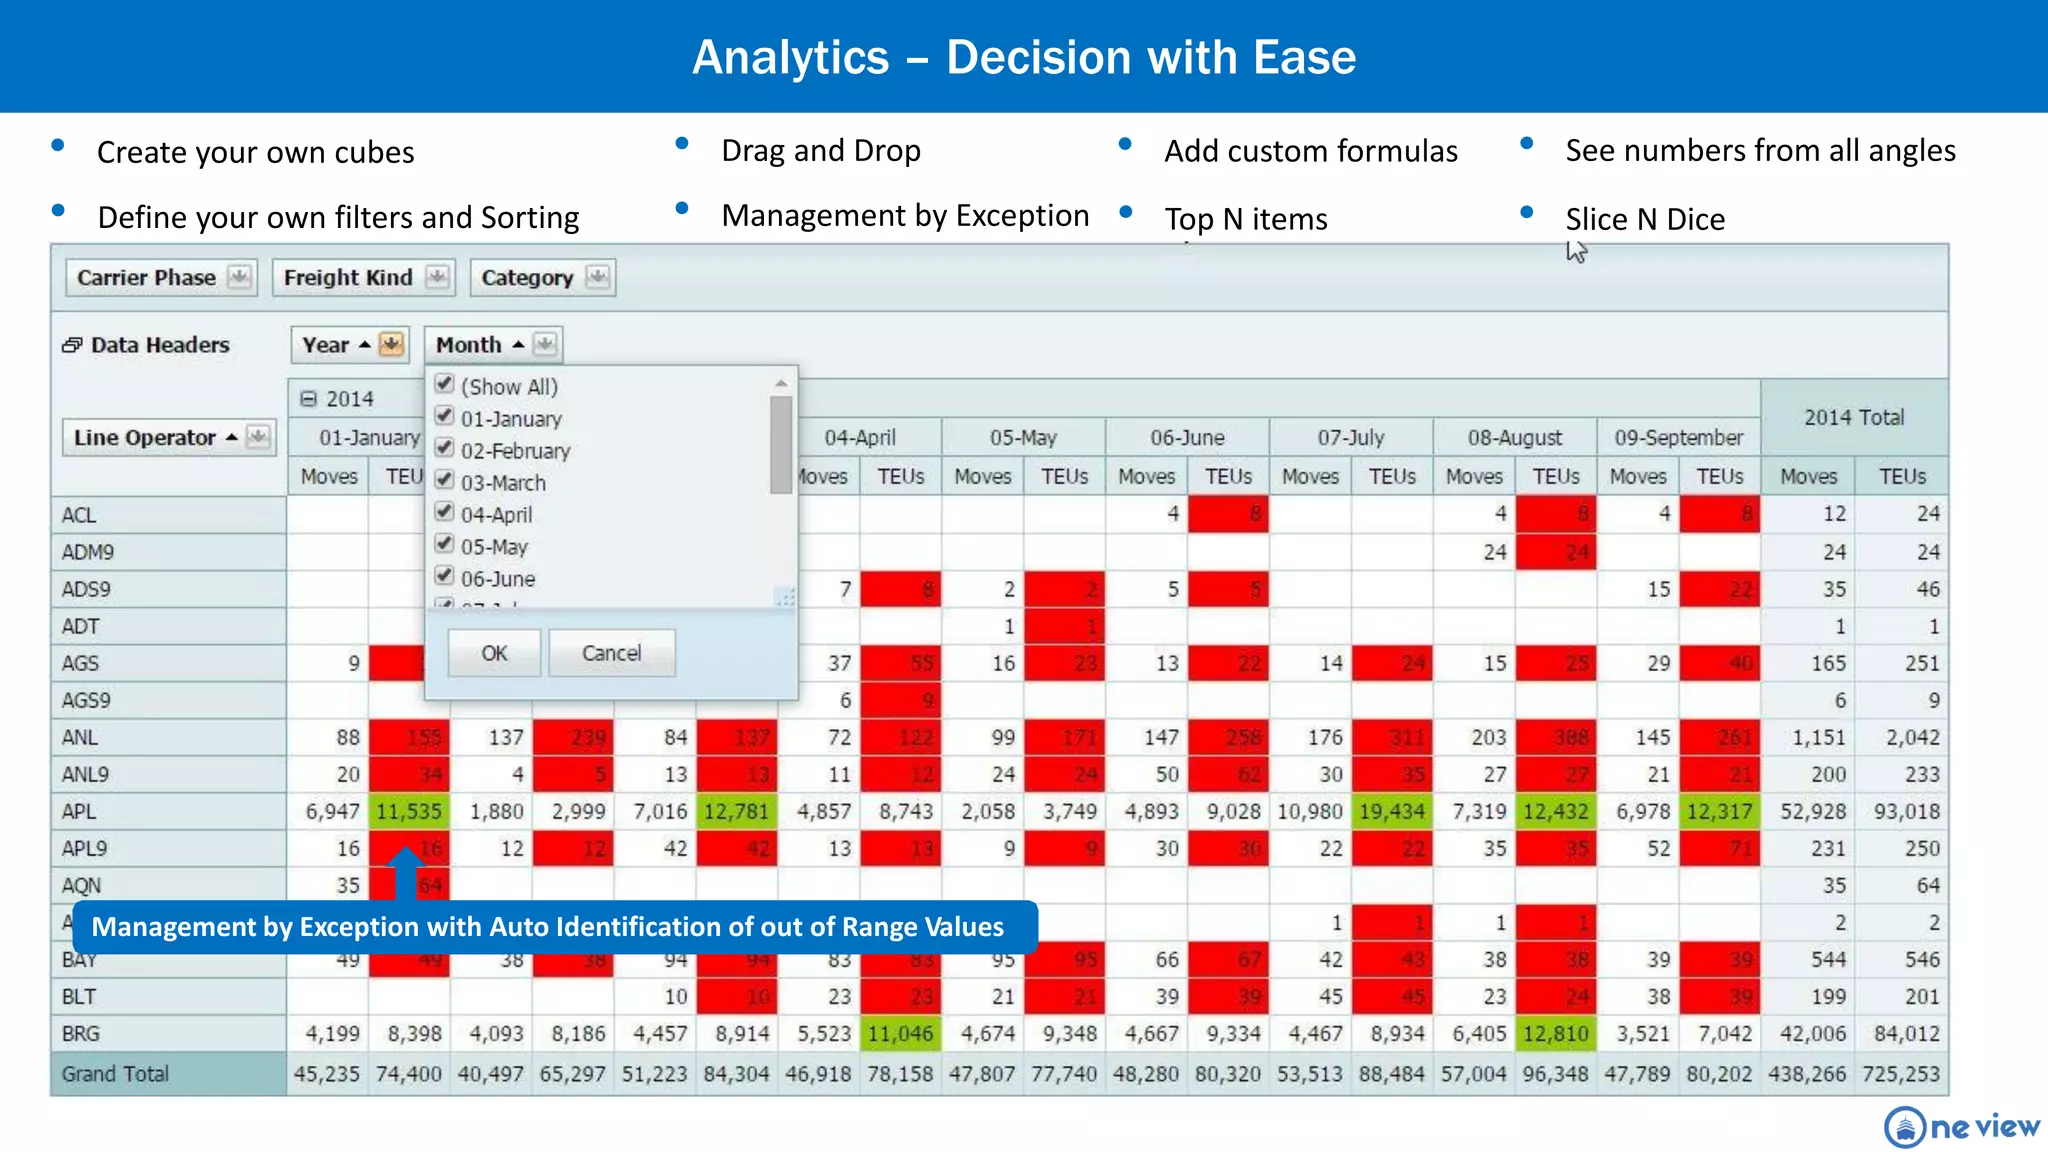
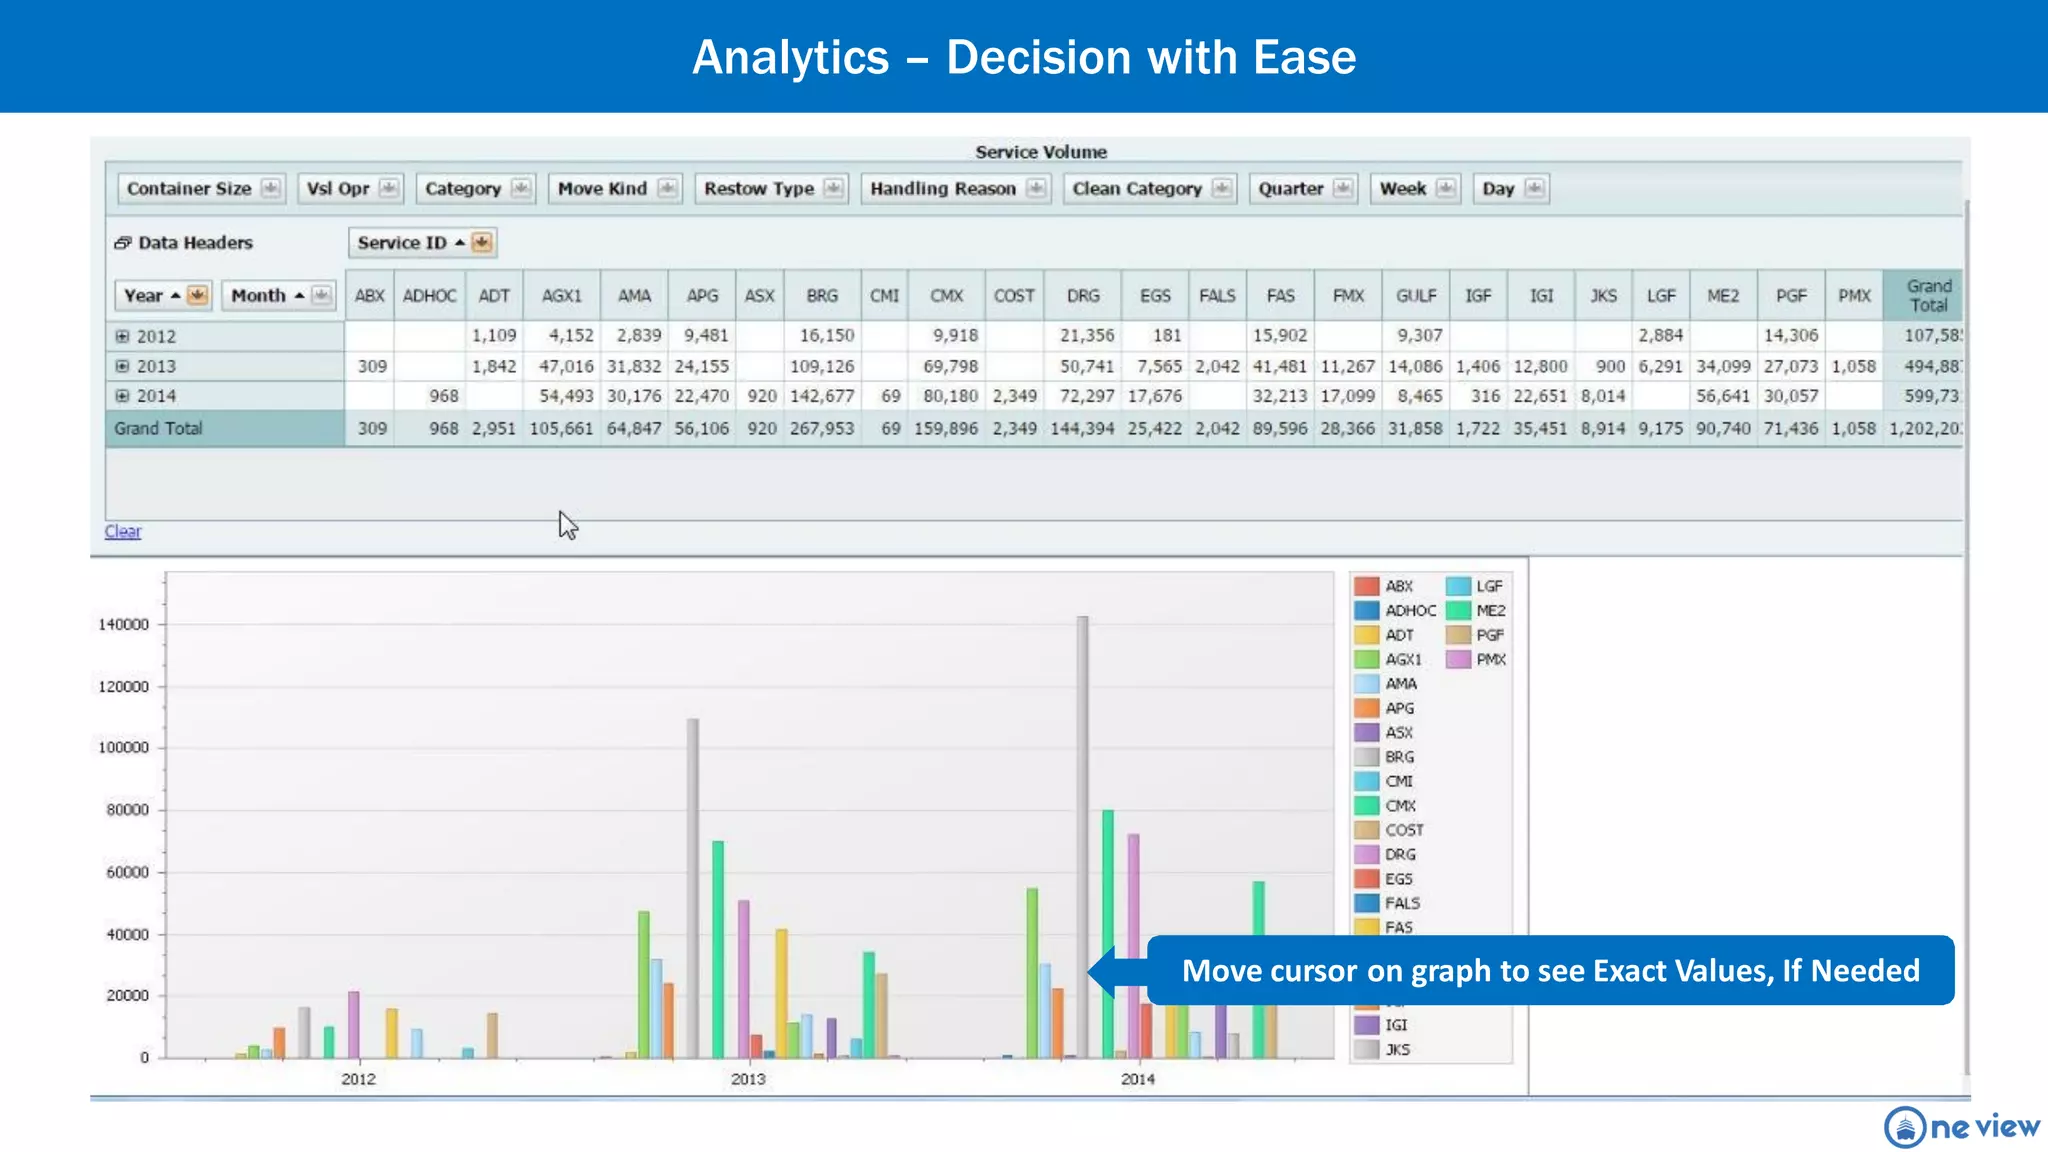
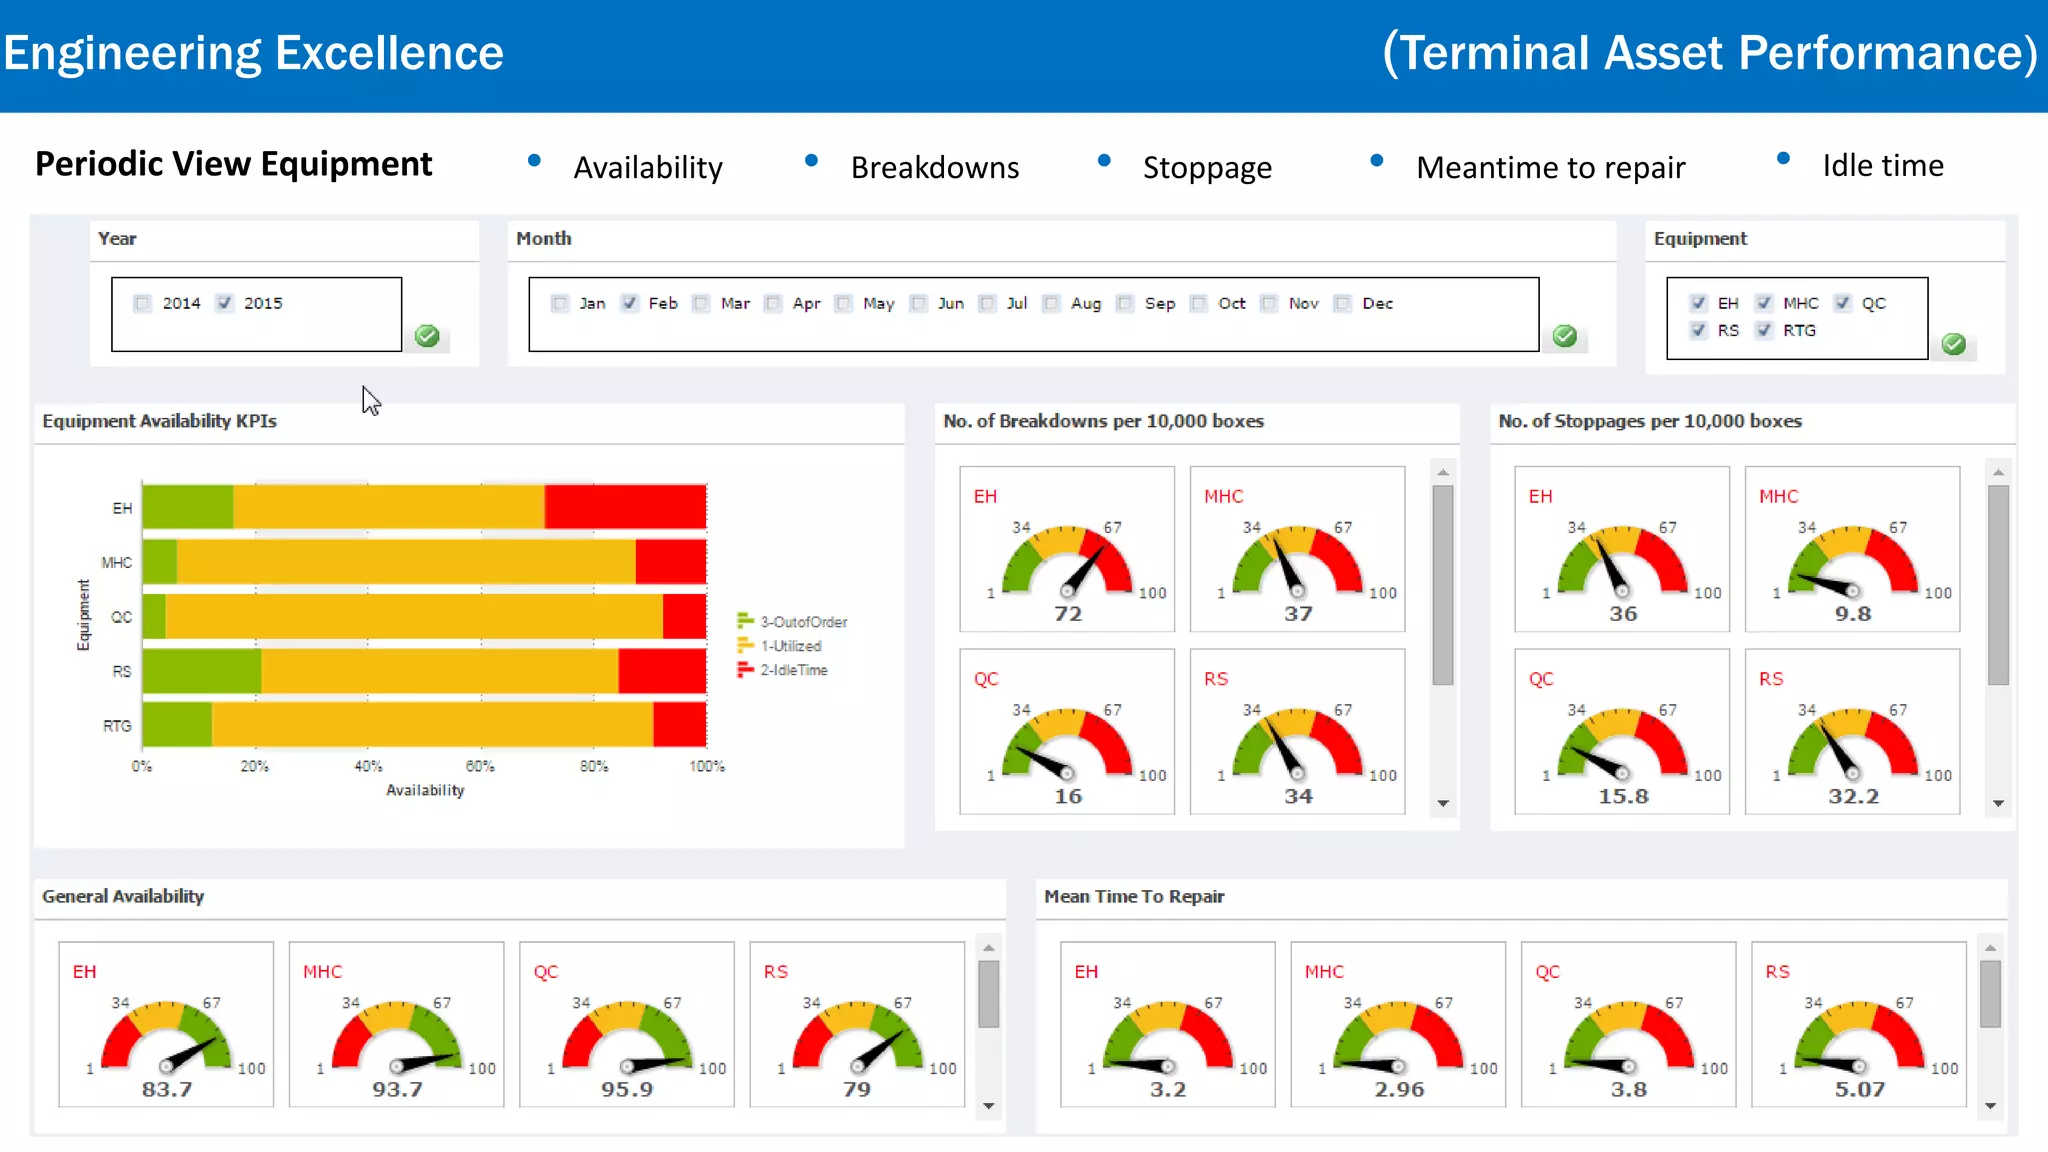
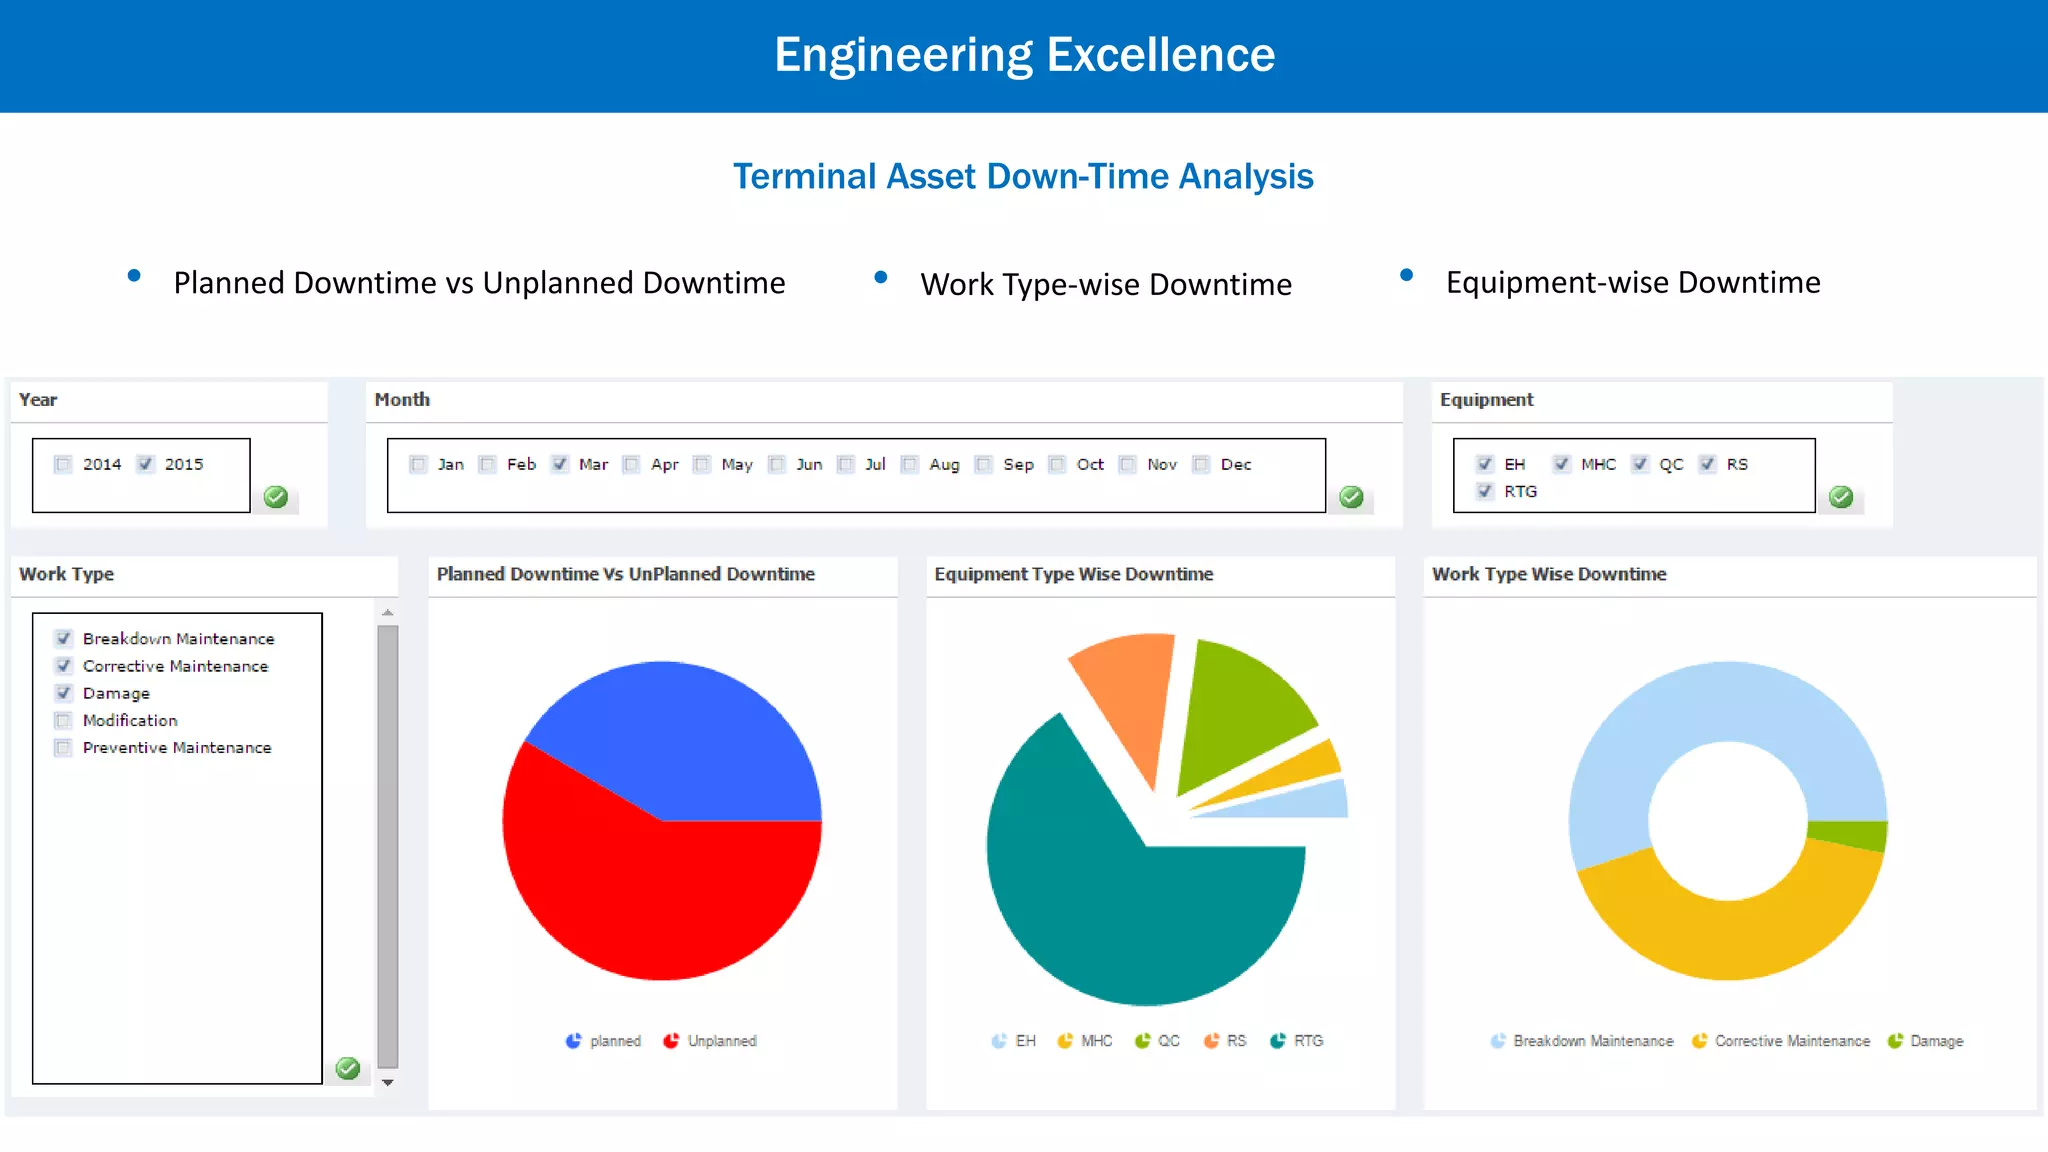
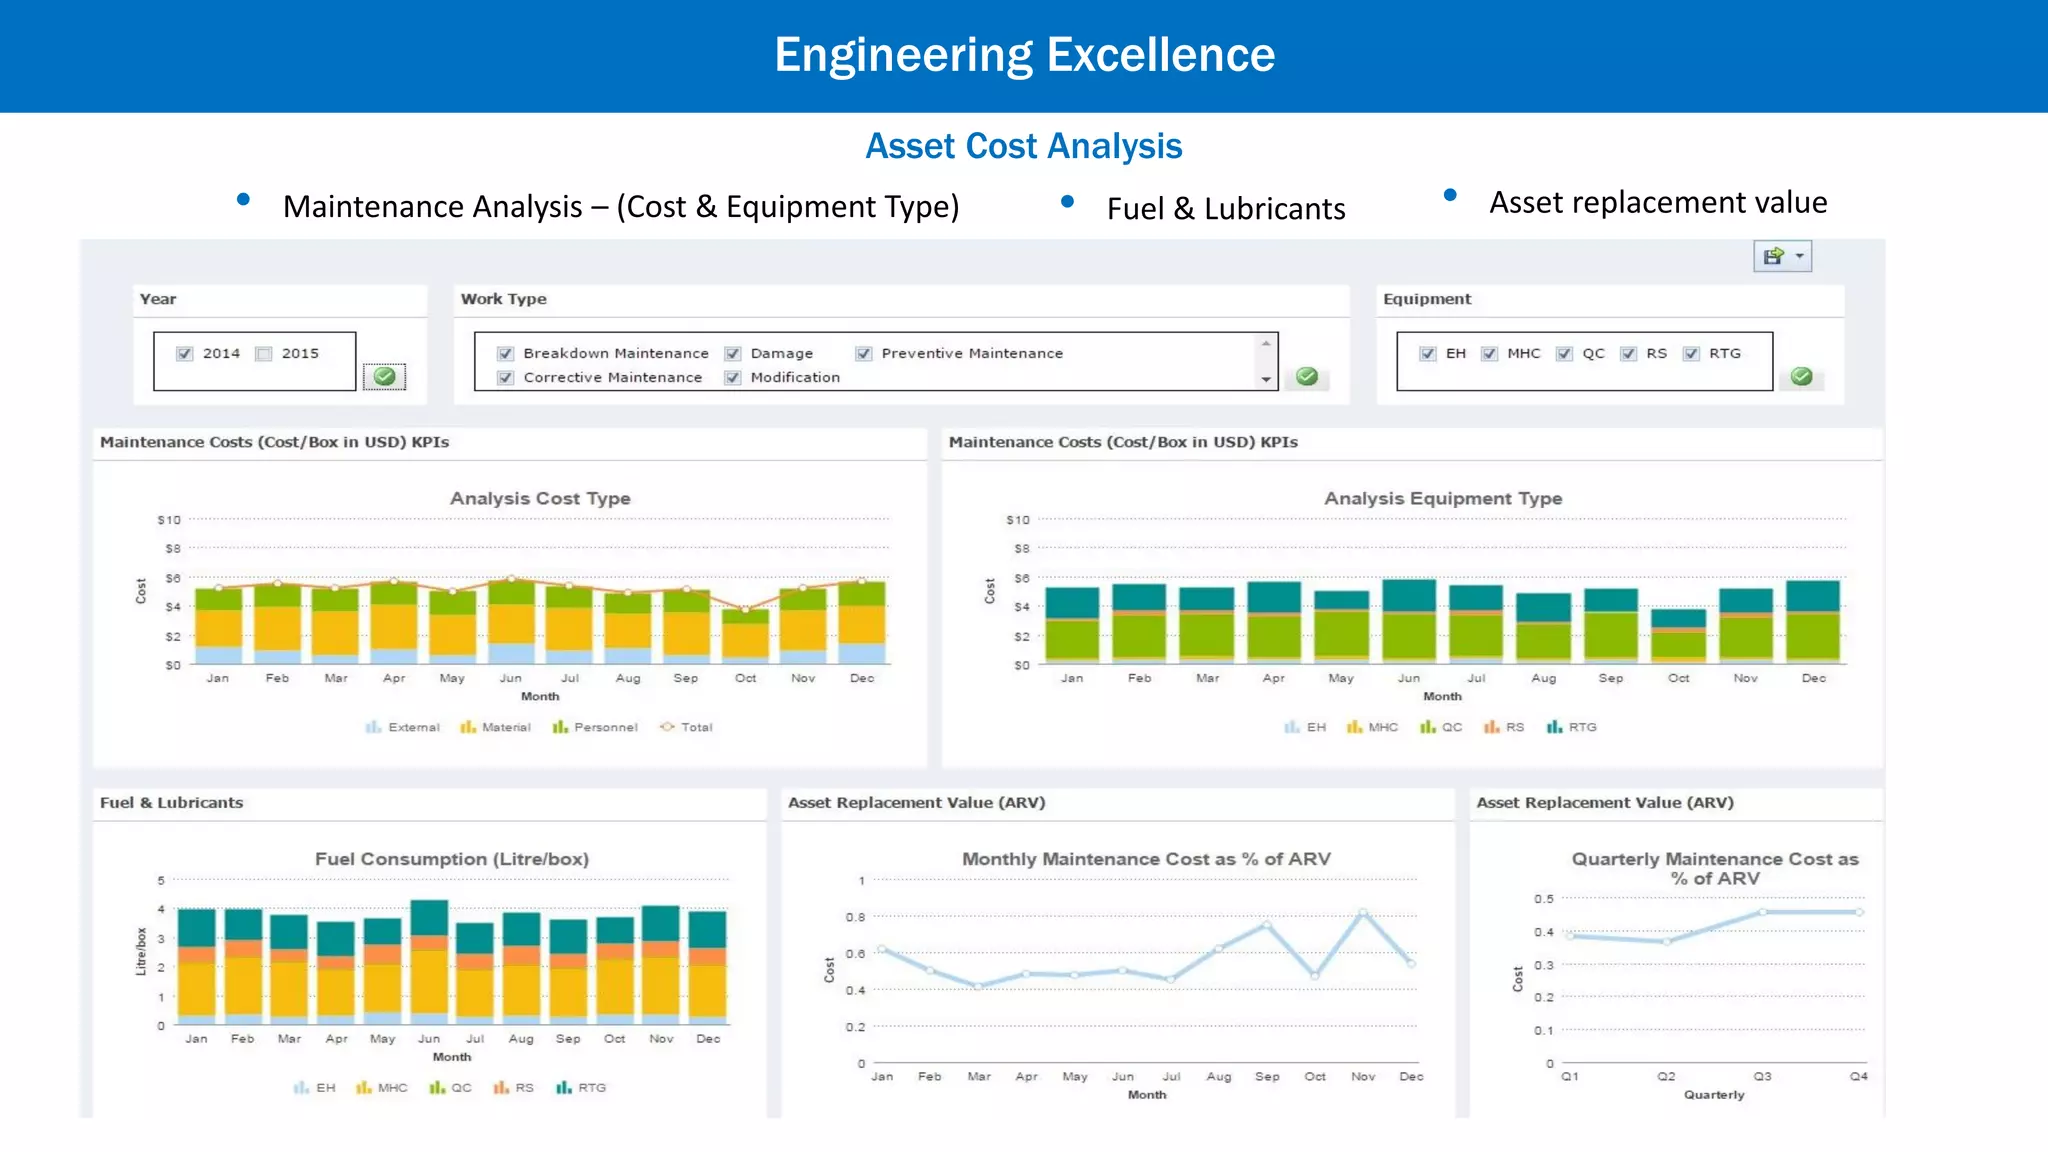
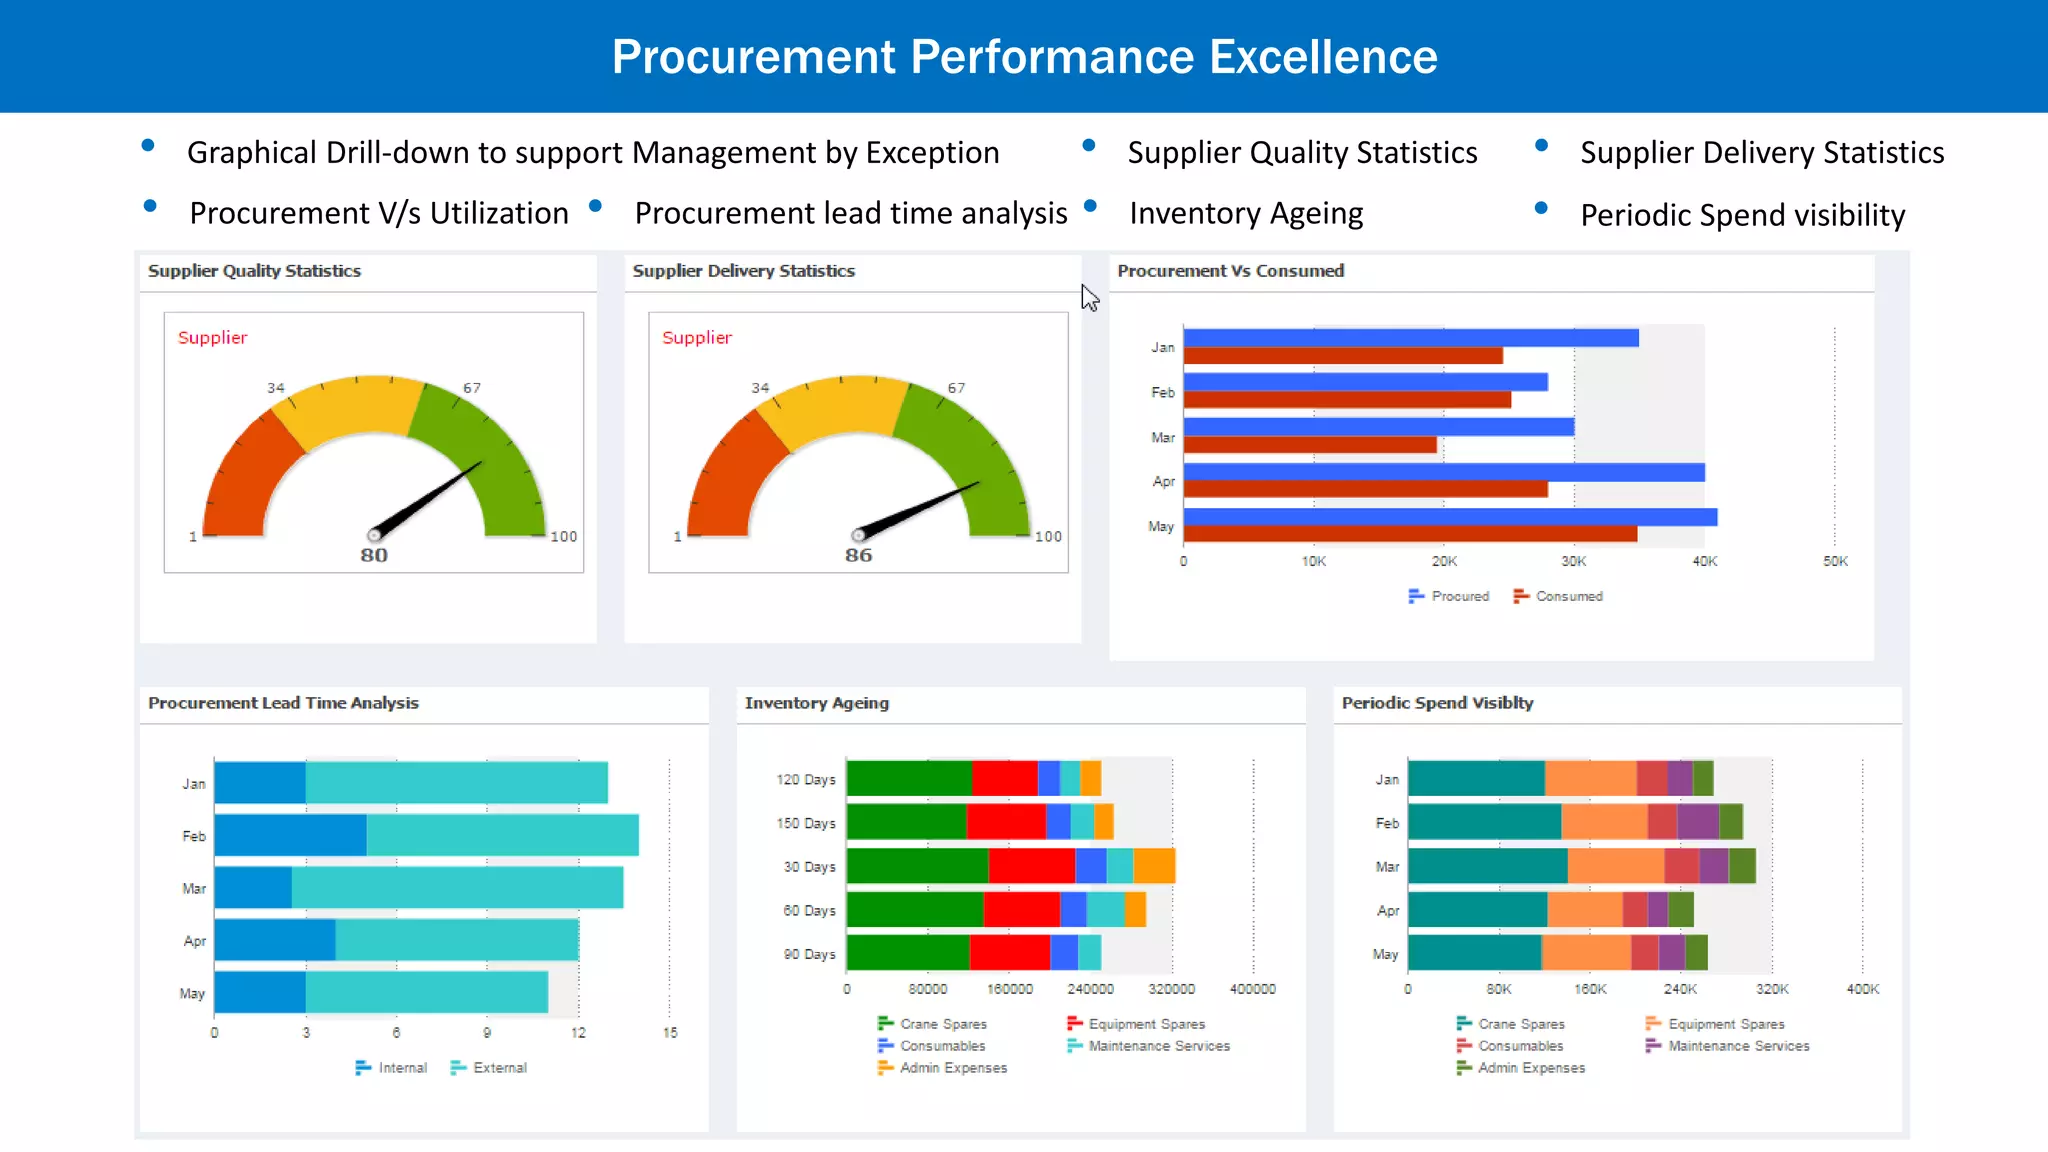
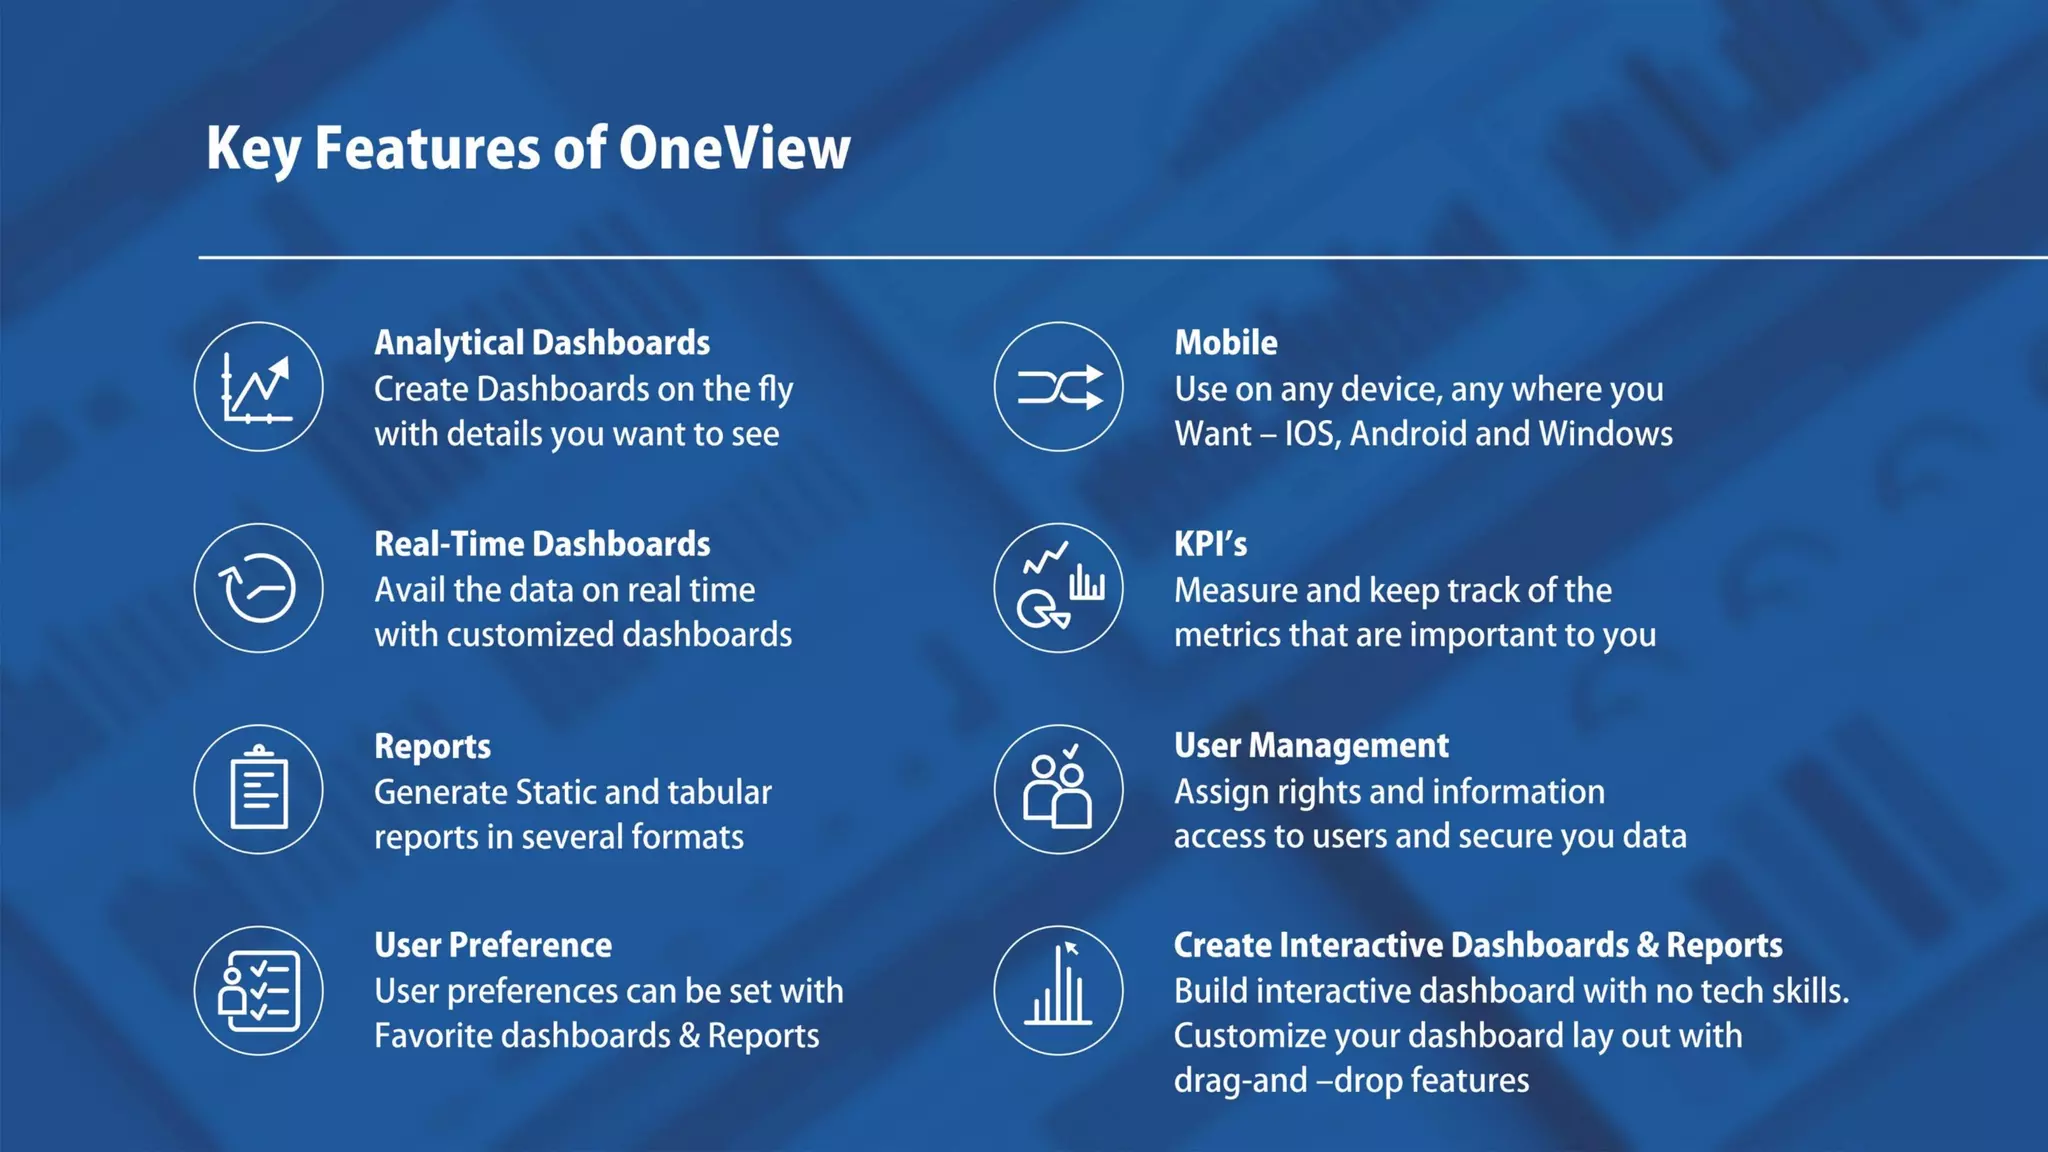
`
Integrated view of all Business functions in OneView
Options to add more functions tailored to your business needs
OneView captures business critical information from Operations System, Work Force Management System,
Enterprise Asset Management, ERPs and other local systems to provide accurate identification of specific strengths
and weaknesses in business management. It works as Single version of truth at all levels of management in
the organization and act as smart decision support tool.
ShipOperationsArea
Quayside
Operations Import/Export Stock
Hinterland
Operations
Quay
Yard Moves
GateOperations
Gate
Yard
Empty Stock
Optimization of Operations
Operational Excellence
• ICD Operations• Gate Operations• Yard Operations• Quayside Operations
Gate Operation Analysis
• Track hourly gate movements and Turn-time by visit and
transaction stages
• Predict upcoming truck visits based on historical trends
• Gate Productivity Analysis Transaction wise
• Hourly Movement Analysis
• Truck Turnaround Time Analysis visualize us to analyze root
cause problem to delay the movement
• Daily Container Moves
• Gate Transaction Detailed Information
• Minimize Operational Impact
• Repaid Responses to Exceptions
Operational Excellence
• Freight kind analysis• Service wise analysis• Aging Analysis• Damage Details
• Yard Manning• Short term demand forecast• Inventory Drill-down• Capacity Utilization• Inventory Overview
Yard Performance Analysis
Operational Excellence
• Analyze Yard CHE performance and drill into details • Line operator wise moves • Equipment type analysis • Equipment wise move kind analysis
Yard Equipment Analysis
Operational Excellence
Quayside Analysis (Real-time Performance )
• Active Berths, Vessels and QCs in action • Delay Analysis • Historical Analysis• Monitoring Real Time Berth Performance
Help to speed up the vessel work time by eliminating operational inefficiencies by identifying their root cause
Operational Excellence
Shift Performance
Shift view on: • Moves • Vessels • Lines • QC Utilization • GMPH • BMPH
Operational Excellence
Weekly Vessel Analysis
• Shift wise moves • Detailed vessel report • Service wise analysis • Week wise filter• Berth utilization report
Operational Excellence
Crane Performance
• Auto refresh• Equipment idle time• Equipment wise moves• Equipment wise delay• Productivity Analysis
Operational Excellence
Delay Analysis
• Filter option for Focused Analysis• Export to PDF• Evaluation of causes of Delay
Operational Excellence
Terminal Departure Report
• Moves summary • Vessel information• Filter criteria • Equipment usage
Operational Excellence
Financial Excellence
• Credit Period Analysis • Revenue Per Move • Cost Per Move • Cost Element Analysis • EBITDA Margin • Cost Per Ton
Financial Analytics
Commercial Performance
Commercial Excellence
• Service wise analysis
• Service (route on which the vessel has to move)
• Service-wise, line-wise, voyage wise productivity
• Compare Budget, Actuals and Previous
• Active Berths, Vessels and QCs in action
• Breakup freight kind
• Drill down by import, export, transshipments
Weekly Performance
Commercial Excellence
Get weekly performance view
Trade Performance
Commercial Excellence
Analyze on trade
Periodic View Equipment • Availability • Breakdowns • Stoppage • Meantime to repair • Idle time
Engineering Excellence
Terminal Asset Performance
Engineering Excellence
• Work Type-wise Downtime • Equipment-wise Downtime• Planned Downtime vs Unplanned Downtime
Terminal Asset Down-Time Analysis
Asset Cost Analysis
Engineering Excellence
• Maintenance Analysis – (Cost & Equipment Type) • Fuel & Lubricants • Asset replacement value
Procurement Performance Excellence
• Graphical Drill-down to support Management by Exception • Supplier Quality Statistics • Supplier Delivery Statistics
• Procurement V/s Utilization • Procurement lead time analysis • Inventory Ageing • Periodic Spend visibility
Safety Analytics
Safety Excellence
• Accidents measured with severity
• Different category types
• Various causes for accidents
• Site wise severity analysis
Add power to your analytics
• Create your own cubes • Drag and Drop • Add custom formulas
• Define your own filters and Sorting • Management by Exception • Top N items
Management by Exception with Auto Identification of out of Range Values
• See numbers from all angles
• Slice N Dice
Analytics – Decision with Ease
Move cursor on graph to see Exact Values, If Needed
Key Features
Mobile
Use on any device, any where you
Want – IOS, Android and Windows
Analytical Dashboards
Create Dashboards on the fly
with details you want to see
Real-Time Dashboards
Avail the data on real time with
customized dashboards
KPI’s
Measure and keep track of the metrics
that are important to you
Reports
Generate Static and tabular
several formats
User Management
Assign rights and information access
to users and secure you data
reports in
User Preference
User preferences can be set with
Favorite dashboards & Reports
Create Interactive Dashboards & Reports
Build interactive dashboard with no tech skills.
Customize your dashboard lay out with
drag-and –drop features
Thank you
Get in touch with us.
Business driven IT Solutions
www.envecon.com

One view - Business Performance Management Solution

  • 3.
    ` Integrated view ofall Business functions in OneView Options to add more functions tailored to your business needs OneView captures business critical information from Operations System, Work Force Management System, Enterprise Asset Management, ERPs and other local systems to provide accurate identification of specific strengths and weaknesses in business management. It works as Single version of truth at all levels of management in the organization and act as smart decision support tool.
  • 4.
    ShipOperationsArea Quayside Operations Import/Export Stock Hinterland Operations Quay YardMoves GateOperations Gate Yard Empty Stock Optimization of Operations Operational Excellence • ICD Operations• Gate Operations• Yard Operations• Quayside Operations
  • 5.
    Gate Operation Analysis •Track hourly gate movements and Turn-time by visit and transaction stages • Predict upcoming truck visits based on historical trends • Gate Productivity Analysis Transaction wise • Hourly Movement Analysis • Truck Turnaround Time Analysis visualize us to analyze root cause problem to delay the movement • Daily Container Moves • Gate Transaction Detailed Information • Minimize Operational Impact • Repaid Responses to Exceptions Operational Excellence
  • 6.
    • Freight kindanalysis• Service wise analysis• Aging Analysis• Damage Details • Yard Manning• Short term demand forecast• Inventory Drill-down• Capacity Utilization• Inventory Overview Yard Performance Analysis Operational Excellence
  • 7.
    • Analyze YardCHE performance and drill into details • Line operator wise moves • Equipment type analysis • Equipment wise move kind analysis Yard Equipment Analysis Operational Excellence
  • 8.
    Quayside Analysis (Real-timePerformance ) • Active Berths, Vessels and QCs in action • Delay Analysis • Historical Analysis• Monitoring Real Time Berth Performance Help to speed up the vessel work time by eliminating operational inefficiencies by identifying their root cause Operational Excellence
  • 9.
    Shift Performance Shift viewon: • Moves • Vessels • Lines • QC Utilization • GMPH • BMPH Operational Excellence
  • 10.
    Weekly Vessel Analysis •Shift wise moves • Detailed vessel report • Service wise analysis • Week wise filter• Berth utilization report Operational Excellence
  • 11.
    Crane Performance • Autorefresh• Equipment idle time• Equipment wise moves• Equipment wise delay• Productivity Analysis Operational Excellence
  • 12.
    Delay Analysis • Filteroption for Focused Analysis• Export to PDF• Evaluation of causes of Delay Operational Excellence
  • 13.
    Terminal Departure Report •Moves summary • Vessel information• Filter criteria • Equipment usage Operational Excellence
  • 14.
    Financial Excellence • CreditPeriod Analysis • Revenue Per Move • Cost Per Move • Cost Element Analysis • EBITDA Margin • Cost Per Ton Financial Analytics
  • 15.
    Commercial Performance Commercial Excellence •Service wise analysis • Service (route on which the vessel has to move) • Service-wise, line-wise, voyage wise productivity • Compare Budget, Actuals and Previous • Active Berths, Vessels and QCs in action • Breakup freight kind • Drill down by import, export, transshipments
  • 16.
  • 17.
  • 18.
    Periodic View Equipment• Availability • Breakdowns • Stoppage • Meantime to repair • Idle time Engineering Excellence Terminal Asset Performance
  • 19.
    Engineering Excellence • WorkType-wise Downtime • Equipment-wise Downtime• Planned Downtime vs Unplanned Downtime Terminal Asset Down-Time Analysis
  • 20.
    Asset Cost Analysis EngineeringExcellence • Maintenance Analysis – (Cost & Equipment Type) • Fuel & Lubricants • Asset replacement value
  • 21.
    Procurement Performance Excellence •Graphical Drill-down to support Management by Exception • Supplier Quality Statistics • Supplier Delivery Statistics • Procurement V/s Utilization • Procurement lead time analysis • Inventory Ageing • Periodic Spend visibility
  • 22.
    Safety Analytics Safety Excellence •Accidents measured with severity • Different category types • Various causes for accidents • Site wise severity analysis
  • 23.
    Add power toyour analytics
  • 24.
    • Create yourown cubes • Drag and Drop • Add custom formulas • Define your own filters and Sorting • Management by Exception • Top N items Management by Exception with Auto Identification of out of Range Values • See numbers from all angles • Slice N Dice Analytics – Decision with Ease
  • 25.
    Analytics – Decisionwith Ease Move cursor on graph to see Exact Values, If Needed
  • 26.
    Key Features Mobile Use onany device, any where you Want – IOS, Android and Windows Analytical Dashboards Create Dashboards on the fly with details you want to see Real-Time Dashboards Avail the data on real time with customized dashboards KPI’s Measure and keep track of the metrics that are important to you Reports Generate Static and tabular several formats User Management Assign rights and information access to users and secure you data reports in User Preference User preferences can be set with Favorite dashboards & Reports Create Interactive Dashboards & Reports Build interactive dashboard with no tech skills. Customize your dashboard lay out with drag-and –drop features
  • 27.
    Thank you Get intouch with us. Business driven IT Solutions www.envecon.com