Download to read offline


![TCPDUMP
15:47:57.250119 IP (tos 0x0, ttl 64, id 44402, offset
0, flags [DF], proto TCP (6), length 569)
192.168.3.131.58749 > 93.184.216.34.80: Flags
[P.], cksum 0x76b5 (correct), seq
3847355529:3847356046, ack 3021125542, win
4096, options [nop,nop,TS val 848825338 ecr
1053000005], length 517: HTTP, length: 517
GET / HTTP/1.1
Host: example.com
Connection: keep-alive
…](https://image.slidesharecdn.com/onthewaytolowlatency3-160123073034/75/On-the-way-to-low-latency-2nd-edition-46-2048.jpg)
![TCPDUMP
15:58:32.009884 IP (tos 0x0, ttl 255, id 39809, offset 0,
flags [none], proto UDP (17), length 63)
192.168.3.131.56546 > 192.168.3.1.53: [udp sum ok]
52969+ A? www.google.com.ua. …
15:58:32.012844 IP (tos 0x0, ttl 64, id 0, offset 0, flags
[DF], proto UDP (17), length 127)
192.168.3.1.53 > 192.168.3.131.56546: [udp sum ok]
52969 q: A? www.google.com.ua. …](https://image.slidesharecdn.com/onthewaytolowlatency3-160123073034/75/On-the-way-to-low-latency-2nd-edition-47-2048.jpg)

![-XX:+PrintGCDetails
[GC (Allocation Failure) 260526.491: [ParNew
…
[Times: user=0.02 sys=0.00, real=0.01 secs]](https://image.slidesharecdn.com/onthewaytolowlatency3-160123073034/75/On-the-way-to-low-latency-2nd-edition-53-2048.jpg)
![-XX:+PrintTenuringDistribution
Desired survivor size 3342336 bytes, new
threshold 2 (max 2)
- age 1: 878568 bytes, 878568 total
- age 2: 1616 bytes, 880184 total
: 53829K->1380K(59008K), 0.0083140 secs]
1884058K->1831609K(2090624K), 0.0084006 secs]](https://image.slidesharecdn.com/onthewaytolowlatency3-160123073034/75/On-the-way-to-low-latency-2nd-edition-55-2048.jpg)

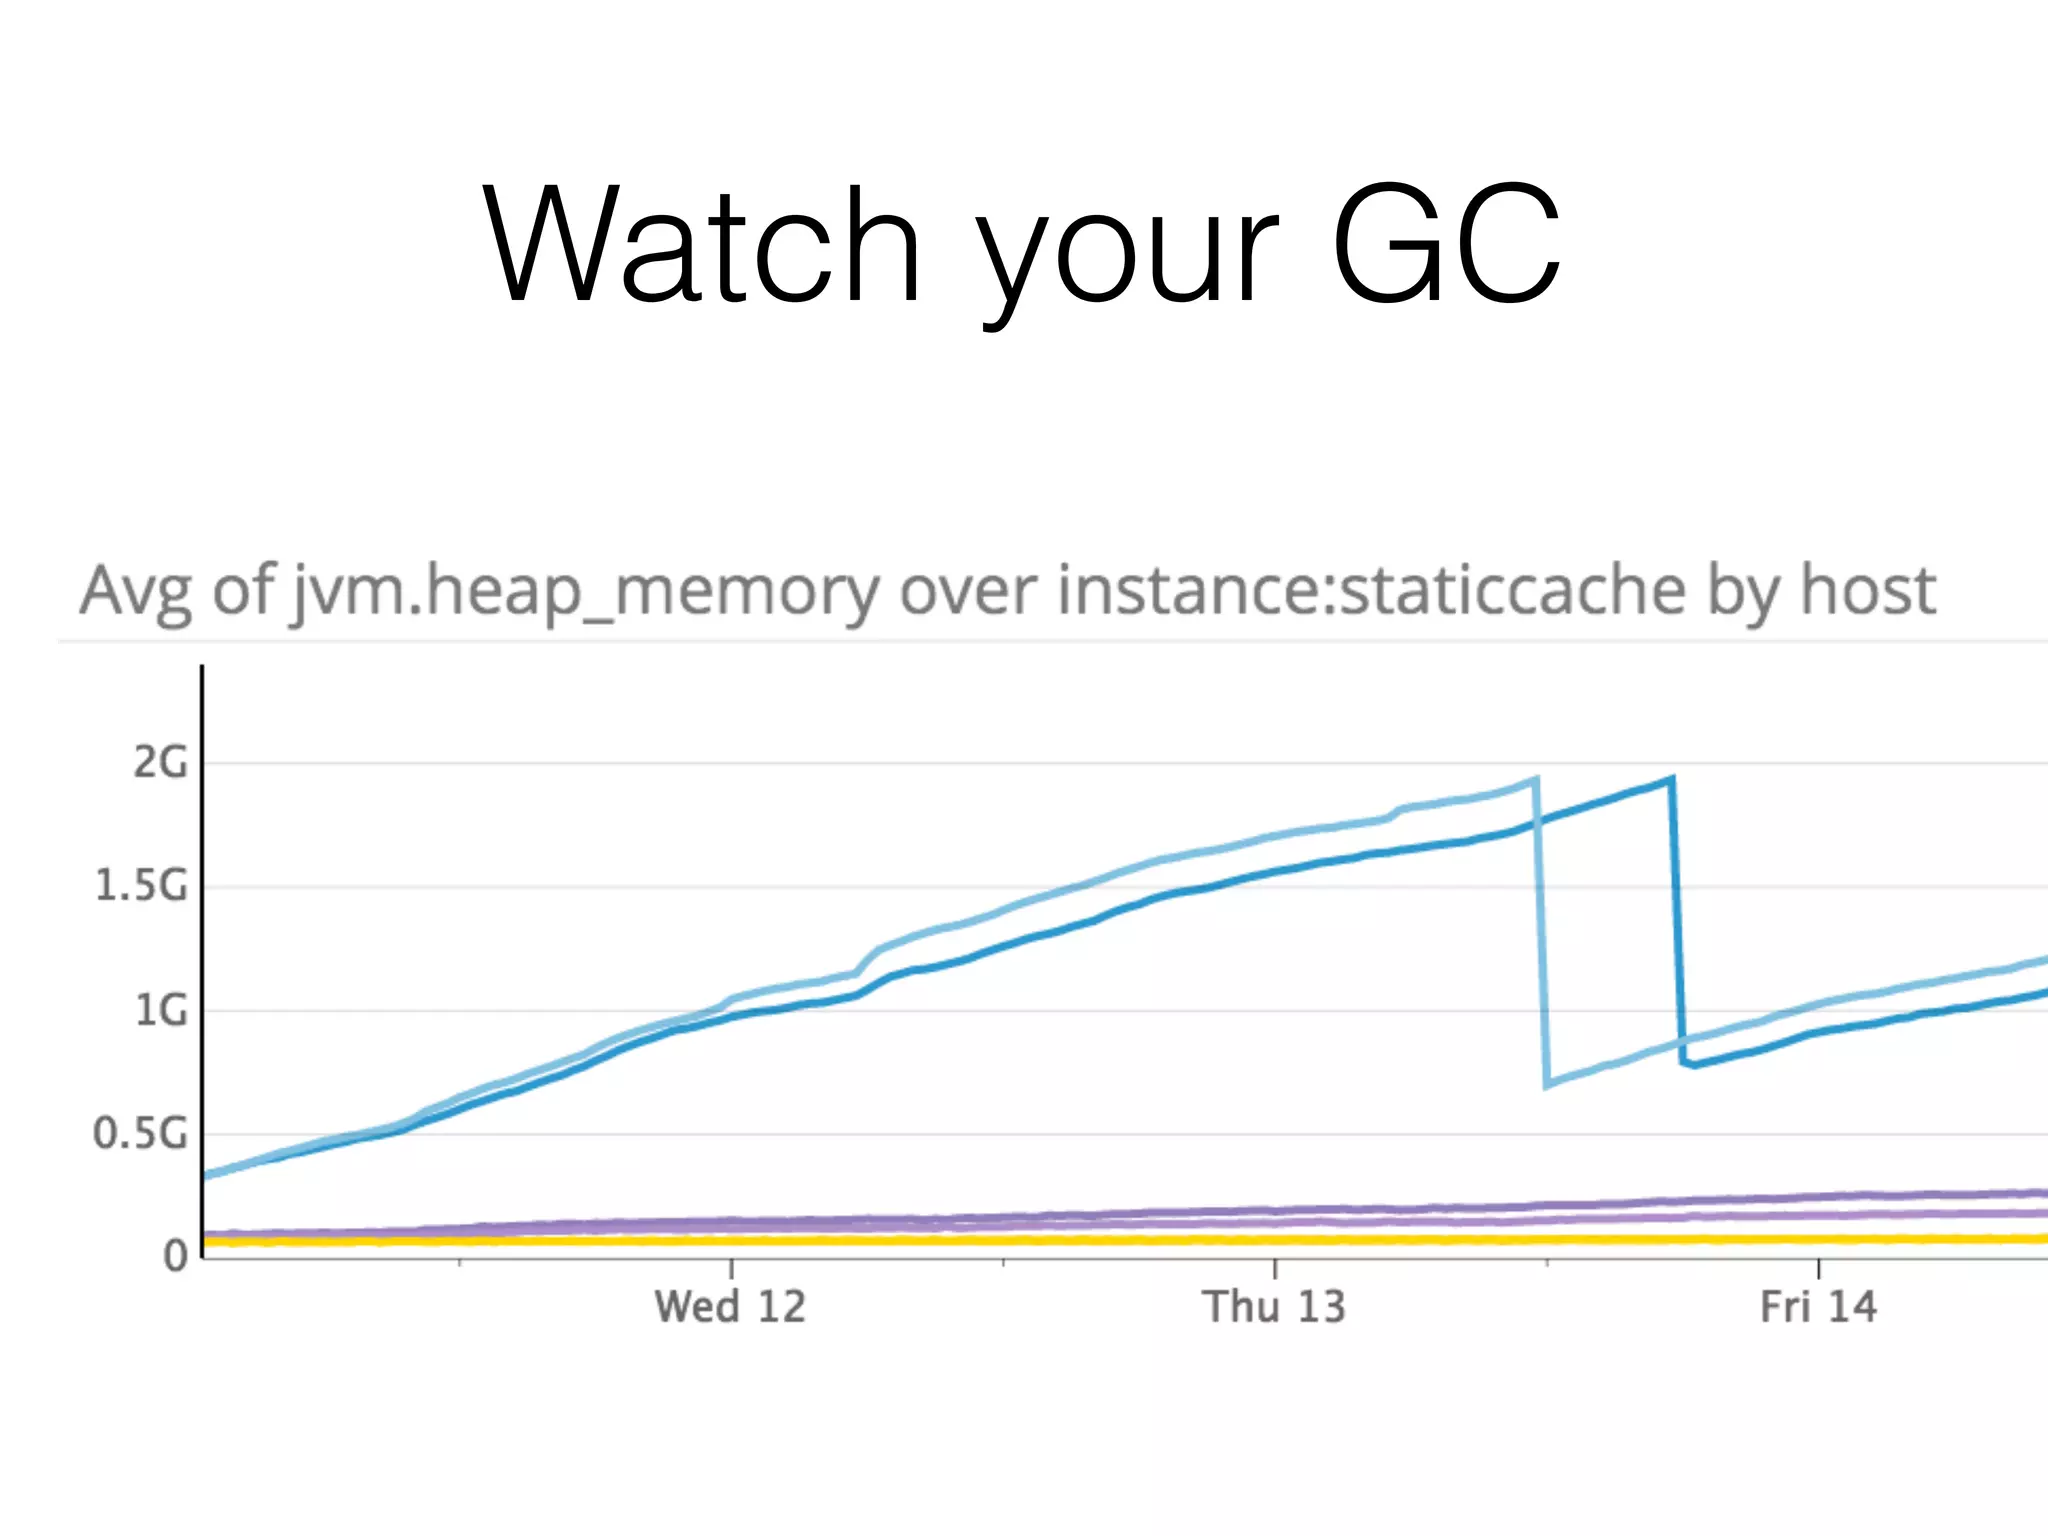


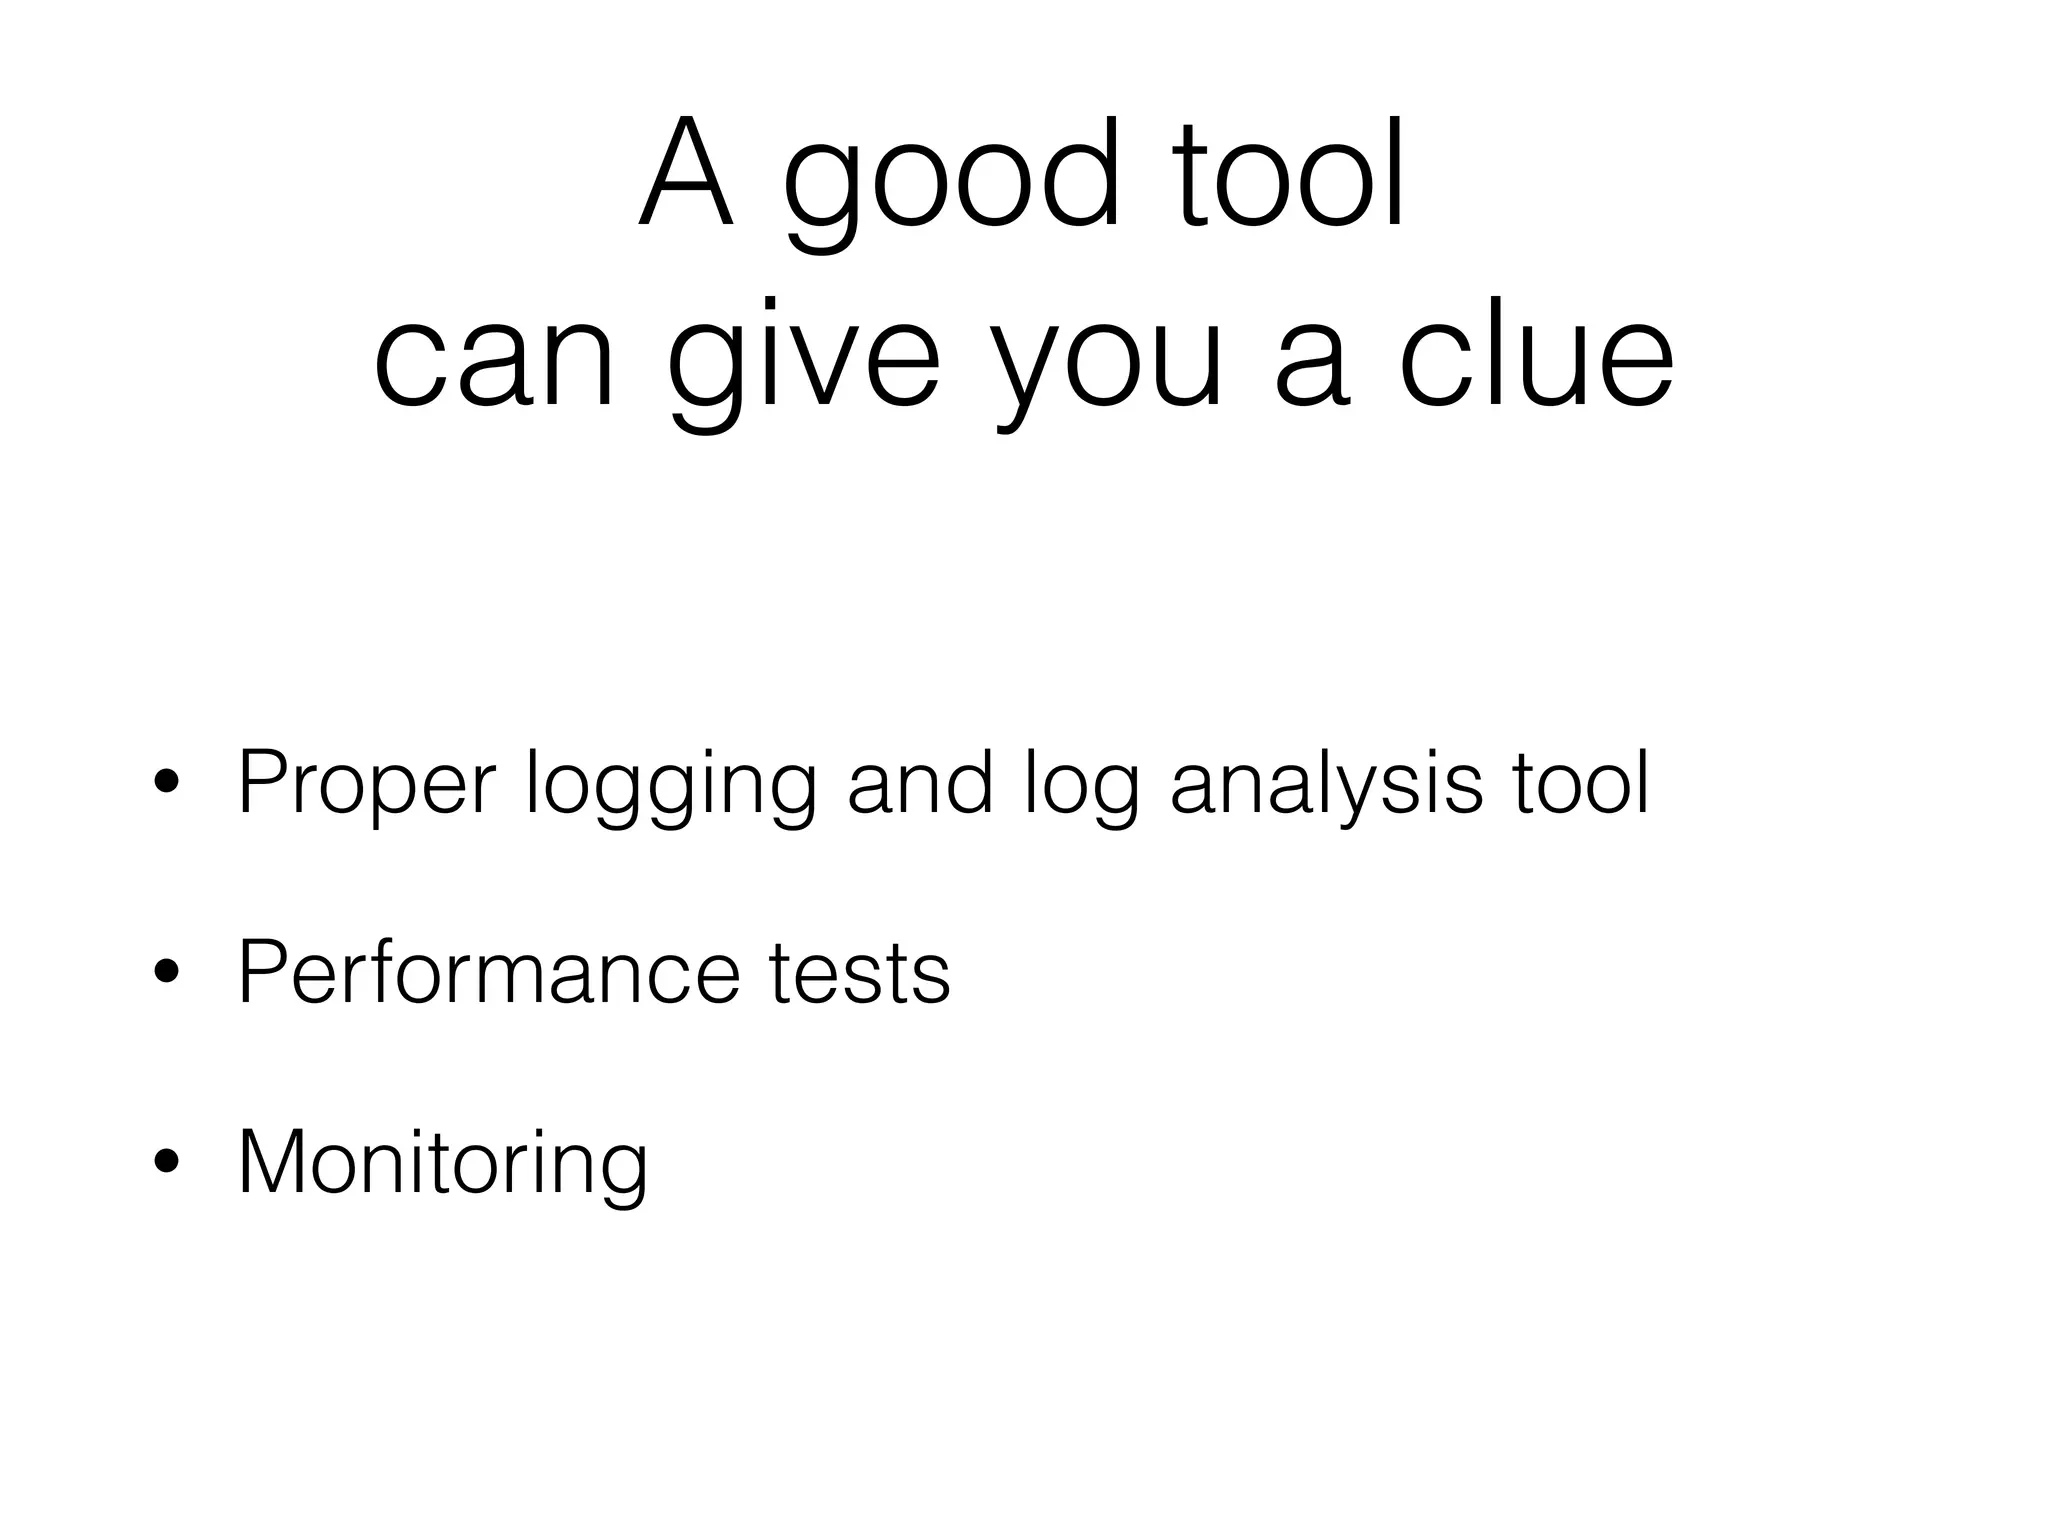
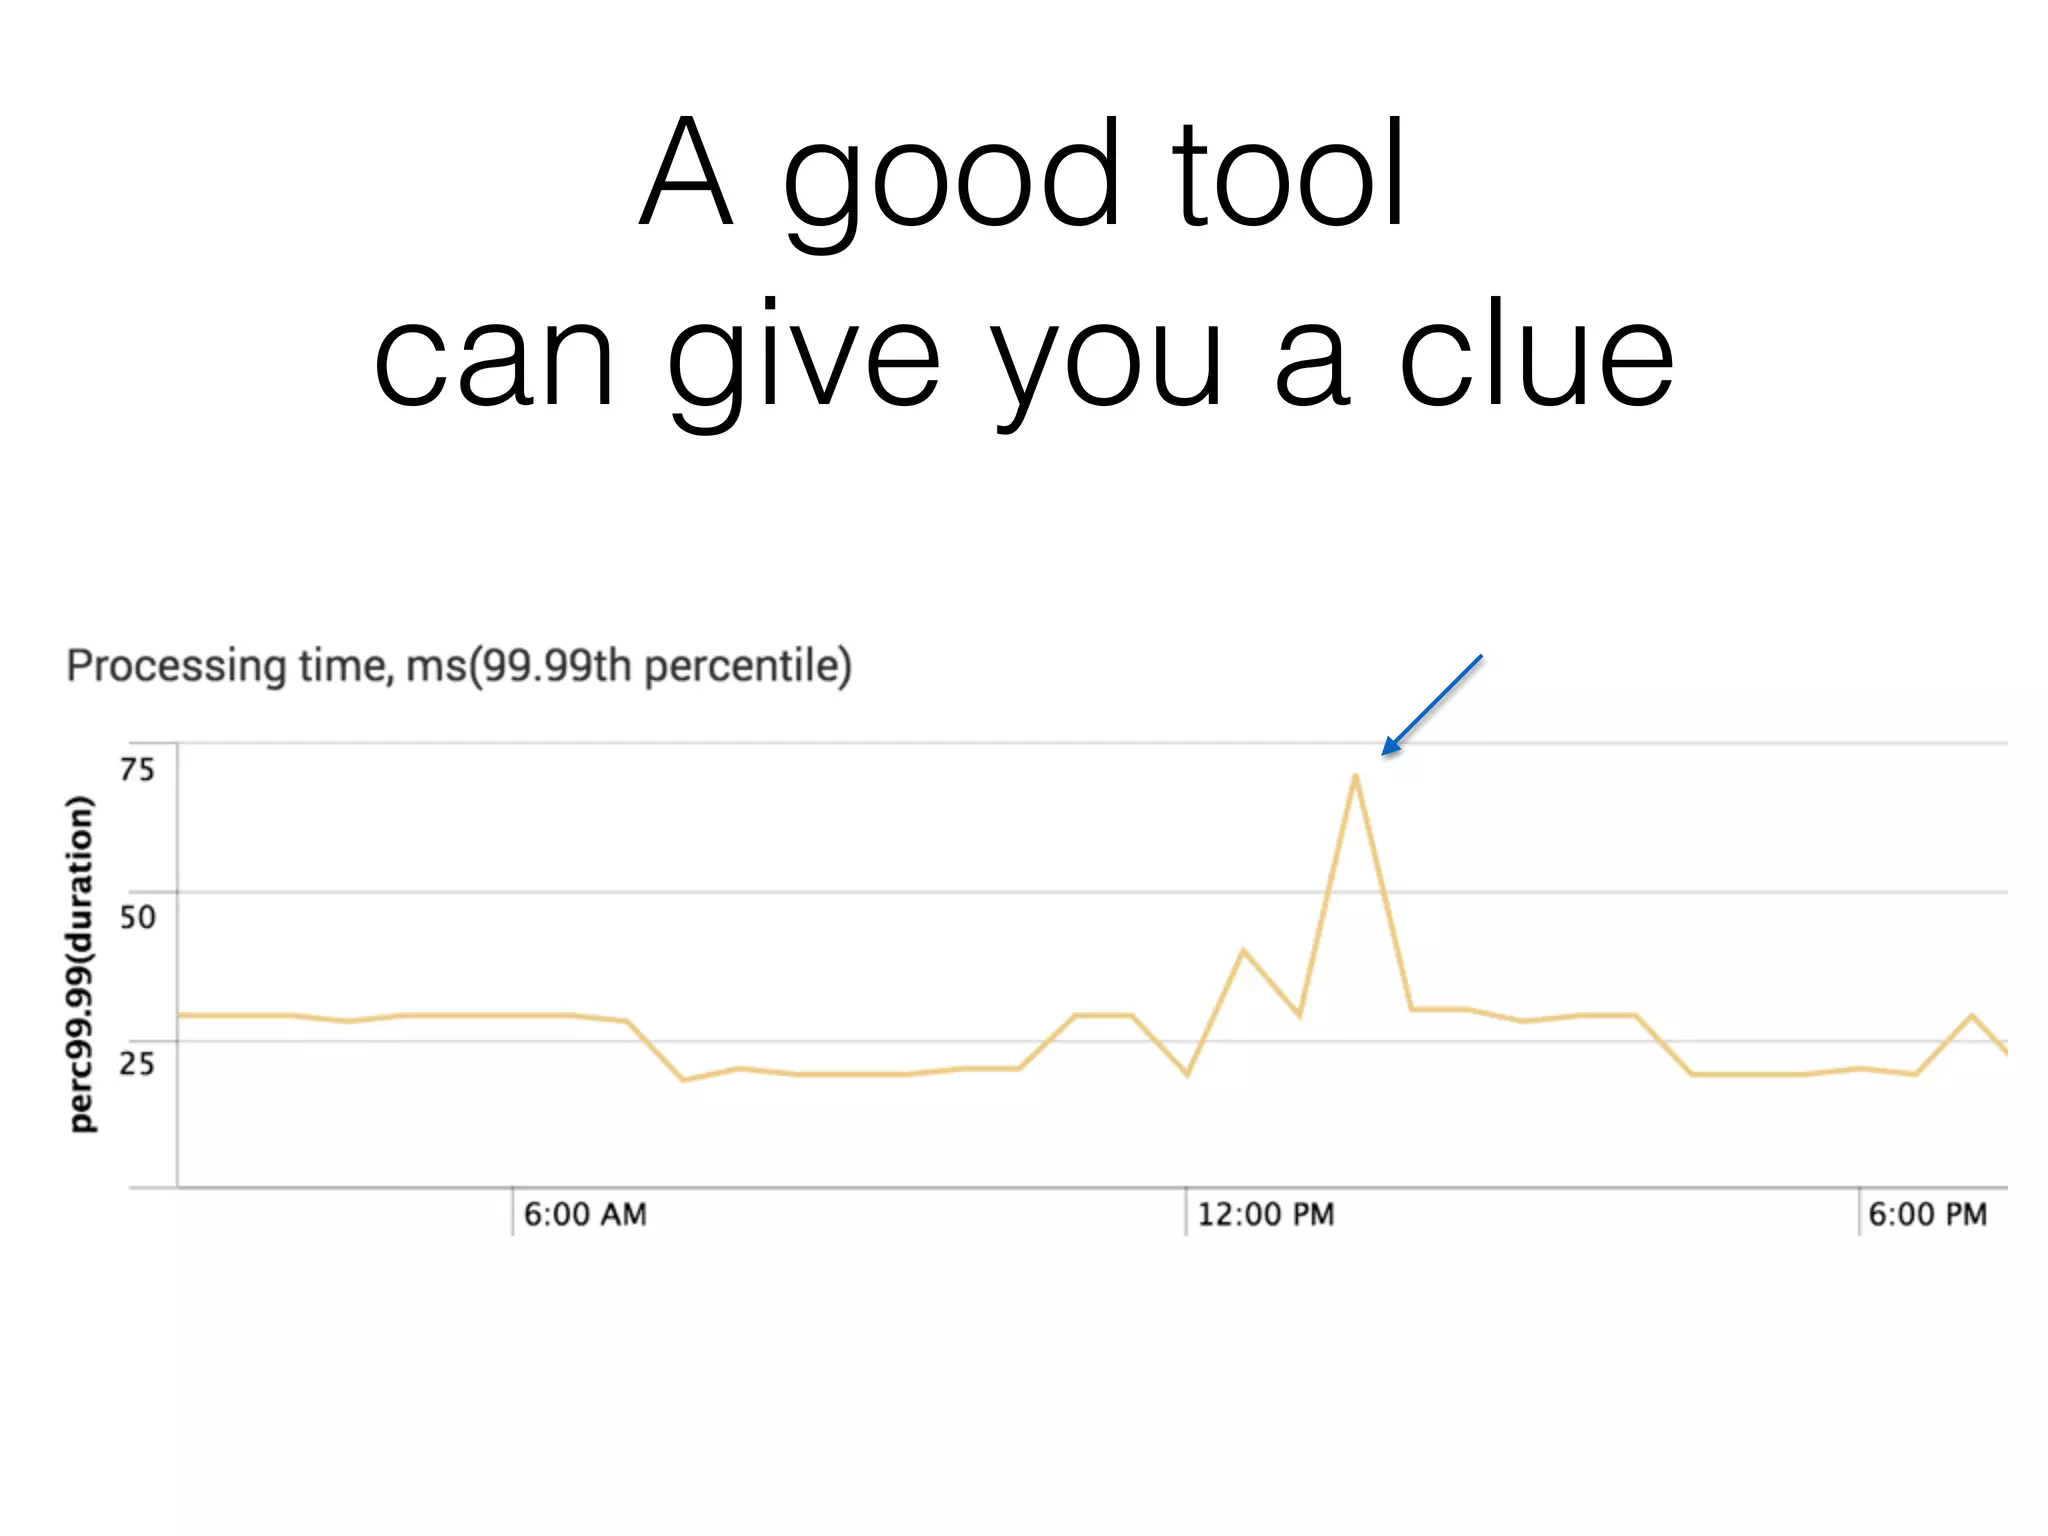
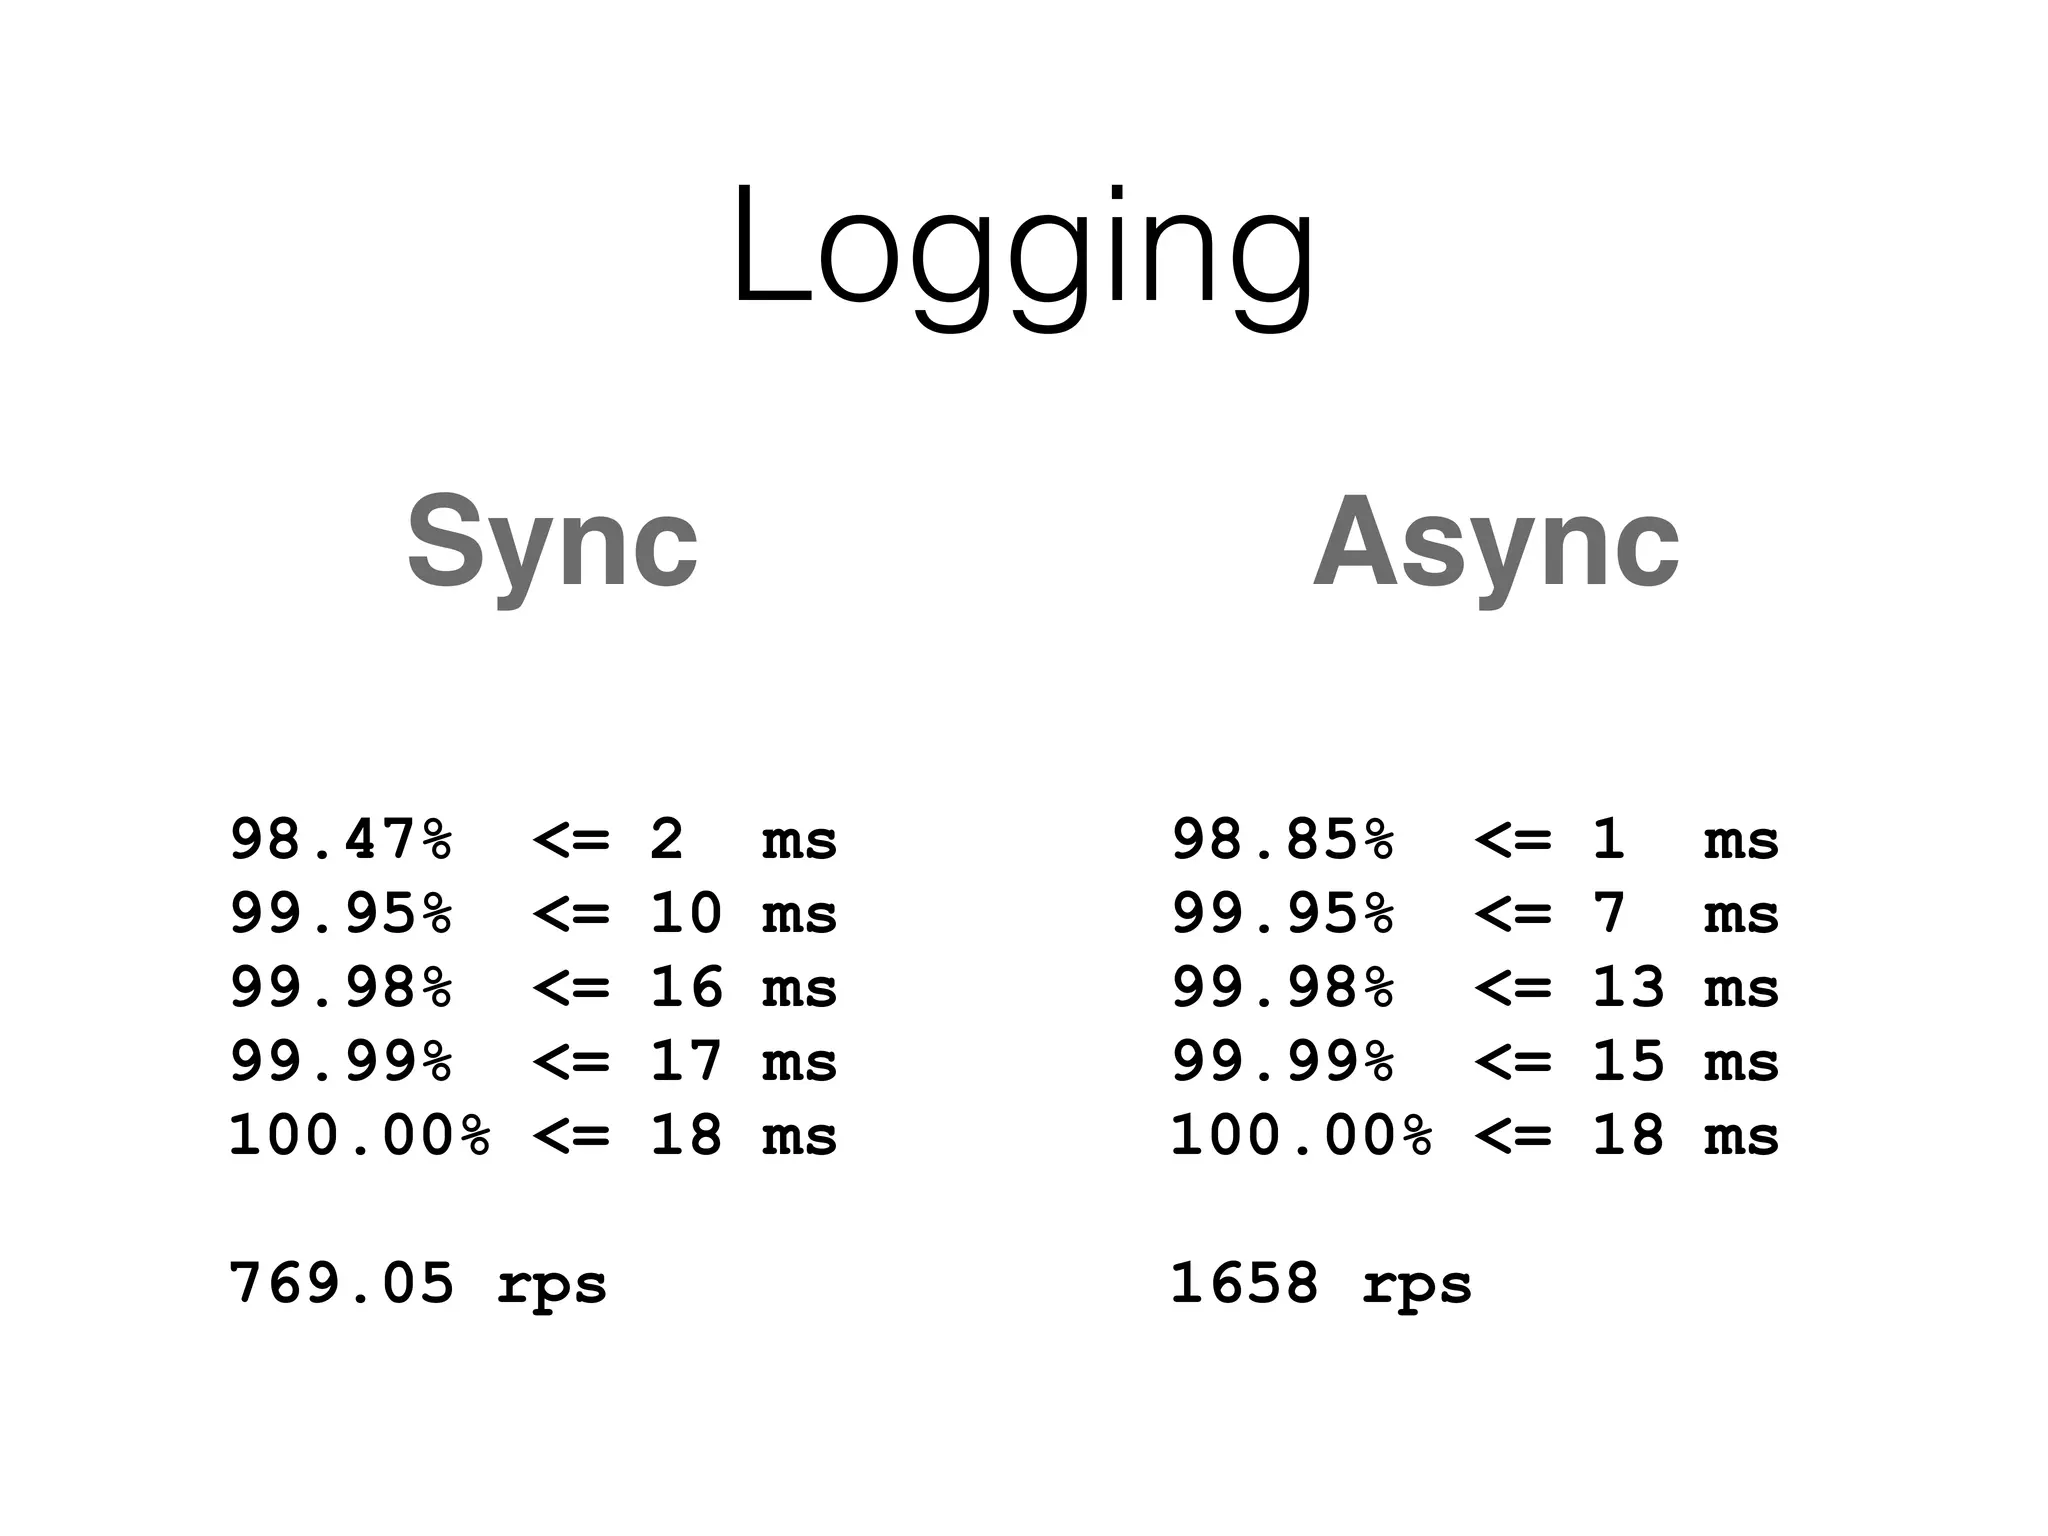
The document discusses the importance of latency in system architecture and its different measurement techniques. It highlights challenges related to context switching, memory overhead, and troubleshooting practices in improving latency performance. Additionally, it emphasizes the significance of monitoring tools, logging practices, and GC pauses in optimizing overall system response times.