Crude oil (WTI) prices have been in a long-term downtrend but may be poised for an upward correction. The daily chart shows oil rebounding from lows of $28.76 and $28.74 to form a sideways channel between $28.70-$36.30. A break above $36.30 could send prices to resistance around $42-$43. The weekly chart also shows positive divergence in the relative strength index signaling a near rebound. Technical indicators point to crude oil breaking out of its sideways trading range and targeting previous weekly lows around $41.93.
Chennai Petroleum: Expect strong upside in the coming months - Way2wealthIndiaNotes.com
The immediate resistance for the counter is placed at 114 level. A sustainable move above the same will result in a breakout from ‘Bullish Flag’ pattern along with the positive crossovers of ‘5 & 20 months EMA’. This might result in a very strong upside in the coming months.
1) TCS stock has been consolidating between price levels of 2770 and 2330 for the past 1.5 years. It has recently found support at the lower end of this range near 2330-2385.
2) Technically, TCS is forming a base within the 89 day exponential moving average band, which has historically provided support during corrections in an uptrend.
3) Candlestick patterns are showing a hammer candle, suggesting bullish presence at lower price levels, supported by increasing volume and rising RSI momentum.
The document provides a technical analysis of the QE Index and key Qatari stocks to consider, offering the following assessments:
1) The QE Index and Al Rayan Islamic Index are assessed as neutral in the short-term after recent declines, with support and resistance levels identified.
2) Several stocks are assessed as experiencing a short-term pull back, including Gulf International Services, Qatar Electricity & Water Co., Masraf Al Rayan, and Mazaya Qatar Real Estate Development. Technical indicators are pointing downward and further declines are expected.
3) Historical trends, support and resistance levels are provided for 19 Qatari stocks across various sectors.
Multi Act India's review of SENSEX 2015. We affirm that the market should consolidate around 27,500 which is the mid-band of our valuation range and also close to the “end of year” estimate of our trend (27,400) of the Sensex quantitative analysis.
Website - http://multi-act.com/
Contact Us - http://multi-act.com/contact
The document provides a technical analysis of the QE Index, Al Rayan Islamic Index, and key Qatari stocks. It analyzes the short-term and long-term trends, and identifies support and resistance levels. Masraf Al Rayan, Vodafone Qatar, and Industries Qatar are highlighted as stocks that may bounce back, continue rising, or pull back, respectively, based on their technical indicators and recent price movements. The analysis also includes a table summarizing the trends, support levels, and resistance levels of various stocks.
Reliance Industries Limited (RIL) is an Indian conglomerate holding company headquartered in Mumbai, Maharashtra. It owns businesses across India engaged in energy, petrochemicals, textiles, natural resources, retail and telecommunications. RIL is the most profitable company in India and the second largest by revenue. It contributes approximately 20% of India's total exports. The document provides a technical analysis of RIL stock, recommending it as a buy based on the stock breaking resistance levels and momentum indicators still being below overbought levels, with upside potential to 1260.
The document provides a technical analysis of the QE Index and key stocks to consider in Qatar. It analyzes the short-term trends and identifies support and resistance levels. The QE Index is seen to be in a short-term pull back with support at 9,700. Most of the stocks mentioned like Qatari Investors Group, Al Rayan Islamic Index, Widam Food Co., and Ooredoo are also seen to be in a short-term pull back. Milaha is the only stock expected to bounce back in the short-term. The analysis provides price targets and technical indicators like moving averages, RSI, and MACD to determine the short-term trends.
The document provides a technical analysis of the QE Index and key Qatari stocks to consider. It finds that the QE Index ended lower, breaking below important support levels. Several stocks like Milaha and Gulf International Services are expected to rebound in the short term, while others such as Qatar International Islamic Bank and Mazaya Qatar Real Estate Development are seen pulling back further. Overall, most of the indexes and stocks analyzed are seen trading in a neutral or downward trend in the short term.
Gold prices were buoyed by global political tensions while copper prices came off from early highs as the strengthening US dollar depressed market sentiment. Nickel fell sharply to its lowest level due to the stronger dollar. Oil prices edged higher due to tightening supplies from looming Iran sanctions, but trade tensions weighed on further gains. The report recommends a short position on MCX crude oil futures below Rs. 4,600 levels.
The document provides a technical analysis of the QE Index and key Qatari stocks to consider, analyzing their short-term trends. For the QE Index, it notes the index gained for the third consecutive session but remains in subdued mode, needing to break above 13,700 to extend its rally. Several stocks are analyzed as well, with most noted to be in uptrends supported by technical indicators like the RSI and MACD, while one stock, UDCD, is seen as potentially pulling back further. Contact information is provided on page 2.
The document provides a technical analysis of the QE Index, key Qatari stocks, and indices to consider for short-term trading. For the QE Index, it notes the index fell but stayed above an important support level of 13,050. For Medicare Group, it bounced back above a support level and may test resistance at QR126.50. The QERI Index gained slightly and is moving sideways between support and resistance levels. Gulf International Services cleared a resistance and its indicators suggest further upside potential to a target of QR119.50. Qatar Insurance cleared an important resistance and may advance to test QR94.80. Milaha continued its bullish momentum and may extend gains to QR96.50.
The document provides a technical analysis of the GBPINR currency pair. It summarizes that:
1) The GBPINR pair has given a negative breakout below key support lines and moving averages, indicating a weakening long-term trend.
2) Technical indicators like the RSI suggest further downside potential for the pair to reach support levels between 95.25 to 94.20.
3) The analysis recommends selling the GBPINR pair at current levels with a target of 95.25 and stop loss of 98.40.
Weekly Technical Report :10 February 2020Axis Direct
The document provides technical analysis and recommendations for 5 stocks - CMP: 490, CMP: 496, CMP: 404, CMP: 238, CMP: 204. For each stock, it provides the current market price, recommended buy range, stop loss level, and potential upside. The technical rationale for each stock includes factors like pattern breakouts, support levels, and momentum indicators suggesting further upside.
The document provides a technical analysis of the QE Index and key Qatari stocks to consider, offering the following assessments:
- The QE Index is trading close to support at the 21-day moving average and may decline further if it breaches this level, or advance higher if it holds above.
- United Development Co. breached a key support and may correct further to test the 21-day moving average.
- The QERI Index slipped marginally but needs to hold the 21-day moving average to avoid additional falls.
- Widam Food Co. and Gulf International Services penetrated below key supports and may drift lower, while Industries Qatar rebounded after testing support.
The QE Index closed down 1.09% near its lowest point, indicating further weakness. Technical indicators support this view. Qatar Insurance jumped 4.03% forming a bullish pattern suggesting further strength. The QERI index closed near its low suggesting it may fall further with technical indicators trending lower. Qatar International Islamic Bank slipped further after a bearish pattern but held a support level, remaining weak on technical indicators. Masraf Al Rayan broke a support level and fell below its moving average, remaining in a downtrend according to technical indicators.
Systemic Risk in the Asset Management Industry - Michael Mendelson, Principal, AQR Capital Management
Presented at the AQR Asset Management Institute conference, Perspectives: Systemic Risk in Asset Management held on 26 April 2017 at London Business School.
The document provides a technical analysis of INDIACEM stock and recommends a short position. It notes that the stock has formed a long bearish candlestick pattern showing strong bearishness. It is trading below short, medium, and long term moving averages indicating bearish trends. The stock has been in a lower top, lower bottom formation and RSI is below average with negative crossovers, signaling negative momentum. Based on this technical analysis, further downside movement is expected in the next few trading sessions.
The document provides a technical analysis of the QE Index and key Qatari stocks to consider. For the QE Index, the analysis provides a short-term neutral outlook as the index retreated after failing to move above 13,200 and has support at 13,080. Commercial Bank of Qatar is given a short-term rebound outlook as the stock bounced back after selling pressure and cleared resistances. Al Rayan Islamic Index is given a short-term neutral outlook as it fell on profit taking but support exists at 4,445.
The document provides a technical analysis of the QE Index and key Qatari stocks to consider, offering the following assessments:
- The QE Index gained slightly but may continue advancing if it breaks resistance at 9,850, otherwise it could fall back to support at 9,800.
- Qatar Islamic Bank gained after forming a bullish pattern and may rise to QR69.0 but faces resistance at QR68.91, while the Al Rayan Islamic Index fell slightly below its moving average in a sign of weakness.
- Barwa Real Estate tested support and bounced back, potentially advancing to resistance at QR26.10, while Mazaya Qatar looks set to test support at QR11.60 but
The document provides a technical analysis of Techno Buy stock. It summarizes that the stock is showing bullish reversal signals on its weekly chart and is trading above its 200-day moving average, indicating strength. The stock also finds support at the 65 level from a horizontal trend line. Technical indicators like RSI are also pointing to positive momentum. Based on this technical structure, an upside movement in the stock is expected in the coming trading sessions. The analyst recommends buying the stock between Rs. 72.70-71.10, with a stop loss of Rs. 65 and target of Rs. 85.
Petronet LNG Ltd is an Indian oil and gas company formed by the government of India to import liquefied natural gas (LNG) and set up LNG terminals in the country. It is a joint venture company promoted by the Gas Authority of India Limited (GAIL), Oil and Natural Gas Corporation Limited (ONGC), Indian Oil Corporation Limited (IOC) and Bharat Petroleum Corporation Limited (BPCL) with an authorised capital of 1200 crores (US$240 million).
The document provides a technical analysis of the QE Index and key Qatari stocks to consider, offering the following assessments:
- The QE Index is assessed as neutral in the short-term as it closed near 13,700 after early gains frittered away. It may consolidate before its next upmove.
- United Development Co. is assessed as an upmove in the short-term as it breached resistance and formed a bullish candlestick pattern, supporting a continued upmove.
- The QERI Index is assessed as neutral in the short-term as it reversed from tagging a new high, but its uptrend remains intact as long as it stays above 4,600.
- Qatar
The document provides a technical analysis of the QE Index and key Qatari stocks to consider. It analyzes short-term trends and identifies several stocks as potentially pulling back in the short-term, including the QE Index, United Development Co., Al Rayan Islamic Index, Widam Food Co., National Leasing Holding Co., and others. It also identifies Mazaya Qatar Real Estate Development as potentially bouncing back in the short-term. The analysis provides support and resistance levels for the stocks and indexes discussed.
QNBFS Daily Technical Trader - Qatar for November 26, 2017QNB Group
We have updated our support levels to
7,700 then 7,570. As a result, it is crucial to stay above the 7,700 which the daily RSI and Histogram both look positive.
The document provides a technical analysis of the QE Index and key Qatari stocks, recommending short-term downmoves. It notes the QE Index and QERI Index fell over the last two days, nearing resistance and exhibiting buyer exhaustion. Several stocks like CBQK, QIIK and WDAM breached supports and show weakening trends and momentum on indicators. The analysis recommends watching for further declines and tests of defined support levels for these and other stocks like BRES in the short-term.
The document provides a technical analysis of the QE Index and key Qatari stocks to consider. It analyzes several indices and stocks and provides short-term outlooks and price targets. For most, it predicts a potential short-term bounce back and recovery. It identifies support and resistance levels and analyzes technical indicators like RSI and MACD to make its predictions. The analysis is intended to help investors identify trading opportunities over the next 1-3 weeks.
- MCX Gold and Silver prices have broken out of technical patterns indicating further upside potential. Gold is expected to move towards 29350 levels and Silver towards 43200 levels.
- MCX Copper price has broken out of a horizontal channel suggesting prices could rise to 413 levels. However, MCX Crude Oil has broken down from a rising trend line, pointing to lower prices around 3480 levels.
- The US Federal Reserve Chair reiterated that further interest rate hikes will be data dependent but markets adjusted to a slightly more hawkish outlook with higher odds of a rate rise in March.
The document provides a technical analysis of the QE Index and key Qatari stocks. It finds that in the short-term, the QE Index and most mentioned stocks are in a downtrend based on indicators such as falling below supports, diverging momentum signals, and downward moving averages. Specifically, the QE Index, Nakilat, QE Al Rayan Islamic Index, Doha Bank, Qatar Electricity & Water Co., Gulf International Services, and Milaha are expected to continue their short-term downtrend. Support and resistance levels are identified for each to inform possible reversal points.
The Tadawul's Banks & Financial Services Index (TBFSI) in Saudi Arabia has been in a downtrend since August 2014, dropping 38%, but may now be bottoming out. There are signs of a potential rebound, as the RSI diverged positively from prices and crossed above 30, indicating a buy signal. Volume has also risen during the last downleg, signaling strong buying power. The sector is expected to rise with the first target being 16,400.
Weekly Technical Report :06 January 2020Axis Direct
Axis Direct presents daily derivatives report presenting recommendations based on technical analysis. For trading in derivatives visit https://simplehai.axisdirect.in/offerings/products/derivatives
The stock price of Sixth of October for Development and Investment (OCDI.EGX) has declined around 60% since 2012 and formed a bearish pattern, reaching a strong support level. While indicators show oversold conditions and weakening bearishness, the downtrend remains intact on the daily chart. The analysis concludes OCDI may witness a bottom soon and recommends intermediate and long term investors to gradually accumulate the stock.
Palm Hills Developments (PHDC.EGX) stock has formed a double bottom reversal pattern after reaching its lowest level in April and mid-May, indicating the downtrend may be reversing. The stock broke above the neckline at 2.96 with strong volume, fulfilling the pattern. Analysts now believe the trend has reversed and have price targets of 3.50 as the minimum objective and 3.85 for the stock.
MCX Crude Oil prices have been trading in an upward channel pattern for months and have found support at the lower band of 3142 levels. NYMEX WTI Crude Oil prices have taken support at their rising trend line of $47.10 and Fibonacci retracement level of $47.12. Momentum indicators also show crude oil prices are not oversold. Based on this technical analysis, crude oil prices are expected to rally to 3610 levels.
Weekly Technical Report :24 February 2020Axis Direct
The document provides technical analysis on four stocks - Ashok Leyland, Aditya Birla Fashion and Retail, Voltas, and AIA Engineering. For each stock, it provides the current market price, recommended buy range, stop loss, and potential upside. The technical rationale for each stock focuses on chart patterns like up-sloping channels, rounding bottoms, and breakouts that indicate sustained uptrends. Daily and weekly technical indicators are also cited as supporting continued upside momentum in the near term.
The document provides a technical analysis of MCX Crude Oil prices. It summarizes that MCX Crude Oil has broken out of a falling wedge pattern and is supported by its rising trend line, indicating a medium-term bullish trend. Crude oil prices have also taken support at a key Fibonacci retracement level. Technical indicators like MACD and RSI also show positive signals. Based on the technical setup, the analyst expects MCX Crude Oil prices to rise towards 3512 levels in the coming trading sessions. The recommendation is to buy Crude Oil futures at 3142 with a stop loss of 2960 and target of 3512.
Weekly Technical Report :20 January 2020Axis Direct
The document provides technical analysis and recommendations for buying four Indian stocks - L&T Finance Holdings, Ajanta Pharma, Radico Khaitan, and Escorts. For each stock, it gives the current market price and recommended buy range, stop loss level, and estimated upside potential over the next 6-12 months. The analysis is based on chart patterns like inverse head and shoulders formations and channel and resistance breakouts that indicate trend reversals and momentum shifts suggesting further price increases in the near term. Technical indicators like RSI, stochastic, and sustained levels above moving averages also support the bullish views.
Weekly Technical Report:04 November 2019Axis Direct
The document provides technical analysis and trading recommendations for four stocks - CMP:1024, IPCA Laboratories Ltd, Bajaj Finserv Ltd, and Tata Chemicals Limited. For each stock, it outlines the current price, recommended buy range, stop loss level, and expected upside percentage. It then provides the technical rationale for the recommendation, noting chart patterns like breakouts from consolidation ranges or descending channels, and indicators being in positive territory to support continued upside momentum. The analysis indicates upside price targets for each stock.
Pioneers Holding (PIOH.EGX) is rebounding from a downtrend and starting an upward trend, according to a technical analysis. The stock broke above a key resistance level of 9.73 on high volume, completing a double bottom pattern and indicating an upward wave towards targets of 11.00 and then 11.50. The report provides disclosure appendices on analyst ratings, target prices, disclaimers, and information about the issuer.
- The stock price had risen multi-fold to 250 but has since corrected and fallen to a support level of 78.2% retracement of the previous rise, forming a base.
- The stock broke out of a wedge pattern on the daily chart, signaling a reversal of the downward trend. It has also formed a double bottom pattern at the 72 level.
- Volume has expanded during the consolidation phase, indicating high activity, which is typically a positive sign for the stock.
- The RSI momentum oscillator is at an oversold level of 27, suggesting potential for a reversal, and it has broken above its average line.
- Based on the technical factors, the stock price is expected to rise
The document provides a technical analysis of the EURINR currency pair and recommends a short position. Specifically:
- On monthly and weekly charts, EURINR has formed bearish candlestick patterns indicating the trend may reverse lower. It has resistance at 77.40 levels.
- The currency pair has broken below a lower rising wedge formation and its 21-day moving average, signaling a change from positive to negative trend.
- Momentum indicators like RSI show negative momentum.
- Based on the technical factors, the currency pair is expected to move lower over the near future trading sessions. The analyst recommends a short sell of EURINR at 75.25-75.65 with
The document provides a technical analysis of a stock to recommend it as a buy. It summarizes that the stock has strong support at 54-55 levels based on past performance. Daily and weekly candlestick patterns also indicate potential bullish reversal and upside movement to 67-70 levels. Multiple technical indicators like the daily RSI and Fibonacci retracement levels further support upside potential for the stock to reach 65-67 levels. Based on this technical structure, the analyst recommends buying the stock between Rs. 59-57.80 with a stop loss of Rs. 55 and target of Rs. 67.
Weekly Technical Report :17 February 2020Axis Direct
Axis Direct presents daily derivatives report presenting recommendations based on technical analysis. For trading in derivatives visit https://simplehai.axisdirect.in/offerings/products/derivatives
The document provides a technical analysis of MCX Crude Oil futures. It states that MCX Crude Oil has formed a "Bearish AB=CD Harmonic Pattern" at 3330 levels, as well as an "Evening Star" candlestick pattern and "Triple Top" bearish pattern, indicating further weakness. It also notes that momentum indicators like RSI are below overbought levels. Based on the technical analysis, it recommends selling Crude Oil futures at 3230-3270 with a stop loss of 3350 and target of 2750.
Axis Direct presents daily derivatives report presenting recommendations based on technical analysis. For trading in derivatives visit https://simplehai.axisdirect.in/offerings/products/derivatives
The document provides a technical analysis of VEDL stock. It summarizes that on hourly, daily, and weekly charts, the stock is facing resistance at various levels based on moving averages and Fibonacci retracement. Momentum indicators also point to negative momentum. Based on the technical analysis, it recommends selling VEDL in cash at Rs. 91 with a stop loss of Rs. 93.50 and target of Rs. 85.
The document summarizes technical analysis of a stock that has formed a double bottom pattern at Rs. 57, indicating support. The stock has moved above short and long-term moving averages, showing it has overcome hurdles. Recent price increases have seen rising volume, demonstrating buying interest. Momentum indicators also confirm an upward breakout. Based on the analysis, further upward movement of the stock to Rs. 86 is expected over the next few trading sessions.
Daily Derivatives Report:04 February 2020Axis Direct
Axis Direct presents daily derivatives report presenting recommendations based on technical analysis. For trading in derivatives visit https://simplehai.axisdirect.in/offerings/products/derivatives
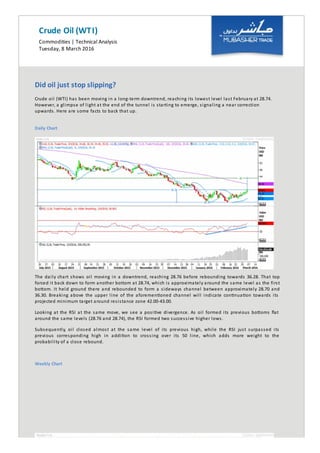
1. Crude Oil (WTI)
Commodities | Technical Analysis
Tuesday, 8 March 2016
Did oil just stop slipping?
Crude oil (WTI) has been moving in a long-term downtrend, reaching its lowest level last February at 28.74.
However, a glimpse of light at the end of the tunnel is starting to emerge, signaling a near correction
upwards. Here are some facts to back that up.
Daily Chart
The daily chart shows oil moving in a downtrend, reaching 28.76 before rebounding towards 36.28. That top
forced it back down to form another bottom at 28.74, which is approximately around the same level as the first
bo om. It held ground there and rebounded to form a sideways channel between approximately 28.70 and
36.30. Breaking above the upper line of the aforemen oned channel will indicate con nua on towards its
projected minimum target around resistance zone 42.00-43.00.
Looking at the RSI at the same move, we see a posi ve divergence. As oil formed its previous bo oms flat
around the same levels (28.76 and 28.74), the RSI formed two successive higher lows.
Subsequently, oil closed almost at the same level of its previous high, while the RSI just surpassed its
previous corresponding high in addi on to crossing over its 50 line, which adds more weight to the
probability of a close rebound.
Weekly Chart
2. The weekly chart shows the long-term downtrend, recording its lowest level at 28.74 last February. However,
signs of a possible correc on started to materialize when the RSI started to divert by making higher lows,
while oil kept heading north.
As shown above, the first bo om was around Q1 2015; the second was in Q3 2015; and the third was the latest
bottom recorded last February. All the while, the RSI kept recording higher corresponding lows.
No ce also how the RSI rebounded off of its uptrend towards its previous high, indica ng a near rebound for
the oil as well. But not to put the wagon before the horse and say the oil is targe ng its previous top,
targeting its previous weekly bottom at 41.93 would suffice for now.
Conclusion
Crude oil (WTI) is set for a good correc on, breaking free from the price sideways channel to the upside
towards resistance zone 42.00-43.00, backed up by posi ve RSI divergence on both daily and weekly me
frames.
Mona Hassan, CFTe
Senior Technical Analyst
Mubasher International
Mona.Hassan@MubasherFS.com
3. Disclosure Appendix
Important Disclosures Methodology The consensus ra ngs and target prices are based on the last three months. Analyst
ra ngs sta s cs chart is based on recommenda ons made by third-party analysts during the last 12 months. We do not
a ach a consensus ra ng (i.e. "na" or "not applicable/available" if 1) a consensus target price has not been updated over
the last three months or 2) the company is not rated or covered by any third-party analyst. Other Disclosures MFS does not
have any proprietary holding in any securi es. Only as a nominee, MFS holds shares on behalf of its clients through
Omnibus accounts. MFS is not currently a market maker for any listed securities.
Analyst Certification
I (we) Mona Hassan, Senior Technical Analyst, employed with Mubasher Interna onal, a company under the Na onal
Technology Group of Saudi Arabia being a shareholder of Mubasher Financial Services BSC (c) and author(s) of this report,
hereby cer fy that all the views expressed in this research report accurately reflect my (our) views about the subject
issuer(s) or security(ies). I (we) also cer fy that no part of my (our) compensa on was, is or will be directly or indirectly
related to the specific recommenda on(s) or view(s) expressed in this report. Also, I (we) cer fy that neither myself
(ourselves) nor any of my (our) close relatives hold or trade into the subject securities.
Head ofResearch Certification
I, Amr Hussein Elalfy, Global Head of Research of Mubasher Financial Services BSC (c) confirm that I have ve ed the
informa on, and all the views expressed by the Analyst in this research report about the subject issuer(s) or security(ies). I
also cer fy that the author(s) of this report, has (have) not received any compensa on directly related to the contents of
the Report.
Disclaimer
This document is not and should not be construed as an offer to sell or the solicita on of an offer to purchase or subscribe
for any investment. Mubasher Financial Services BSC (c) ('MFS') has based this document on informa on obtained from
sources it believes to be reliable but which it has not independently verified; MFS makes no guarantee, representa on or
warranty and accepts no responsibility or liability as to its accuracy or completeness. The opinions contained within the
document are based upon publicly available informa on at the me of publica on and are subject to change without
no ce. This document is not intended for all recipients and may not be suitable for all investors. Securi es described in
this document are not available for sale in all jurisdic ons or to certain category of investors. The document is not
subs tu on for independent judgment by any recipient who should evaluate investment risks. Addi onally, investors
must regard this document as providing stand-alone analysis and should not expect con nuing analysis or addi onal
documents rela ng to the issuers and/or securi es men oned herein. Past performance is not necessarily a guide to
future performance. Forward-looking statements are not predic ons and may be subject to change without no ce. The
value of any investment or income may go down as well as up and you may not get back the full amount invested. Where an
investment is denominated in a currency other than the local currency of the recipient of the research report, changes in
the exchange rates may have an adverse effect on the value, price or income of that investment. In case of investments for
which there is no recognized market, it may be difficult for investors to sell their investments or to obtain reliable
informa on about its value or the extent of the risk to which it is exposed. References to ra ngs/recommenda ons are for
informa onal purposes only and do not imply that MFS adopts, supports or confirms in any way the
ra ngs/recommenda ons, opinions or conclusions of the analysts. This document is not directed or intended for
distribu on to, or use by, any person or en ty who is a ci zen or resident of or located in any locality, state, country, or
other jurisdic on where such distribu on, publica on, availability or use would be contrary to law, regula on or which
would subject MFS or its affiliates to any registra on or licensing requirements within such jurisdic on. MFS accepts no
liability for any direct, indirect, or consequen al damages or losses incurred by third par es including its clients from any
use of this document or its contents.
Issuer ofReport
Mubasher Financial Services BSC (c) is an Investment Business Firm Category 1, licensed and regulated by the Central Bank
of Bahrain.
Website: www.MubasherTrade.com
E-mail: Research@MubasherTrade.com
To unsubscribe or edit preferences please click here. For the types of reports to be received, please change your
preferences in your account at www.MubasherTrade.com.
Contact Details
INSTITUTIONALSALES
MENA
Inst.Sales@MubasherFS.com
+971 43211167 (UAE)
+965 97734334(Kuwait)
+962 795538806 (Jordan)
Egypt
Institutions-Egy@Mubasher.net
+202 22623310
RETAILSALES
Bahrain
Global@MubasherTrade.com
Call Center:
+973 800 567 000
Egypt
Egypt@MubasherTrade.com
Call Center:
16699 / +202 2262 3230
Libya
Libya@MubasherTrade.com
Call Center:
+2189 2307 0350
RESEARCH
Research Team
Research@MubasherTrade.com