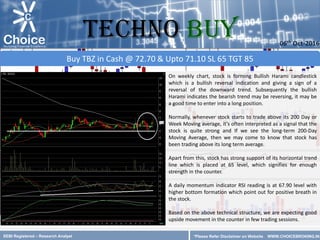
SEBI Registered – Research Analyst
*Please Refer Disclaimer on Website
On weekly chart, stock is forming Bullish Harami candlestick
which is a bullish reversal indication and giving a sign of a
reversal of the downward trend. Subsequently the bullish
Harami indicates the bearish trend may be reversing, it may be
a good time to enter into a long position.
Normally, whenever stock starts to trade above its 200 Day or
Week Moving average, it’s often interpreted as a signal that the
stock is quite strong and If we see the long-term 200-Day
Moving Average, then we may come to know that stock has
been trading above its long term average.
Apart from this, stock has strong support of its horizontal trend
line which is placed at 65 level, which signifies for enough
strength in the counter.
A daily momentum indicator RSI reading is at 67.90 level with
higher bottom formation which point out for positive breath in
the stock.
Based on the above technical structure, we are expecting good
upside movement in the counter in few trading sessions.
Buy TBZ in Cash @ 72.70 & Upto 71.10 SL 65 TGT 85
06th Oct-2016
TECHNO BUY
*Please Refer Disclaimer on Website WWW.CHOICEBROKING.IN
WWW.CHOICEBROKING.IN
Contact Us
Disclaimer
This is solely for information of clients of Choice Broking and does not construe to be an investment advice. It is also not intended as an offer or solicitation for the purchase and sale of any financial instruments. Any action taken by you on the basis of the
information contained herein is your responsibility alone and Choice Broking its subsidiaries or its employees or associates will not be liable in any manner for the consequences of such action taken by you. We have exercised due diligence in checking the
correctness and authenticity of the information contained in this recommendation, but Choice Broking or any of its subsidiaries or associates or employees shall not be in any way responsible for any loss or damage that may arise to any person from any
inadvertent error in the information contained in this recommendation or any action taken on basis of this information. Technical analysis studies market psychology, price patterns and volume levels. It is used to forecast future price and market movements.
Technical analysis is complementary to fundamental analysis and news sources. The recommendations issued herewith might be contrary to recommendations issued by Choice Broking in the company research undertaken as the recommendations stated in
this report is derived purely from technical analysis. Choice Broking has based this document on information obtained from sources it believes to be reliable but which it has not independently verified; Choice Broking makes no guarantee, representation or
warranty and accepts no responsibility or liability as to its accuracy or completeness. The opinions contained within the report are based upon publicly available information at the time of publication and are subject to change without notice. The information and
any disclosures provided herein are in summary form and have been prepared for informational purposes. The recommendations and suggested price levels are intended purely for trading purposes. The recommendations are valid for the day of the report
however trading trends and volumes might vary substantially on an intraday basis and the recommendations may be subject to change. The information and any disclosures provided herein may be considered confidential. Any use, distribution, modification,
copying, forwarding or disclosure by any person is strictly prohibited. The information and any disclosures provided herein do not constitute a solicitation or offer to purchase or sell any security or other financial product or instrument. The current performance
may be unaudited. Past performance does not guarantee future returns. There can be no assurance that investments will achieve any targeted rates of return, and there is no guarantee against the loss of your entire investment.
POTENTIAL CONFLICT OF INTEREST DISCLOSURE (as on date of report) Disclosure of interest statement – • Analyst interest of the stock /Instrument(s): - No. • Firm interest of the stock / Instrument (s): - No.
www.choiceindia.comcustomercare@choiceindia.com
Research Team
Mr. Sumeet Bagadia Associate Director
Kkunal Parar Sr. Research Associate
Amit Pathania Research Associate
Kapil Shah Research Associate
Vikas Chaudhari Research Associate
Rohan Patil Research Associate
Trirashmi Ghoderao Research Advisor
Neeraj Yadav Research Advisor
06th Oct-2016
TECHNO BUY
Kunal Parmar
Digitally signed by Kunal Parmar
DN: cn=Kunal Parmar, o=Choice Equity Broking Pvt Ltd.,
ou=Research Dept, email=kunal.parmar@choiceindia.com,
c=IN
Date: 2016.10.06 15:11:08 +05'30'

Techno buy tbz 06102016

  • 1.
    SEBI Registered –Research Analyst *Please Refer Disclaimer on Website On weekly chart, stock is forming Bullish Harami candlestick which is a bullish reversal indication and giving a sign of a reversal of the downward trend. Subsequently the bullish Harami indicates the bearish trend may be reversing, it may be a good time to enter into a long position. Normally, whenever stock starts to trade above its 200 Day or Week Moving average, it’s often interpreted as a signal that the stock is quite strong and If we see the long-term 200-Day Moving Average, then we may come to know that stock has been trading above its long term average. Apart from this, stock has strong support of its horizontal trend line which is placed at 65 level, which signifies for enough strength in the counter. A daily momentum indicator RSI reading is at 67.90 level with higher bottom formation which point out for positive breath in the stock. Based on the above technical structure, we are expecting good upside movement in the counter in few trading sessions. Buy TBZ in Cash @ 72.70 & Upto 71.10 SL 65 TGT 85 06th Oct-2016 TECHNO BUY *Please Refer Disclaimer on Website WWW.CHOICEBROKING.IN
  • 2.
    WWW.CHOICEBROKING.IN Contact Us Disclaimer This issolely for information of clients of Choice Broking and does not construe to be an investment advice. It is also not intended as an offer or solicitation for the purchase and sale of any financial instruments. Any action taken by you on the basis of the information contained herein is your responsibility alone and Choice Broking its subsidiaries or its employees or associates will not be liable in any manner for the consequences of such action taken by you. We have exercised due diligence in checking the correctness and authenticity of the information contained in this recommendation, but Choice Broking or any of its subsidiaries or associates or employees shall not be in any way responsible for any loss or damage that may arise to any person from any inadvertent error in the information contained in this recommendation or any action taken on basis of this information. Technical analysis studies market psychology, price patterns and volume levels. It is used to forecast future price and market movements. Technical analysis is complementary to fundamental analysis and news sources. The recommendations issued herewith might be contrary to recommendations issued by Choice Broking in the company research undertaken as the recommendations stated in this report is derived purely from technical analysis. Choice Broking has based this document on information obtained from sources it believes to be reliable but which it has not independently verified; Choice Broking makes no guarantee, representation or warranty and accepts no responsibility or liability as to its accuracy or completeness. The opinions contained within the report are based upon publicly available information at the time of publication and are subject to change without notice. The information and any disclosures provided herein are in summary form and have been prepared for informational purposes. The recommendations and suggested price levels are intended purely for trading purposes. The recommendations are valid for the day of the report however trading trends and volumes might vary substantially on an intraday basis and the recommendations may be subject to change. The information and any disclosures provided herein may be considered confidential. Any use, distribution, modification, copying, forwarding or disclosure by any person is strictly prohibited. The information and any disclosures provided herein do not constitute a solicitation or offer to purchase or sell any security or other financial product or instrument. The current performance may be unaudited. Past performance does not guarantee future returns. There can be no assurance that investments will achieve any targeted rates of return, and there is no guarantee against the loss of your entire investment. POTENTIAL CONFLICT OF INTEREST DISCLOSURE (as on date of report) Disclosure of interest statement – • Analyst interest of the stock /Instrument(s): - No. • Firm interest of the stock / Instrument (s): - No. www.choiceindia.comcustomercare@choiceindia.com Research Team Mr. Sumeet Bagadia Associate Director Kkunal Parar Sr. Research Associate Amit Pathania Research Associate Kapil Shah Research Associate Vikas Chaudhari Research Associate Rohan Patil Research Associate Trirashmi Ghoderao Research Advisor Neeraj Yadav Research Advisor 06th Oct-2016 TECHNO BUY Kunal Parmar Digitally signed by Kunal Parmar DN: cn=Kunal Parmar, o=Choice Equity Broking Pvt Ltd., ou=Research Dept, email=kunal.parmar@choiceindia.com, c=IN Date: 2016.10.06 15:11:08 +05'30'