SlideShare a Scribd company logo
1 of 22
Download to read offline
Geometric Confinement Controls Stiffness, Strength, Extensibility,
and Toughness in Poly(urethane−urea) Copolymers
Oguzhan Oguz,* Nicolas Candau, Gregory Stoclet, Eren Simsek, Cagla Kosak Soz, Emel Yilgor,
Iskender Yilgor,* and Yusuf Z. Menceloglu*
Cite This: Macromolecules 2021, 54, 4704−4725 Read Online
ACCESS Metrics & More Article Recommendations *
sı Supporting Information
ABSTRACT: Achieving a unique combination of stiffness, strength,
extensibility, and toughness in sol-cast poly(urethane−urea) (PU)
copolymer films is a challenge since these properties arein general
mutually exclusive. Here we demonstrate that geometric confinement
of the basic building blocks controls stiffness, strength, extensibility,
and toughness in PU films. Our results suggest that the severity of
geometric confinement can be tuned by adjusting (i) soft segment
molecular weight (SSMW) and (ii) drying temperature (DT) thanks
to their effects on the structure formation via microphase separation
and/or (confined and/or bulk) crystallization. It is therefore possible
to produce (i) soft (no notable confinement) and (ii) stiff, strong, extensible, and tough (severe confinement) materials without
changing any other parameter except SSMW and DT. The former has a typical physically cross-linked network and shows a well-
defined elastomeric behavior with an elastic modulus (E) of 5−20 MPa, a tensile strength (σmax) of 30−35 MPa, an extensibility (ε)
of 1000−1300%, and a toughness (W) of 90−180 MJ m−3
. The latter, on the other hand, possesses an elegant hierarchical structure
containing tightly packed secondary structures (72-helix, 41-helix, and antiparallel β-sheets) and displays an elastoplastic behavior
with an E of 400−700 MPa, a σmax of 45−55 MPa, an ε of 650−850%, and a W of 200−250 MJ m−3
. Hence, our findings may be of
interest in designing advanced materials containing synthetic replica of the secondary structures found in protein-based materials.
The structure formation in the materials with this structural hierarchy is driven by the confined crystallization of helical
poly(ethylene oxide) (PEO) chains in subnanometer urea channels, whichto the best of our knowledgeis a phenomenon well-
known in host−guest systems but has not yet demonstrated in PU copolymers, and complemented by the “bulk” crystallization of
PEO and/or the microphase separation.
1. INTRODUCTION
Urethane−urea chemistry offers diverse possibilities for design
and synthesis of thermoplastic polyurethanes1−4
(TPUs), that
is, segmented polyurethane, polyurea, and poly(urethane−
urea) copolymers, with functional surface and bulk properties.
TPUs are, in general, linear macromolecules typically formed
by alternating soft and hard segments. Soft segments (SS) are
oligomeric diols or diamines with a glass transition temper-
ature (Tg) well below room temperature, catering elastomeric
characteristics of TPUs at service temperatures. Hard segments
(HS), on the other hand, are obtained by the reaction of
diisocyanates with diol or diamine chain extenders and form
hydrogen-bonded domains having a Tg and/or melting
temperature (Tm) well beyond the service window, which act
as physical cross-links providing TPUs with thermoplastic
properties.4−7
There is plenty of room for designing multifunctional TPUs
with tunable morphologies as the number of commercially
available basic building blocks with different features is
practically unlimited. However, this also indicates a vast
number of parameters4,8
required to be controlled during
synthesis and processing, as they significantly affect both
microphase separation and crystallization, which are the two
keyinterrelatedphenomena determining the structure−
property behavior of resulting materials..
These parameters can be roughly divided into two categories
as (i) synthesis and (ii) processing parameters. Synthesis
parameters have been comprehensively examined in decades of
research,9−13
whereas processing parameters have not yet
received as much attention. This is particularly true for
solution casting since the relevant studies available in the
literature mainly rely on melt-processing.14−22
Although
parameters like (i) solvent type, (ii) drying atmosphere, (iii)
drying temperature, (iv) residence time at the drying
temperature, and (v) post thermal/cryo treatments (annealing,
Received: March 17, 2021
Revised: April 23, 2021
Published: May 11, 2021
Article
pubs.acs.org/Macromolecules
© 2021 American Chemical Society
4704
https://doi.org/10.1021/acs.macromol.1c00596
Macromolecules 2021, 54, 4704−4725
Downloaded
via
UNIV
OF
EDINBURGH
on
August
11,
2021
at
19:50:24
(UTC).
See
https://pubs.acs.org/sharingguidelines
for
options
on
how
to
legitimately
share
published
articles.
quenching, etc.) are extremely important to obtain high-quality
sol-cast films/sheets, they have been somewhat overlooked in
the literature. For instance, most of the sol-cast TPU films/
sheets found in the literature have reported to be dried at 60
°C, even though the solvent systems used, and hence their
evaporation rates at this temperature, are completely different
than each other.23−25
To address this issue, here we focus on the effect of drying
temperature on the structure−property behavior of a series of
poly(ethylene oxide)26,27
(PEO)-based poly(urethane−urea)
copolymers with a hard segment content of 30 wt %. PEO
oligomers with 2000, 4600, and 8000 g mol−1
molar masses
were used as soft segments. While all the other parameters
were kept constant, two different drying temperatures (60 and
100 °C) were applied to prepare the film specimens that were
then comprehensively characterized by a series of techniques.
This has enabled us to demonstrate that geometric
confinement of the basic building blocks along the multiple
length scales controls stiffness, strength, extensibility, and
toughness in sol-cast PU films. Our findings suggest that the
severity of geometric confinement in sol-cast PU films can be
tuned by controlling soft segment molecular weight and drying
temperature since these two parameters are of great
importance for the structure formation through microphase
separation and/or (confined and/or bulk) crystallization. This,
in return, can be utilized to create entirely different
morphologies and hence achieve significant variations in
mechanical properties without changing any other parameter.
To demonstrate, sol-cast PU films with/without severe
geometric confinement are prepared and comprehensively
investigated. The films with severe confinement possess a
structural hierarchy spanning length scales from angstroms to
micrometers, leading to unique combinations of stiffness,
strength, extensibility, and toughness. Our findings may also be
of interest in mimicking certain protein structures containing
tightly packed natural design motifs like helices and antiparallel
β-sheets as the structural hierarchy demonstrated here consists
of these secondary structures. The structure formation in these
films is governed by the confined crystallization of helical
poly(ethylene oxide) (PEO) chains in subnanometer urea
channels and complemented by the “bulk” crystallization of
PEO and the microphase separation. The confined crystal-
lization of PEO in subnanometer urea channels is indeed
known to create host−guest (inclusion) complexes. However,
to the best of our knowledge, it has not yet been demonstrated
in PU copolymers. We therefore also show how the α form of
these complex crystals is formed and what kind of impacts it
has on the structure−property relations of the PU films.
2. EXPERIMENTAL SECTION
2.1. Materials. PEO oligomers with number-average molar
masses, Mn, of 2000, 4600, and 8000 g mol−1
were obtained from
Merck. Bis(4-isocyanatocyclohexyl)methane (HMDI) with a purity of
>99.5% was kindly provided by Bayer. 2-Methyl-1,5-diaminopentane
(MDAP) chain extender was kindly supplied by DuPont. Dibutyltin
dilaurate (DBTDL) catalyst was purchased from Witco. Reagent
grade tetrahydrofuran (THF) and dimethylformamide (DMF) were
also obtained from Merck. All chemicals were used as received.
2.2. Synthesis. The hard segment model compounds (HMDI−
MDAP) with molecular weights similar to those of the HSs in the
copolymers were prepared as control samples and characterized as
given in Figures S1 and S2.
The copolymers were synthesized by the two-step polymerization
technique, also known as the prepolymer method. The detailed
procedure followed was previously reported by our group.28−32
All
reactions were performed in 500 mL three-necked round-bottom
Pyrex reaction flasks equipped with a mechanical overhead stirrer, a
thermometer and a funnel, with temperature control provided by a
heating mantle. The isocyanate-terminated PEO prepolymer solution
in THF with 50 wt % solids content was prepared at 60 °C. We added
150 ppm of DBTDL catalyst (diluted to 1 wt % in THF solution) into
the mixture of PEO and HMDI that was stirred for 1 h at the same
temperature. Prepolymer formation was monitored by Fourier
transform infrared (FTIR) spectroscopy. The reaction was complete
after about 1 h. The heat was then turned off, and the prepolymer was
dissolved in DMF to obtain a solution with 25 wt % solids content.
Chain extension was performed at room temperature by dropwise
addition of MDAP dissolved in DMF (≈10 wt % solids content) to
the prepolymer solution. Completion of the chain extension was also
monitored by FTIR spectroscopy. The dropwise addition of MDAP
was ceased when the strong isocyanate peak centered on 2260 cm−1
completely disappeared. The viscosity increase during the chain
extension reaction was controlled by adding DMF into the reaction
flask. The chemical structure of the PU copolymers is shown in Figure
S3.
2.3. Preparation of PU Films for Testing. PU films were cast
from polymer solution (THF:DMF/1:6.25) into Teflon molds. Two
different drying protocols were followed. In the first protocol, the
molds were kept at room temperature for 24 h in a fume hood and
then placed in an oven at 60 °C for 24 h under vacuum to ensure
complete evaporation of the solvent. Samples were then cooled to
room temperature and stored in sealed polyethylene bags minimum
24 h before testing. In the second protocol, the same steps were
followed, but this time the oven was set to 100 °C instead of 60 °C. A
list of the PU copolymers investigated, their compositions, and drying
conditions is provided in Table 1. In the sample nomenclature (PU-X-
T), X indicates the molecular weight of the PEO used in kilodaltons
and (T) is the drying temperature in degrees Celsius.
2.4. Characterization Techniques. Gel permeation chromatog-
raphy (GPC) analyses were performed by using a Viscotek GPCmax
VE-2001 instrument equipped with D5000-D, 3000-D, and 1000-D
guard columns and RI, LS, and DP detectors. DMF was used as the
solvent, and analysis was performed at 55 °C with a flow rate of 1
mL/min. Polymer solutions were prepared in DMF at a concentration
of 2 mg/mL. The samples were filtered by VMR PTFE syringe filters
with average pore size of 0.45 μm before measurements. Average
molecular weights were determined by using calibration curves
obtained from polystyrene standards. Average molecular weights and
molecular weight distributions of the copolymers along with the effect
of thermal treatment on the samples are listed in Table 2.
Thermogravimetric analyses were performed by using a STA 449C
simultaneous thermal analyzer (Netzsch, Germany) under a nitrogen
atmosphere with a heating rate of 3 °C/min from ambient
temperature to 700 °C.
Modulated differential scanning calorimetry (MDSC) analyses
were performed by a TA Q2000 instrument calibrated with indium
standard and equipped with Tzero functionality that significantly
improves the baseline via compensating resistance and capacitance
Table 1. Sample Notation and Compositional Details of the
PUs along with Drying Temperatures Used in This Study
coding
PEO
⟨Mn⟩
(g/mol)
PEO chain
lengtha
(nm)
HS ⟨Mn⟩
(g/mol)
HS
content
(wt %)
drying
temp
(°C)
PU-2-60 2000 12.0 860 30 60
PU-5-60 4600 27.3 1970 30 60
PU-8-60 8000 51.2 3400 30 60
PU-2-100 2000 12.0 860 30 100
PU-5-100 4600 27.3 1970 30 100
PU-8-100 8000 51.2 3400 30 100
a
PEO segment lengths were taken from the literature.33
Macromolecules pubs.acs.org/Macromolecules Article
https://doi.org/10.1021/acs.macromol.1c00596
Macromolecules 2021, 54, 4704−4725
4705
imbalances. In this technique, a harmonic modulation is applied on a
typical DSC linear ramp. Then the typical DSC thermograms are
deconvoluted by a signal analysis process into two different
components mainly referred to as reversing and nonreversing ones.
The reversing component involves the reversible events in the time
scale of modulation such as the glass transition step and melting of
outer layers of crystallites. Apart from this, melting of crystal cores and
enthalpy relaxation accompanying the glass transition are mainly
characterized by the nonreversing component.33−35
All measurements were performed in the range of −160 and 250
°C at a rate of 3 °C/min and a modulation of ±1 °C over a period of
90 s. We applied a typical procedure for the sample preparation. For
each composition, a small piece of thin film sample, weighting around
10 mg, was encapsulated in a hermetic DSC pan prior to
measurement. At least five specimens were measured for each sample.
Overall thermal properties of the samples were followed by the total
specific heat flow signals as a function of temperature. As the
copolymers with PEO-4600 and PEO-8000 soft segments display very
weak glassy−rubbery transitions, it is not easy to detect the soft
segment glass transition temperature. For this reason, the reversing
signal is used to analyze the glassy−rubbery transition region for all
the samples under investigation. The glass transition temperature (Tg)
and the heat capacity change at Tg (ΔCp at Tg) were determined by
the inflection point and the tangent methods, respectively. The degree
of soft segment crystallinity (χc) is calculated by using the following
equation, assuming that the hard segment does not contribute to the
crystallinity of the soft segment:
H H
X H
(1 )
100%
c
m c
HS 100%,PEO
χ =
Δ − Δ
− × Δ
×
where ΔHm and ΔHc are the enthalpy changes obtained from the
areas of the respective endothermic and exothermic peaks and XHS is
the weight fraction of the hard segment. The melting enthalpy for the
100% crystalline polymer is considered to be equal to that of pure
PEO (ΔH100%PEO), which is denoted as 196.6 J/g.33,35
X-ray diffraction (XRD) measurements of the film samples were
performed on a Bruker D8 Advance X-ray diffractometer using Ni-
filtered Cu Kα radiation (λ = 0.1542 nm). All the measurements were
performed from 5° up to 90° with a step size of 0.01°. The results
were plotted as a function of the scattering angle 2θ. During the
measurements, specific instrumental and sample effects were also
considered. The d-spacing is calculated with respect to Bragg’s law, nλ
= 2d sin θ, where λ is the wavelength of the radiation, d is the
interplanar spacing, θ is the diffraction angle, and n is the order of the
reflection. At least five specimens of each sample were measured and
then analyzed for determining the total degree of crystallinity values
presented in the respective section.
Fourier transform infrared spectroscopy (FTIR) measurements
were performed on a Nicolet 7600 spectrometer. For the progress and
completion of the synthesis, solutions were cast on KBr discs, and thin
films were obtained after evaporating the solvent with an air gun. A
total of 32 scans were taken for each spectrum with a resolution of 2
cm−1
. A Thermo Scientific Nicolet iS10 spectrometer equipped with a
Thermo Scientific Smart iTR Accessory with a Diamond ATR crystal
and with an incident angle of 42° was used to record ATR-IR
(attenuated total reflectance infrared spectroscopy) spectra of the film
samples prepared under different thermal protocols. Thirty-two scans
were taken for each spectrum with a resolution of 2 cm−1
in the range
4000−400 cm−1
. All spectral corrections, such as background
subtraction, were carefully performed by Omnic Software. Deconvo-
lution of the amide-I and amide-II bands was performed by using
Origin data processing software. A linear baseline was used. The peak
maxima were denoted as the frequencies detected by second-
derivative analysis. A Lorentzian peak function was applied
throughout the nonlinear fitting process. Quantification of the
secondary structures was performed by analyzing the amide-I region.
The average percent fractions of the secondary structures were
calculated by integrating the area under each deconvoluted peak and
then normalizing to the total area of the amide-I region. At least five
specimens of each material were measured by the ATR-IR technique
and then analyzed by the deconvolution procedure summarized above
to determine the standard deviations for the respective quantities.
A Renishaw Invia Raman spectrometer (equipped with 785, 633,
and 532 nm excitation laser sources) was used to obtain the Raman
spectra of the samples at the excitation wavelength of 633 nm. To
avoid the structural deterioration, 50% laser power was used to excite
the sol-cast films with an average thickness of 0.2 mm. Each
measurement accumulates the signal for 1 min with an exposure time
of 10 s under ambient temperature and humidity conditions.
A Nikon Eclipse ME 600 optical microscope (OM) equipped with
a hot stage was used to investigate the micrometer scale morphologies
of thin polymer films placed between two clean glass slides. All
measurements were performed under the polarized light in bright
field.
Atomic force microscopy (AFM) images of the free surface of
completely dried solution cast films were captured on a Bruker
ScanAsyst enabled Multimode-8 atomic force microscope equipped
with a Nanoscope 8.1 controller. All samples were analyzed in
standard tapping/noncontact mode by using a Bruker Scanasyst air
probe with a nominal spring constant of 0.4 N/m, a resonance
frequency of 70 kHz, and a radius of curvature of 2 nm. All images
were recorded at 1 Hz frequency with a 512 × 512 scan and a set
point ratio of ∼0.6 at ambient temperature and humidity conditions.
Stress−strain analyses were performed on dog-bone-type speci-
mens punched out of thin films by using a standard die (ASTM D
1708). Measurements were made on a Zwick Z100 model tester
under ambient temperature and humidity conditions with a crosshead
speed of 25.0 mm/min (L0 = 24.0 mm). At least five specimens were
tested for each sample.
3. RESULTS AND DISCUSSION
3.1. Thermal Stability. TGA and GPC measurements
were performed to check the effect of drying protocols on the
specimens. For the thermal stability measurements, the
samples were subjected to the same experimental conditions
applied in DSC analyses, i.e., at a heating rate of 3 °C/min
under a nitrogen atmosphere, during TGA analyses. Figure S4
displays the weight loss as a function of temperature for the
samples. The decomposition starts around 330 °C, which is
well above the temperatures applied in our drying protocols for
PU-2, PU-5, and PU-8. However, side reactions like chain
scission and possible recombination (e.g., by cleavage of
urethane and/or urea bonds) are not followed by TGA
measurements. In general, such reactions give rise to change in
the molecular weight and/or molecular weight distribution of
the materials.36
As listed in Table 2, GPC results suggest that
no notable change occurred regarding both molecular weights
and molecular weight distributions of the samples after drying
at 100 °C. These results suggest that there is no substantial
degradation taking place in our copolymers within this
temperature range.
3.2. Calorimetry. Modulated DSC analyses were per-
formed to investigate the thermal properties of the samples,
Table 2. Average Molecular Weight and Molecular Weight
Distributions of the PEO-Based Poly(urethane−urea)s
along with the Effect of Thermal Treatment on the Samples
notation ⟨Mw⟩ (g/mol) ⟨Mn⟩ (g/mol) Mw/Mn
PU-2 100000 68000 1.48
PU-2 24 h at 100 °C 106000 70400 1.51
PU-5 232000 164000 1.42
PU-5 24 h at 100 °C 243300 168700 1.44
PU-8 309000 209500 1.47
PU-8 24 h at 100 °C 317000 212800 1.49
Macromolecules pubs.acs.org/Macromolecules Article
https://doi.org/10.1021/acs.macromol.1c00596
Macromolecules 2021, 54, 4704−4725
4706
which were evaluated by using the data obtained from the first
heating scans of the specimens since the mechanical properties
can only be influenced by the thermal histories of the materials
rely on the applied processing conditions. The total heat flow
signals of the PU copolymers are provided in Figure 1.
In Figure 1a, PU-2-60 shows a well-defined glassy−rubbery
transition between −60 and −50 °C followed by a small
exotherm between −50 and −25 °C and an endotherm at 19.9
°C with a PEO
(ΔHm − ΔHc) of 44.9 ± 4.3 J/gPU. PU-5-60 and
PU-8-60 display very weak glassy−rubbery transitions at
temperatures between −60 and −40 °C followed by sharp
endotherms at 42.1 and 51.2 °C with enthalpy changes of 59.9
± 5.2 and 77.6 ± 3.7 J/gPU, respectively. No other high-
temperature exothermic and/or endothermic transitions are
observed for the samples prepared at 60 °C.
In Figure 1b, PU-2-100 displays a distinct glass transition
followed by an exotherm between −50 and −25 °C and an
endotherm at 17.1 °C with a PEO
(ΔHm − ΔHc) of 30.2 ± 3.1
J/gPU. PU-2-100 also shows another exotherm with a peak
temperature of 119 °C and multiple endotherms with peak
temperatures of 176, 184, and 192 °C in the high-temperature
region. PU-5-100 and PU-8-100 show weak glass transition
steps at temperatures between −70 and −60 °C, followed by
bimodal endotherms in the intermediate regions of the
thermograms. The bimodal endotherm of PU-5-100 comprises
a relatively small endotherm apparent as a shoulder with a peak
temperature of 28.6 °C and a main endotherm with a peak
temperature of 38.3 °C and a total enthalpy change (shoulder
and main peak) of 47.7 ± 3.4 J/gPU, whereas a shoulder with a
peak temperature of 35.4 °C and a main endotherm with a
peak temperature of 45.1 °C and a total enthalpy change of
57.0 ± 3.0 J/gPU are observed in that of PU-8-100. In addition,
PU-5-100 displays an exotherm with a peak temperature of 139
°C followed by an endotherm with a peak temperature of 206
°C in the high-temperature region of the thermogram.
Similarly, PU-8-100 shows an exotherm with a peak temper-
ature of 159 °C and an endotherm with a peak temperature of
220 °C. These results are elaborately discussed in (i) Soft
Segment Glass Transition, (ii) Melting Behavior of PEO Soft
Segment Crystals and Soft Segment Crystallinity, and (iii)
Microphase Separation/Mixing subsections in the following.
The α
ΔH values given in Figure 1b and a respective discussion
are provided in the Microphase Separation/Mixing subsection.
In addition, the enthalpy changes given in Figure 1 (PEO
ΔHm,
PEO
(ΔHm − ΔHc)) are not the ones normalized by the weight
fraction of PEO. The normalized values used to calculate soft
segment crystallinity values are denoted in the melting of PEO
soft segment crystals and soft segment crystallinity subsection.
It should also be noted that the soft segment glass transition
temperatures were determined by using the reversing heat flow
signals in Figures 2 and 3 as discussed in the Soft Segment
Glass Transition subsection.
Soft Segment Glass Transition. The transition located at
between −70 and −40 °C is assigned to the soft segment
(PEO) glass transition (PEO
Tg), which is mainly followed by
the reversing heat flow signals by using the inflection point
method. To provide a clear overview on the effects of soft
segment molecular weight and drying protocol, the reversing
heat flow signals for the corresponding temperature range are
replotted in Figure 2 for PU-2-based samples. The
Figure 1. Total heat flow signals as a function of temperature obtained from MDSC analyses of the samples dried at (a) 60 °C and (b) 100 °C.
Figure 2. Reversing heat flow thermograms of the copolymers based
on PEO-2000 soft segment (PU-2-60 and PU-2-100) at temperatures
between −80 and −30 °C. The uncertainties in PEO
Tg and R
ΔCp at
PEO
Tg values in the plot are ±1 °C and ±0.02 J/(g °C), respectively.
Macromolecules pubs.acs.org/Macromolecules Article
https://doi.org/10.1021/acs.macromol.1c00596
Macromolecules 2021, 54, 4704−4725
4707
corresponding plots for PU-5 and PU-8 samples are provided
in Figure S5.
PEO
Tg values are determined to be −57.3 and −61.9 °C for
PU-2-60 and PU-2-100, respectively (Figure 2). The
corresponding R
ΔCp at PEO
Tg values are calculated as 0.383
J/(g °C) (PU-2-60) and 0.436 J/(g °C) (PU-2-100). PEO
Tg
values of PU-5-60 and PU-5-100 copolymers are determined to
be −53.8 and −63.6 °C, respectively (Figure S5a). The
corresponding R
ΔCp at PEO
Tg values are calculated as 0.072 J/
(g °C) (PU-5-60) and 0.123 J/(g °C) (PU-5-100). PEO
Tg
values of PU-8-60 and PU-8-100 are recorded as −49.3 and
−68.7 °C, respectively (Figure S5b). The respective R
ΔCp at
PEO
Tg values are denoted as 0.043 J/(g °C) (PU-8-60) and
0.162 J/(g °C) (PU-8-100).
The PEO
Tg values are plotted in Figure 3 as a function of soft
segment molecular weight for both series of the samples. The
PEO
Tg increases with increasing SSMW for the PU-X-60 set of
samples. The increasing trend in PEO
Tg values with increasing
SSMW is basically arisen from two different reasons. One of
them is the increasing amount of dissolved hard segments in
the soft matrix, and the other one is the increasing amount of
PEO soft segment crystals formed by bulk crystallization of the
soft segments. In contrast, the PEO
Tg decreases via increasing
SSMW for PU-X-100 set of the samples. For all the PU
copolymers investigated (PU-2, PU-5, and PU-8), the decrease
in PEO
Tg is induced by drying at 100 °C.
This leads to an increase in the miscibility between the hard
and soft segments; that is, more hard and soft segments
participate in a “phase mixing” process. At this stage, PEO and
urea molecules act cooperatively to minimize their free
energies. This initiates confined crystallization of the PEO
chains within the subnanometer urea channels giving rise to
the formation of PEO−urea α-complex crystals. Structural
details for this complex crystal are provided in the following
sections via XRD, FT-IR, Raman, and microscopic analyses.
Formation of the α-complex crystals simultaneously activates
separation of the molecules participating in this phase from the
bulk. As the SSMW increases, the hard segment molecular
weight increases, too, and thus, the number of both PEO and
urea molecules participating in this process also increases. This
corresponds to the same amount of decrease in the number of
dissolved hard segments creating physical constraints on the
mobility of the PEO chains in the bulk. This means the
removal of same amount of constraints on the mobility, which
results in an enhanced mobility as characterized by the
decrease in PEO
Tg. For this reason, increasing SSMW results in
a decreasing trend in PEO
Tg for the PU-X-100 set of samples.
Figure 3 also shows the change in PEO
Tg values (ΔTg)
originated from the change in the drying temperature. ΔTg
defined in this study is different than the one usually described
in TPUs to investigate the degree of microphase separation. In
conventional TPUs, ΔTg is defined as the absolute value of the
difference between Tg of the soft segment in TPUs (SS
Tg) and
of the pure oligomers/macrodiols (oligomer
Tg) used as the soft
segment during the synthesis that can be quantified as ΔTg =
SS
Tg − oligomer
Tg. In this respect, it is assumed that higher value
of ΔTg indicates higher miscibility, and thus, an increasing
trend in ΔTg implies an increasing miscibility due to favorable
interactions between the hard and soft segments.37
In return, it
is assumed that a lower value of ΔTg suggests a higher degree
of phase separation. However, Saiani et al. have reported that
the determination of the phase separation degree from the soft
segment phase glass transition does not seem to be adequate
for high hard block content TPUs displaying high-temperature
endothermic peaks like microphase mixing temperature
(TMMT).36
They have also denoted that even for such samples, some
degree of microphase separation is present even if SS
Tg is not
observed.36
On this basis, it should be emphasized that here we
define ΔTg as the absolute value of PU‑X
ΔTg = PU‑X‑60
Tg −
PU‑X‑100
Tg, where X indicates the molecular weight of the PEO
used in kilodaltons, to only demonstrate the increasing
miscibility in the samples prepared at 100 °C compared to
the ones prepared at 60 °C. As shown in Figure 3, ΔTg
systematically increases with increasing soft segment molecular
weight. However, this does not necessarily mean that an
increasing trend in SSMW implies a decreasing trend in the
degree of microphase separation due to the fact that formation
of the α-complex crystals suggests that these two processes, i.e.,
a phase mixing and a phase separation, can simultaneously
work in a cooperative manner since the urea molecules are
highly organized by bidentate hydrogen bonds between each
other on the walls of the channels while confined PEO chains
are tightly hydrogen bonded to the excess urea molecules
within the channels during the structure formation. The
process on the walls of the channels represents the phase
separation, whereas the one within the channels illustrates the
phase mixing in terms of the type and extent of intermolecular
interactions, i.e., hydrogen bonds, which is generally used to
describe these two processes in the literature.
Melting Behavior of PEO Soft Segment Crystals and Soft
Segment Crystallinity. As shown in Figure 1, the endothermic
peaks at 19.9, 42.1, and 51.2 °C are attributed to the melting
points (PEO
Tm) of PEO soft segment crystals in PU-2-60, PU-
5-60, and PU-8-60, respectively. After the normalization of the
enthalpy changes provided in Figure 1a with the weight
fraction of PEO, (ΔHm − ΔHc) of 64.1 ± 6.1, ΔHm of 85.5 ±
7.4, and ΔHm of 110.9 ± 5.3 J/gPEO are obtained for PU-2-60,
PU-5-60, and PU-8-60, respectively. By use of the normalized
enthalpy changes, the degree of soft segment crystallinity
Figure 3. Change in the soft segment (PEO) glass transition as a
function of SSMW for both series of the samples dried at 60 and 100
°C. PEO
Tg increases with increasing SSMW for the samples dried at 60
°C. In contrast, this trend becomes reverse; i.e., PEO
Tg decreases with
increasing SSMW, for the ones dried at 100 °C. ΔTg is calculated as
the absolute value of PU‑X
ΔTg = PU‑X‑60
Tg − PU‑X‑100
Tg, where X
indicates the molecular weight of the PEO used in kilodaltons for the
copolymers based on PEO-2000, PEO-4600, and PEO-8000 soft
segments.
Macromolecules pubs.acs.org/Macromolecules Article
https://doi.org/10.1021/acs.macromol.1c00596
Macromolecules 2021, 54, 4704−4725
4708
(PEO
χc) values of the samples are calculated as PEO
χc‑PU‑2‑60 (%)
= 32.6 ± 3.1, PEO
χc‑PU‑5‑60 (%) = 43.5 ± 3.8, and PEO
χc‑PU‑8‑60
(%) = 56.4 ± 2.7 for PU-2-60, PU-5-60, and PU-8-60,
respectively. PEO
Tm and PEO
χc values increase with increasing
molecular weight.
For the samples prepared at 100 °C, PEO
Tm of PEO values
are recorded as 17.6, 38.3, and 45.1 °C for PU-2-100, PU-5-
100, and PU-8-100, respectively. The corresponding PEO
χc
values of this set of samples are calculated as PEO
χc‑PU‑2‑100
(%) = 21.9 ± 2.3, PEO
χc‑PU‑5‑100 (%) = 34.6 ± 2.5, and
PEO
χc‑PU‑8‑100 (%) = 41.4 ± 2.2 after the normalization of the
respective enthalpy changes given in Figure 1b with the weight
fraction of PEO, which correspond to (ΔHm − ΔHc) of 43.1 ±
4.5, ΔHm of 68.1 ± 4.9, and ΔHm of 81.4 ± 4.3 J/gPEO for PU-
2-100, PU-5-100, and PU-8-100, respectively.
The changes in PEO
Tm values as a function of soft segment
molecular weight and drying temperature are shown in Figure
4. PEO
Tm values of the samples prepared at 60 °C are higher
than those of their analogues prepared at 100 °C, meaning that
the drying protocol comprising a thermal treatment at 100 °C
results in a decrease in the PEO
Tm.
In addition, ΔTm systematically increases with increasing
soft segment molecular weight. This is directly related to the
formation of α-complex crystals via confined crystallization of
poly(ethylene oxide) chains in subnanometer urea channels.
As the PEO chain length increases, the thickness of the α-
complex in the longitudinal direction, i.e., the channel length,
which can be followed by its increasing melting point (α
Tm)
given in Figure 5b, increases too in accordance with the one-
dimensional (1D) nature of the α-complex. This indicates that
lateral surface area and, thus, a higher number of nucleation
sites on the 1D threadlike cores of the complex also increases
with increasing PEO chain length. In this respect, other PEO
chains are driven to align in the longitudinal direction, i.e., in a
parallel manner with the 1D α-complex, and strung together by
the threadlike core. The increase in the thickness in the
longitudinal direction with increasing PEO chain length gives
rise to the decrease in the thickness in the radial direction with
the same extent. For instance, as the formation of α-complex
leads to a decrease in the radial thickness resulting in a
decrease of 2 °C (PU‑2
ΔTm) in PEO
Tm of the copolymer based
on PEO-2000 soft segment (PU-2), this decrease (PU‑8
ΔTm)
becomes 3 times higher for the copolymer based on PEO-8000
(PU-8), since the PEO chain length in PU-8 is 3 times higher
than the one in PU-2.
Microphase Separation/Mixing. The exotherms located at
119, 139, and 159 °C in Figure 1b are assigned to the
microphase separation temperatures (TMST) of PU-2-100, PU-
5-100, and PU-8-100, respectively. TMST linearly increases with
increasing soft segment molecular weight. In general, the
microphase separation temperature in diblock copolymers has
been reported to be dependent on the product χN as well as
the content of the copolymer, where χ is referred as the Flory−
Huggins interaction parameter and N is the polymerization
index. This is also applied for segmented copolymers like
polyurethanes. As the soft segment molecular weight increases,
the hard segment molecular weight increases too for achieving
a constant weight fraction in terms of percent HS content.
Therefore, the average sequence length increases, too. In this
respect, as suggested by Koberstein and Russell,38
if χ inversely
proportional to temperature, the effect of the increasing
average sequence length would be to raise the TMST. In general,
this transition (TMST) is followed by the microphase mixing
(TMMT) and/or the melting of microcrystalline hard domains
in polyurethanes. The presence of multiple endotherms is
usually associated with either melting or mixing of phases with
the different domain sizes. Consequently, it is crucial to
understand the origins of such endothermic peaks observed at
high temperatures. It is also of particular interest to address the
two interrelated questions denoted as follow: (I) Are these
peaks solely formed by the heating effect during DSC scan?
(II) Are they arisen from the thermal transitions of the phases,
such as melting of the crystals, already existing in the samples?
To address this issue, the high-temperature endotherms must
be examined together with the microphase separation
exotherm since, in such thermograms, the enthalpy changes
of microphase separation (ΔHMST) and microphase mixing
(ΔHMMT) processes are almost equal to each other. Therefore,
it is reasonable to consider that the difference between these
two enthalpy changes, which is defined as α
ΔH = ΔHMMT −
ΔHMST, should originate from the thermal transitions of the
phases already existing in the samples. From this perspective,
we attempt to understand the origins of the peaks observed at
the high temperatures. Aforementioned, PU-2-100 shows an
exotherm with a peak temperature of 119 °C and multiple
endotherms with peak temperatures of 176, 184, and 192 °C in
the high-temperature region (Figure 1b). Interestingly, the
peak temperatures vary with the same extent; that is, the
differences between two subsequent peak temperatures are
equal to each other as described as follows: T192 − T184 = T184
− T176 = 8 °C, where the subscripts represent the
corresponding peak temperatures (Figure 5a). Therefore, it is
reasonable to consider that PU-2-100 contains the α-complex
crystals with three different sizes in three different “mixed”
phase domains. For this material, α
ΔH is calculated as 11.8 ±
0.7 J/gPU, assuming that the respective three endotherms are
Figure 4. Change in the melting point of PEO soft segment crystals
(PEO
Tm) as a function of SSMW and drying temperature. Effect of
SSMW; PEO
Tm(PU‑8‑60) > PEO
Tm(PU‑5‑60) > PEO
Tm(PU‑2−60), and
PEO
Tm(PU‑8‑100) > PEO
Tm(PU‑5‑100) > PEO
Tm(PU‑2‑100). Effect of drying
temperature; PEO
Tm(PU‑2‑60) > PEO
Tm(PU‑2‑100), PEO
Tm(PU‑5‑60) >
PEO
Tm(PU‑5‑100), and PEO
Tm(PU‑8‑60) > PEO
Tm(PU‑8‑100). ΔTm is calculated
as the absolute value of PU‑X
ΔTm = PU‑X‑60
Tm − PU‑X‑100
Tm, where X
indicates the molecular weight of the PEO used in kilodaltons. ΔTm
systematically increases with increasing soft segment molecular
weight. This is related to the formation of α-complex crystals via
confined crystallization of PEO within the subnanometer urea
channels.
Macromolecules pubs.acs.org/Macromolecules Article
https://doi.org/10.1021/acs.macromol.1c00596
Macromolecules 2021, 54, 4704−4725
4709
arisen from melting of α-complex crystals with three different
sizes, which simultaneously takes place with mixing of the
phases in these domains. The α
ΔH of 11.8 ± 0.7 J/gPU
basically indicates the presence of a crystalline phase giving
rise to the formation of such a difference between ΔHMMT and
ΔHMST enthalpy changes. α
ΔH values are also calculated as
15.4 ± 0.5 and 16.9 ± 0.6 J/gPU for PU-5-100 and PU-8-100,
respectively. It should be emphasized that α
ΔH increases with
increasing soft segment molecular weight. Moreover, there is a
correlation between the peak temperatures of high-temperature
endotherms observed for the samples prepared at 100 °C with
respect to the soft segment molecular weight (Figure 5b). If we
assume three different hypothetical domain sizes (Dα1
, Dα2
,
Dα3
) assigned for these three endotherms, one can easily see
that the peak temperature linearly increases with increasing
domain size (Figure 5a) since the difference between two
subsequent peak temperatures are equal to each other that can
be defined as Δα
TM = T192 − T184 = T184 − T176 = 8 °C, where
the subscripts represent the corresponding peak temperatures.
A similar trend is also observed as a function of soft segment
molecular weight (Figure 5b). If we assume the peak at 192 °C
as the main peak of α
TM in PU-2-100, one can see that α
TM
linearly increases with increasing soft segment molecular
weight, which can be described as Δα
TM = α
TPU‑8‑100 −
α
TPU‑5‑100 = α
TPU‑5‑100 − α
TPU‑2‑100 = T220 − T206 = T206 −
T192 = 14 °C.
3.3. X-ray Diffraction. Three different crystal structures,
i.e., PEO with a monoclinic unit cell,39−43
tetragonal urea
crystals,44
and PEO−urea α-complex crystals with a trigonal
unit cell,45−52
can possibly be formed in our materials (see the
Supporting Information, section S5). Figure 6 shows XRD
patterns obtained from PU-2-60 and PU-2-100. PU-2-60 only
displays an amorphous halo, whereas PU-2-100 shows two
sharp peaks at 19.3° and 23.3° and a fairly weak peak at 27.4°
and 36.2°. The XRD pattern obtained for PU-2-60 is expected
and in accordance with the results obtained from thermal
analyses (Figure 1a), indicating that the sample is amorphous
at room temperature as the melting endotherm observed in
PU-2-60 is below room temperature. However, the XRD
pattern of PU-2-100 is an unexpected result due to the
following reasons: (i) The melting endotherm of PEO soft
segment in PU-2-100 is below the room temperature (Figure
1b) which indicates an amorphous sample at room temper-
ature like PU-2-60. Thus, these peaks are unlikely to be
originated only from PEO soft segments. (ii) The hard
segment model compounds are also found to be completely
amorphous as demonstrated in Figure S2. Hence, the peaks are
unlikely to be derived only from the hard segments either. (iii)
Even if we assume that they are originated from pure
crystalline hard domains formed by hydrogen bonded urea
groups, the positions of these peaks, at least, should be similar
to the ones reported for urea model compounds. However, this
is not the case here. (iv) In addition, the peaks, at least at the
first glance, are fairly similar to the ones typically assigned for
the crystalline PEO rather than urea. (v) Nevertheless, they
should be associated with the structures giving rise to the
formation of multiple endotherms at high temperatures
(Figure 1b).
We therefore consider that the peaks may be originated from
a complex crystal structure involving both PEO and urea units.
Upon a careful literature review, we have then found out that
the peaks at 19.3° and 27.4° can indeed be arisen from PEO−
urea α-complex crystals. They mainly correspond to the crystal
planes of (200) and (202), respectively. The intensity of the
peak at 19.3° is significantly higher than that of the peak at
27.4°. Structural features of this complex crystal formed in
“host−guest”’ systems termed PEO−urea inclusion complexes
are well-documented in the literature.45−52
However, to the
Figure 5. Change in α
TM as a function of domain size for triple endotherms in PU-2-100 (a) and soft segment molecular weight (b).
Figure 6. XRD patterns of PU-2-60 and PU-2-100.
Macromolecules pubs.acs.org/Macromolecules Article
https://doi.org/10.1021/acs.macromol.1c00596
Macromolecules 2021, 54, 4704−4725
4710
best of our knowledge, the question of whether this kind of
complex crystal can form in PU copolymers containing PEO
and urea units has not yet been addressed. Our results suggest
that this, in fact, is possible.
There is also another strong peak at 23.3° (Figure 6). This
peak is generally termed a characteristic peak of helical PEO
chains assigned to (112) and/or (032) crystal planes
representing the degree of helicity since it is not observed in
the transplanar form.41
Considering 72 helical nature of PEO
chains in pure form, this peak can be an indication of some
“crystallized” PEO chains in the mixed phase placed in the
immediate vicinity of threadlike cores of the α-complex. There
is another peak at 36.2°, which is in the middle of two
characteristic peaks of tetragonal urea crystals generally
observed at 35.5° and 37.1° corresponding to the crystal
planes of (210) and (201). The intensity of this peak is very
similar to that of the peak located at 27.4°. Considering all the
apparent peaks together, it is reasonable to envisage that 1D
threadlike cores of the α-complex involving 41 helical PEO
chains and hydrogen bonded urea molecules are surrounded
by another crystalline layer of the mixed phase containing
some “crystallized” PEO chains with 72 helical conformation
and tetragonal urea crystals. In comparison to the tightly
packed α-complex crystals, this crystalline layer is expected to
be in a relatively more “disordered” state.
Figure 7 display XRD patterns of the PU copolymers based
on PEO-4600 and PEO-8000 soft segments. On one hand, PU-
5-60 displays the peaks located at 14.9°, 19.3°, 23.2°, and 26.2°
(Figure 7a). The peaks at 14.9°, 19.3°, and 23.2° are also
observed for PU-8-60 (Figure 7b). However, the peak located
at 26.2° is not clearly visible for this sample. The intensities of
the peaks at 19.3° and 23.2° are significantly higher than the
ones observed at 14.9° and 26.2° for both PU-5-60 and PU-8-
60. On the other hand, PU-5-100 shows the peaks at 13.6°,
14.6°, 15.2°, 19.3°, 23.2°, 25.8°, 26.2°, 27.2°, 29.4°, 30.8°, and
36.2° (Figure 7a). Similarly, the peaks located at 13.6°, 14.5°,
15.1°, 19.3°, 21.1°, 22.0°, 23.2°, 25.8°, 26.2°, 27.2°, 27.7°,
30.8°, and 36.2° are observed for PU-8-100 (Figure 7b). The
intensities of the peaks at 19.3° and 23.2° are significantly
higher than those of the other peaks in both of the samples.
Figure 7. XRD patterns of (a) PU-5-60 and PU-5-100 and (b) PU-8-60 and PU-8-100.
Figure 8. XRD patterns of (a) PU-2-60, PU-5-60, and PU-8-60 and (b) PU-2-100, PU-5-100, and PU-8-100 as a function of soft segment
molecular weight.
Macromolecules pubs.acs.org/Macromolecules Article
https://doi.org/10.1021/acs.macromol.1c00596
Macromolecules 2021, 54, 4704−4725
4711
The peaks located at 21.1°, 22.0°, and 27.7° are not clearly
visible in the diffractogram of PU-5-100, whereas they become
more apparent for PU-8-100.
The assignment of these peaks is provided in Figure 8 which
also shows the comparison of the XRD patterns as a function
of soft segment molecular weight. For PU-5-60 and PU-8-60
(Figure 8a), the peaks at 14.9°, 19.3°, and 23.2° mainly
correspond to the crystal planes of (110), (120), and (112),
respectively.41
The peak at 26.2°, which is only visible for PU-
5-60, is assigned to the crystal plane of (033). They are
reported for 72 helical PEO chains and originated from the
crystalline matrix phase in these two copolymers. These results
are in a good agreement with the results obtained from MDSC
analyses of these two copolymers, suggesting that the
endotherms located at 42.1 and 51.2 °C in the MDSC
thermograms of PU-5-60 and PU-8-60 originate from the
melting of PEO soft segment crystals.
For PU-5-100 and PU-8-100 (Figure 8b), the peaks located
at 13.6° and 25.8° originate only from the presence of PEO−
urea α-complex crystals. These two peaks are assigned to the
crystal planes of (101) and (112) with d-spacings of 6.52 and
3.45 Å, respectively. Besides, the peaks resulted only from the
presence of monoclinic PEO crystals are listed in the following
along with the corresponding crystal planes and d-spacings: the
peaks at 14.5°, 21.1°, 23.2°, and 26.2° are assigned to the
crystal planes of (021), (031), (112), and (033) with d-
spacings of 6.11, 4.21, 3.83, and 3.40 Å, respectively. It should
be noted that the peak at 23.2° can also be assigned to the
crystal plane of (032) as reported in the literature.41
More
importantly, there are two mutual peaks located at 19.3° and
27.2°−27.7°, which are originated from the presence of both of
the PEO−urea α-complex and the PEO crystals. The peak
located at 19.3° represents the crystal plane of (120) for the
crystalline PEO, whereas it also corresponds to the crystal
plane of (200) for PEO−urea α-complex. If we assume that
this peak is only resulted from the presence of PEO crystals,
the peak intensities recorded for PU-5-100 and PU-8-100
samples should be lower than those of PU-5-60 and PU-8-60
since the corresponding crystallinity values of PU-5-60 and
PU-8-60 are relatively higher than the ones recorded for PU-5-
100 and PU-8-100, respectively. However, this is not the case
in here. For this peak, the peak intensities in PU-5-100 and
PU-8-100 are notably higher than the ones in PU-5-60 and
PU-8-60, respectively. This result strongly suggests that the
PEO−urea α-complex crystals directly contribute to the total
intensity of the peak located at 19.3° which mainly
corresponds to the d-spacing of 4.59 Å. Therefore, it should
be emphasized that this peak originated from the presence of
both of the PEO−urea α-complex and the PEO crystals in
both samples.
To provide a clear overview on the peaks located at 27.2°−
27.7° as well as the other small peaks, a magnified view of the
diffractogram obtained from PU-8-100 is representatively
reproduced in Figure 9. It should be noted that most of the
small peaks highlighted in Figure 9 are also observed for PU-5-
100. However, its diffractogram is not used in this figure for
clarity. The peaks at 13.4°, 14.5°, 15.1°, 21.1°, 22.0°, and 26.2°
(Figure 9) arise only from the presence of monoclinic PEO
crystals. These peaks correspond to the crystal planes of (100),
(021), (110), (104), (023), and (033), respectively. The peaks
at 13.6° and 25.8° corresponding to the crystal planes of (101)
and (112) originate only from the presence of PEO−urea α-
complex crystals. The peak expected to be located at 27.4°,
which is assigned to the crystal planes of (202) and (200) for
trigonal PEO−urea α-complex and monoclinic PEO crystals,
respectively, in the literature, seems to be split into two
different peaks located at 27.2° and 27.7°. The d-spacings of
these two peaks are 3.27 and 3.22 Å, respectively. Another
small peak is observed at 30.8°. In this region, it is expected to
see two characteristic peaks of crystalline urea, which are
generally located at 29.3° and 31.6° corresponding to the
crystal planes of (111) and (200), respectively. Thus, it is likely
that the small peak at 30.8° arises from a combination of two
characteristic peaks of crystalline urea. This might be due to
the interactions between the PEO and urea groups. A similar
combination is also observed for the peaks expected to be
located at 35.5° and 37.1° in pure form as denoted in Figure 7.
Instead of these two characteristic peaks corresponding to the
crystal planes of (210) and (201) of urea crystals, there is a
single peak at 36.2°, which is in the middle of those two.
Overall, the XRD results are in a good agreement with the
data obtained from MDSC analyses of the PU copolymers.
These results mainly suggest that PU-2-60 is completely
amorphous at room temperature, whereas PU-2-100 contains
the PEO−urea α-complex crystals surrounded by another
crystalline layer, which is formed by a mixed phase comprising
some “crystallized” helical (monoclinic) PEO crystals and
hydrogen-bonded (tetragonal) urea crystals (Figure 6). On the
other hand, PU-5-60 and PU-8-60 contain monoclinic PEO
crystals, whereas PU-5-100 and PU-8-100 comprise both
trigonal PEO−urea α-complex crystals and monoclinic PEO
crystals (Figure 7). The structure formation is basically
governed by the bulk crystallization of the PEO chains in
both PU-5-60 and PU-8-60, whereas it is mainly driven by the
confined crystallization of the PEO chains in subnanometer
urea channels in both PU-5-100 and PU-8-100, which is
followed by the formation of monoclinic PEO crystals that are
initially nucleated on the lateral surfaces of the α-complex
crystals. Our interpretation has been only based on the peak
positions so far. However, the positions of characteristic
diffraction peaks of the crystalline PEO are very similar to
those of the PEO−urea α-complex crystal structure. We
therefore consider that this should be supported by the
quantitative analysis of the results in terms of crystallinity.
Figure 9. Small peaks representatively shown in the XRD pattern of
PU-8-100.
Macromolecules pubs.acs.org/Macromolecules Article
https://doi.org/10.1021/acs.macromol.1c00596
Macromolecules 2021, 54, 4704−4725
4712
In an effort to quantify our results, the patterns over a
specific angular range of 10°−40° were fitted by using Origin
data processing software to a linear combination of a Lorentz
function for the amorphous halo and Pearson functions for the
crystalline peaks, which is a widely accepted fitting procedure
for such materials in the literature.41,53
The total crystallinity
values of the samples were calculated as XRD
χc = [Ic/(Ic + Ia)],
where Ic and Ia are the integrated intensity of all crystalline
peaks and of the amorphous halo, respectively. The
corresponding results are plotted in Figure 10.
The XRD
χc values are calculated as 0%, 44.2%, and 57.3% for
PU-2-60, PU-5-60, and PU-8-60, respectively. As PU-2-60
displays an amorphous halo in its XRD pattern recorded at
room temperature and an endotherm below the room
temperature in its MDSC thermogram, it is reasonable to
obtain the XRD
χc value as 0% for this sample. In addition, the
XRD
χc values of PU-5-60 and PU-8-60 are in a good agreement
with DSC
χc(SS) values calculated from the total heat flow signals.
The total crystalline fractions of the samples prepared at 60 °C
(PU-2-60, PU-5-60, and PU-8-60) are equal to the crystalline
fractions of the PEO soft segments since there is no apparent
thermal transitions related to the hard segments in their
MDSC thermograms (Figure 1a).
The XRD
χc values of PU-2-100, PU-5-100, and PU-8-100 are
calculated as 17.6%, 57.9%, and 67.2%, respectively. The
DSC
χc(PEO) values of these samples, on the other hand, are
determined to be 0%, 34.6%, and 41.4%, respectively. One can
see that the XRD
χc values are significantly different than
DSC
χc(PEO) values for the samples prepared at 100 °C. This
means that there is a significant contribution to the XRD
χc
values, i.e., total crystallinity, of the samples PU-2-100, PU-5-
100, and PU-8-100, which must arise from the presence of
another crystalline phase. We therefore believe that this result
confirms the presence of the PEO−urea α-complex crystals.
To provide a more detailed insight, XRD
χc is defined as XRD
χc
= XRD
χc(PEO) + XRD
χc(α), where XRD
χc(PEO) and XRD
χc(α)
correspond to crystalline fractions of the PEO and the
PEO−urea α-complex, respectively. Assuming the same
standard deviation between XRD
χc(PEO) and DSC
χc(PEO) values
observed for the samples prepared at 60 °C, which is arisen
from the different experimental conditions between XRD and
MDSC analyses, XRD
χc(PEO) values of PU-2-100, PU-5-100, and
PU-8-100 are calculated as 0%, 35.1%, and 42.1%, respectively.
Because PEO
Tm of PU-2-100 is also well below room
temperature (Figure 1b), the XRD
χc(PEO) value is denoted as
0% for this sample. Inserting these XRD
χc(PEO) values into the
equation of XRD
χc = XRD
χc(PEO) + XRD
χc(α), the corresponding
XRD
χc(α) values of PU-2-100, PU-5-100, and PU-8-100 are
calculated as 17.6%, 22.8%, and 25.1%, respectively. The
XRD
χc(α) value of PU-2-100 also includes the crystalline fraction
of the mixed phase containing some “crystallized” PEO chains
with 72 helical conformation and tetragonal urea crystals in line
with the multiple endotherms detected by MDSC analyses
(Figure 1b). Figure 10 also shows the difference in the total
degree of room temperature crystallinity values (Δχc) between
the homologue samples prepared at 60 and 100 °C, i.e., PU-2-
Figure 10. Total crystallinity values of the samples at 25 °C along
with the percent increases arisen from the change in the drying
temperature.
Figure 11. (a) Comparative ATR-IR spectra of PU-2-100 (top spectrum) and PU-2-60 (bottom spectrum) in the 1400−1200 cm−1
region. (b)
Comparative ATR-IR spectra of PU-8-100 (top spectrum), PU-5-100 (middle spectrum), and PU-2-100 (bottom spectrum) in the 1400−1200
cm−1
region.
Macromolecules pubs.acs.org/Macromolecules Article
https://doi.org/10.1021/acs.macromol.1c00596
Macromolecules 2021, 54, 4704−4725
4713
60 vs PU-2-100, PU-5-60 vs PU-5-100, and PU-8-60 vs PU-8-
100, which is induced by the change in the drying temperature
and calculated as PU‑X
Δχc = PU‑X‑100
χc − PU‑X‑60
χc, where X
represents the molecular weight of the PEO used in
kilodaltons. The drying at 100 °C results in (approximately)
18, 14, and 10% increases in the room temperature total
crystallinity values of PU-2, PU-5, and PU-8 copolymers,
respectively (Figure 10).
3.4. Spectroscopy. ATR-IR is a simple but powerful tool
to investigate the characteristic features of PEO−urea α-
complex crystalline structures. Characteristic absorption bands
for α-complex were listed as 1360, 1342, 1277, 1248, 953, and
945 cm−1
.48,51
From these key bands, the absorption bands at
1360, 1277, 1248, and 945 cm−1
are generally assigned to CH2
wagging, CH2 twisting, CH2 rocking, and C−O−C deforma-
tion perpendicular to the chain axis, respectively, whereas the
ones at 1342 and 953 cm−1
correspond to CH2 wagging, CH2
twisting, and rocking conformation parallel to the chain
axis.48,51,54
Because PEO and urea can also form various metastable
complexes with different forms, the difference between the
thermodynamically stable α-complex and the others is mainly
followed by CH2 wagging absorption band of amorphous PEO
chains at 1352 cm−1
. This band has been reported to split into
two bands at 1360 and 1342 cm−1
as a direct result of the
formation of α-complex crystals.46,48,51
This can be clearly seen
when the ATR-IR spectra of PU-2-60 and PU-2-100 provided
in Figure 11a are compared.
When the polymer film is annealed at 60 °C, PEO chains are
mainly in the amorphous state as evidenced by a single
absorption band at 1352 cm−1
in the ATR-IR spectrum of PU-
2-60, given in Figure 11a. On the other hand, when it is
prepared at 100 °C (PU-2-100), this band splits into two peaks
centered at 1360 and 1342 cm−1
as shown in Figure 11a. A
significant effect of PEO molecular weight on the formation of
the PEO−urea α-complex can be seen in the 1400−1200 cm−1
region of the AT-IR spectra provided in Figure 11b for PU-2-
100, PU-5-100, and PU-8-100. As the PEO molecular weight
increases, the peaks at 1360, 1342, and 1277 cm−1
showing the
formation of PEO−urea α-complex become much more
pronounced.
The formation of PEO−urea α-complex can also be
confirmed by Raman spectroscopy. Characteristic Raman
bands of α-complex are listed as 1278, 1237, 862, and 845
cm−1
, whereas the peaks for the metastable complex are
reported to be at 1308, 1259, and 845 cm−1
in the literature.48
These bands are very similar to various crystalline forms of
PEO, and detailed conformational analysis and band assign-
ments can be found in the literature.41,55−57
The 1350−550
cm−1
region of the Raman spectra of PU-2-60 and PU-2-100
are reproduced in Figure 12a. Formation of α-complex in PU-
2-100 is indicated by the presence of well-defined peaks
centered at 1278 and 1237 cm−1
, which are not observed in
PU-2-60, and the sharp peak at 845 cm−1
which is significantly
intense in PU-2-100 compared to PU-2-60 as shown in Figure
12a. Characteristic absorption bands of the α-complex at 1278,
1237, 862, and 845 cm−1
are much more pronounced in the
Raman spectra of PU-5-100 and PU-8-100, which are provided
in Figure 12b together with PU-2-100 for comparison.
The spectroscopic data obtained from ATR-IR and Raman
measurements are in accordance with the results obtained from
MDSC and XRD analyses. Therefore, they can be evaluated
together to provide more detailed structural insight into final
room temperature morphologies of the PU copolymers under
investigation, particularly for the ones prepared at 100 °C.
Considering all these results together, it is interesting to note
that PEO chains are adapted to two different secondary
structures termed 41-helix and 72-helix. One of them (41-helix)
is attributed to the PEO chains confined into the
subnanometer urea channels as demonstrated by the presence
of α-complex crystals, and the other one (72-helix) is assigned
to the ones located in “bulk” PEO crystals. Both structures are
stable in PU-5-100 and PU-8-100 at room temperature as both
materials display two different melting endotherms well above
the room temperature. For PU-2-100, the results basically
suggest that the 41-helix in α-complex is stable at room
temperature. Although multiple endotherms located at high
temperatures (Figure 1b) and the XRD peak located at 23.2°
standing for the crystal plane of (112)PEO are present (Figures
6 and 8b), it is not easy to identify the room temperature
stability of the 72-helix in PU-2-100 as the melting endotherm
belonging to the “bulk” PEO crystals is well below ambient
Figure 12. (a) Raman spectra of PU-2-100 (top spectrum) and PU-2-60 (bottom spectrum) in the 1350−550 cm−1
region. (b) Raman spectra of
PU-8-100 (top spectrum), PU-5-100 (middle spectrum), and PU-2-100 (bottom spectrum) in the 1350−550 cm−1
region.
Macromolecules pubs.acs.org/Macromolecules Article
https://doi.org/10.1021/acs.macromol.1c00596
Macromolecules 2021, 54, 4704−4725
4714
temperature. However, it is more interesting to determine
other possible secondary structures in the PU copolymers
under investigation, particularly PU-5-100 and PU-8-100, in
addition to these two helical conformations. It is well-known
that hydrogen-bonded hard segments in PU copolymersin
generalform secondary structures identical with parallel/
antiparallel (mostly antiparallel) β-sheets found in native
structures like spider silk. Determining these structures in the
presence of the two helical conformations demonstrated here
would allow for a better understanding of intermolecular
interactions and packing behavior between these sheets and
helices. More importantly, it can provide a convenient
framework to reconcile structural similarities between synthetic
PU copolymers and protein-based materials containing such
secondary structures, such as spider silk.58−66
Most recently,
Johnson et al.67
investigated the influence of such secondary
structures, α-helix and β-sheet in particular, on the mechanical
properties of peptide−polyurea hybrids based on 1,6-hexam-
ethylene diisocyanate (HDI) and poly(dimethylsiloxane)
(PDMS, 2500 g/mol) incorporated by either poly(β-benzyl-
L-aspartate) (PBLA) or poly(ε-carbobenzyloxy-L-lysine)
(PZLY) peptide blocks with different sequence length in the
form of “peptide-b-PDMS-b-peptide”. ATR-IR studies con-
ducted by these authors verified the existence of the desired
secondary structures despite the simplicity of the polyureas.
They observed mixtures of α-helix and β-sheet in those
polymers consisting of longer peptidic segments. Besides,
Tanaka et al.68
studied the secondary structures in highly
crystallized ABA triblock copolymers (PBLA−PEO−PBLA)
containing PEO blocks with Mn values of 11000 and 20000 g/
mol. FT-IR results reported by these authors revealed the
formation of a specific α-helix−72-helix−α-helix conformation.
They did not observe the β-sheet conformation in as-casted
samples, but they reported a structural change from an α-helix
to a β-sheet conformation induced by thermal treatment. The
forenamed natural design motifs, secondary structures, were
also examined by Sogah’s group69,70
in silk-inspired multiblock
copolymers containing poly(alanine-b-oxyethylene-b-alanine)
triblock (Mn = 823 and 1097 g/mol) comprising short PEG as
a nonnative equivalence of the amorphous polypeptide domain
of a spider silk.69
They demonstrated the formation of β-sheets
and their assembly into discrete nanostructures.69
These
secondary structures are usually followed by amide-I and
amide-II regions of the ATR-IR spectra, which are provided in
Figure 13a for the PU copolymers prepared at 100 °C.
Although secondary structure characterization has received
particular attention in such polymeric systems containing
peptidic units, the respective spectral regions (amide-I and
amide-II) in non-peptide-based PU copolymers like our
materials have not been comprehensively analyzed in terms
of those secondary structures. More specifically, despite the
extensive base of PU literature, at least to the best of our
knowledge, there are no reports where qualitative and
quantitative assessments of secondary structures, and their
effects on structure−property relationships of final materials
have been systematically investigated as a function of critical
design parameters like molecular weights of soft and hard
segments. In the present work, we give an exclusive focus on
the secondary structure determination as a part of our
continuing efforts to provide more structural insight into the
PU copolymers under investigation for a better understanding
of their structure−property behavior. As shown in Figure 13a,
at first glance, three different peaks are clearly visible at 1715−
1711, 1633−1629, and 1557−1550 cm−1
in the ATR-IR
spectra of the samples. In polyurethane literature, these peaks
are usually assigned to “ordered” urethane CO, “ordered”
urea CO stretching, and amide-II vibrations, respectively.4
In line with this, quantification of these peaks is generally
performed to determine the extent of hard segment phase
separation by calculating percent amounts of different carbonyl
groups representing non-hydrogen-bonded, hydrogen-bonded,
disordered, and ordered structures.71
However, such descrip-
tions do not allow for the identification of the forenamed
secondary structures in PU copolymers, which is of particular
interest to understand the packing behavior in such complex
materials along the multiple length scales.
In addition, as it can be seen in Figure 13a, the respective
region is very broad due to overlapping of several peaks
Figure 13. (a) Comparative ATR-IR spectra of PU-8-100 (top spectrum), PU-5-100 (middle spectrum,) and PU-2-100 (bottom spectrum) in the
1750−1500 cm−1
region. (b) Representative amide-I band deconvolution in PU-8-100. Six different peaks with peak maxima at 1711 cm−1
(β-
turnpeak‑I), 1699 cm−1
(β-turnpeak‑II), 1683 cm−1
(β-turnpeak‑III), 1668 cm−1
(β-sheetpeak‑I), 1652 cm−1
(41-helix), and 1629 cm−1
(β-sheetpeak‑II) are
detected by deconvolution.
Macromolecules pubs.acs.org/Macromolecules Article
https://doi.org/10.1021/acs.macromol.1c00596
Macromolecules 2021, 54, 4704−4725
4715
originating from the presence of different secondary structures.
This suggests that the respective regions should be investigated
in detail to provide more structural insight into the materials.
To this end, a typical deconvolution procedure, which is
summarized in section 2.4, is carefully applied to provide a
clear overview on the secondary structures in the PU
copolymers prepared at 100 °C. Figure 13b representatively
displays the deconvoluted amide-I peaks in the 1750−1600
cm−1
region of the ATR-IR spectra of PU-8-100. The
corresponding results obtained from PU-2-100 and PU-5-100
are also provided in Figures S6 and S7, respectively.
Six different peaks are found at 1715−1711, 1699, 1683,
1668, 1652, and 1633−1629 cm−1
for these three samples, i.e.,
PU-2-100, PU-5-100, and PU-8-100. The peaks at 1715−1711
cm−1
(at 1713 cm−1
for PU-2-100, at 1714 cm−1
for PU-5-100,
and at 1711 cm−1
for PU-8-100) as well as 1699 and 1683
cm−1
originate from the presence of several different HMDI
isomers, such as trans,trans (E, E), trans,cis (E, Z), and cis,cis
(Z, Z). HMDI isomers affect the packing behavior in the solid
state. This in turn restricts the formation of the well-ordered
hydrogen-bonded structures in the PU copolymers.71
There-
fore, it is reasonable to consider that these three peaks mainly
represent the monodentate hydrogen-bonded structures.
However, for these three peaks, the relative hydrogen-bonding
strength is different than each other. Considering the peak
positions, it should be noted that the peak at 1683 cm−1
represents a monodentate, but relatively well-ordered, hydro-
gen-bonded structure (relatively stronger hydrogen bonding)
compared to the peaks at 1699 and 1715−1711 cm−1
. In other
words, the degree of imperfection in monodentate hydrogen
bonding for the structures giving rise to the formation of these
three peaks can be listed as follow: 1715−1711 cm−1
> 1699
cm−1
> 1683 cm−1
. In terms of secondary structures, we
consider that these peaks can be assigned to β-turns since they
are mainly formed by monodentate hydrogen bonds and create
loops at the chain ends. The peaks at 1668 and 1633−1629
cm−1
(at 1633 cm−1
for PU-2-100, at 1631 cm−1
for PU-5-100,
and at 1629 cm−1
for PU-8-100) are assigned to antiparallel β-
sheets, whereas the peak at 1652 cm−1
is mainly attributed to
41-helix. The antiparallel β-sheets are formed by the bidentate
hydrogen-bonded highly ordered urea molecules on the walls
of the channels, whereas the excess urea molecules inside the
channels adapt to 41-helix conformation as well as confined
PEO chains. In accordance with this, characteristic amide-II
peaks of the 41-helix and β-sheet secondary structures are also
detected at 1557−1550 cm−1
(41-helix), 1535 cm−1
(β-sheet),
and 1515 cm−1
(β-sheet) by the deconvolution. The
corresponding results are provided in Figures S8−S10. Similar
results are obtained in the literature.72
It should be emphasized
that the peak around 1652 cm−1
is usually assigned to several
Figure 14. Fractions (ϕ) of the secondary structures as a function of soft segment molecular weight: (a) Fractions of β-turnpeak‑I (1715−1711
cm−1
) are calculated as PU‑2
ϕI = 14.5%, PU‑5
ϕI = 10.5%, and PU‑8
ϕI = 5.2%. Fractions of β-turnpeak‑II (1699 cm−1
) are determined to be PU‑2
ϕII =
15.6%, PU‑5‑100
ϕII = 11.5%, and PU‑8‑100
ϕII = 6.3%. (b) Fractions of β-turnpeak‑III (1683 cm−1
) are calculated as 12.9%, 10.5%, and 7.5% for PU-2-100,
PU-5-100, and PU-8-100, respectively.
Figure 15. Fractions (ϕ) of the secondary structures as a function of soft segment molecular weight: (a) Fractions of the 41-helix: 41‑helix
ϕPU‑2‑100 =
19%, 41‑helix
ϕPU‑5‑100 = 22.5%, and 41‑helix
ϕPU‑8‑100 = 27%. (b) Fractions of the β-sheet: β‑sheet
ϕPU‑2‑100 = 38%, β‑sheet
ϕPU‑5‑100 = 45%, and β‑sheet
ϕPU‑8‑100 =
54%.
Macromolecules pubs.acs.org/Macromolecules Article
https://doi.org/10.1021/acs.macromol.1c00596
Macromolecules 2021, 54, 4704−4725
4716
helical structures, such as α-helix and 31-helix for different
materials. This suggests that the respective peak should be
particularly examined for each system. In our case, the peak at
1652 cm−1
is attributed to 41-helix for the PU copolymers
under investigation as it is also characterized by a series of
experiments in this study.
On the other hand, the deconvolution allows for quantitative
assessment of the secondary structures listed above. Figures 14
and 15 display the fractions of the secondary structures as a
function of soft segment molecular weight. In a general form,
the fraction is defined as follow: s
ϕ = s
Apeak/Atotal, where s,
s
Apeak, and Atotal illustrate the secondary structure, the area
under the respective peak, and the total area under the
cumulative peak, respectively.
The peaks at 1715−1711 cm−1
(β-turnpeak‑I), 1699 cm−1
(β-
turnpeak‑II), and 1683 cm−1
(β-turnpeak‑III) are assigned to β-turn
secondary structures. The total β-turn fraction is defined as
β‑turn
ϕPU‑X‑100 = β‑turn‑peak‑I
ϕPU‑X‑100 + β‑turn‑peak‑II
ϕPU‑X‑100 +
β‑turn‑peak‑III
ϕPU‑X‑100 where X represents ⟨Mn⟩ of the PEO in
kilodaltons. β‑turn‑peak‑I
ϕPU‑X‑100 and β‑turn‑peak‑II
ϕPU‑X‑100 are equal
to PU‑X
ϕI and PU‑X
ϕII values denoted for β-turnpeak‑I and β-
turnpeak‑II in Figure 14a, respectively, whereas ϕ values in
Figure 14b represent β‑turn‑peak‑III
ϕPU‑X‑100 for β-turnpeak‑III. It
should be noted that β-turnpeak‑III, the peak at 1683 cm−1
, is
also termed “monodetate hydrogen bonded and/or disordered
helix” in the literature.72
Because of this reason, its relationship
with PEO molecular weight is provided in a separate plot
(Figure 14b), and its assignment is denoted with a “question
mark”. The β-turnpeak‑I fractions of PU-2-100, PU-5-100, and
PU-8-100 are calculated as 14.5%, 10.5%, and 5.2%, whereas
their β-turnpeak‑II fractions are determined to be 15.6%, 11.5%,
and 6.3%, respectively (Figure 14a). The β-turnpeak‑III fractions
of these three samples (PU-2-100, PU-5-100, and PU-8-100)
are calculated as 12.9%, 10.5%, and 7.5%, respectively (Figure
14b). Accordingly, their total β-turn fractions are determined
to be β‑turn
ϕPU‑2‑100 = 43%, β‑turn
ϕPU‑5‑100 = 32.5%, and
β‑turn
ϕPU‑8‑100 = 19%. As shown in Figure 14, β‑turn‑peak‑I
ϕ,
β‑turn‑peak‑II
ϕ, β‑turn‑peak‑III
ϕ, and thus β‑turn
ϕ linearly decrease
with increasing soft segment molecular weight (SSMW) since
the number of chain ends decreases with increasing SSMW.
In contrast, the fractions of both 41-helix (Figure 15a) and β-
sheet (Figure 15b) secondary structures linearly increase with
increasing SSMW (Figure 15). This is due to the fact that
increasing SSMW also means increasing hard segment
molecular weight and, thus, the increasing number of urea
molecules that can participate in the secondary structure
formation. The 41-helix fractions (41‑helix
ϕ) of PU-2-100, PU-5-
100, and PU-8-100 are calculated as 19%, 22.5%, and 27%
(Figure 14a), whereas their β-sheet fractions (β‑sheet
ϕ) are
determined to be 38%, 45%, and 54%, respectively (Figure
15b).
The 41‑helix
ϕ values are calculated as the area under the peak
at 1652 cm−1
divided by the area under the cumulative peak
(41‑helix
ϕ = A1652/Atotal). Likewise, the β‑sheet
ϕ values are
calculated as the total area under the peaks at 1668 and
1629 cm−1
divided by the area under the cumulative peak
(β‑sheet
ϕ = (A1668 + A1629)/Atotal). As a part of the α-complex
crystals, the 41-helix is also the conformation of the excess urea
molecules inside the channels that adapt to the same
conformation with the confined PEO chains within the
channels. The β-sheet, on the other hand, is the conformation
of the well-ordered urea molecules on the channel walls of the
α-complex crystals. The quantitative results obtained from the
deconvolution also support the presence of the α-complex
crystals and their structural features. Based on the secondary
structures, the superstructure of the α-complex crystals can be
defined as the combination of three different layers: one
internal (41-helix) and two external layers, i.e., the channel
walls (β-sheet). Based on this three-layer model, the total
fraction of the α-complex crystals can be calculated as α‑complex
ϕ
= [41‑helix
ϕ + (β‑sheet
ϕ/2)]/2. Using this equation, we
determined α‑complex
ϕ values of PU-2-100, PU-5-100, and PU-
8-100 to be 19%, 22.5%, and 27%, respectively. The α‑complex
ϕ
values are in a good agreement with the XRD
χc(α) values, which
are calculated as 17.6%, 22.8%, and 25.1% for PU-2-100, PU-5-
100, and PU-8-100, respectively.
3.5. Microscopy. Microscopic studies of the samples were
performed by OM and AFM techniques. Figure 16 shows OM
images of PU-2-60 and PU-2-100 recorded at room temper-
ature. As an expected result, PU-2-60 does not display any
microstructural feature since it is completely amorphous at
ambient temperature (Figure 16a). This is also confirmed by
AFM studies (Figure S11a). In line with this, the AFM phase
image recorded with a scan size of 200 × 200 nm2
displays
typical nanoscale morphology comprising dissolved hard
segments in the soft matrix (Figure S11b). These results are
in an excellent agreement with the results obtained from
MDSC, XRD, FT-IR, and Raman spectroscopy.
As shown in Figure 16b, PU-2-100 shows microcrystalline
domains distributed in an amorphous matrix. This observation
provides a convenient framework to examine the origins of
multiple high-temperature endotherms observed in the MDSC
Figure 16. Optical microscope images of (a) PU-2-60 and (b) PU-2-100 at 25 °C.
Macromolecules pubs.acs.org/Macromolecules Article
https://doi.org/10.1021/acs.macromol.1c00596
Macromolecules 2021, 54, 4704−4725
4717
thermograms. As the melting point of PEO crystals is below
room temperature, the apparent crystalline phases in PU-2-100
should be related to the α-complex crystals giving rise to the
formation of the high-temperature endotherms. To clearly
identify the form of microcrystalline domains, a high-
magnification image of one of the microcrystalline domains
is also presented in Figure 17a. These results are of importance
from two different perspectives: First, the presence of
microcrystals in the image of PU-2-100 recorded at room
temperature basically proves that at least one of the multiple
endotherms at high temperatures are not formed during the
MDSC heating scan. Second, the apparent crystal shape also
confirms our claim about the presence of the α-complex
crystals. If we assume that one of the high-temperature
endotherms is originated from the presence of “pure”
microcrystalline hard domains solely formed by hydrogen-
bonded hard segments, one should expect to see some needle-
like structures as the hard segments mainly consist of urea
groups. However, this is not the case here. This mainly
suggests that at least one of the endotherms at high
temperatures is due to the melting of a crystalline phase
already present in the material. Considering the apparent shape
of the crystals along with the data obtained from XRD, ATR-
IR, and Raman spectroscopy measurements, this phase is
considered to be formed by the α-complex crystals.
In this respect, one can envisage two plausible scenarios: (I)
These three endotherms might originate from the melting of
the α-complex crystals with three different domain sizes. (II)
The two of the three endotherms, most probably the ones at
176 and 184 °C, might arise from the melting/microphase
mixing of ordered hard domains formed by microphase
separation process characterized with a peak temperature of
119 °C during the MDSC heating scan. However, one of them,
most probably the one at 192 °C, originates from the melting
of a crystalline phase that already exists in the material as
observed by OM and AFM (Figures 16b and 17). We believe
that the first scenario is relatively more plausible as presented
in Figure 5a.
The nanoscale phase morphology comprising a stack of
hexagonal nanoplatelets shown in Figure 17b is in a good
agreement with the literature. PEO molecular-weight-depend-
ent morphologies of single crystals of the PEO/Urea α-
complex in the range 1000−100000 g/mol were analyzed by
using scanning electron microscopy by Chenite and Brisse.45
The authors suggested that for the high Mw values the
morphology is more likely to be a stack of hexagonal platelets
rather than that of elongated pseudohexagonal prisms with
very smooth faces which is mainly accounted for low-
molecular-weight compounds. Considering the Mw of PU-2-
Figure 17. Morphology of PEO−urea α-complex crystals as demonstrated by the optic microscope (a) and AFM phase (b) images along the
multiple length scales.
Figure 18. Optical microscope images of (a) PU-8-60 and (b) PU-8-100 at 25 °C.
Macromolecules pubs.acs.org/Macromolecules Article
https://doi.org/10.1021/acs.macromol.1c00596
Macromolecules 2021, 54, 4704−4725
4718
100 (106000 g/mol), our results are in a good agreement with
the observations made by Chenite and Brisse.
Upon these observations on the copolymer based on PEO-
2000 soft segment, it is reasonable to consider that the
structure formation in the material prepared at 60 °C (PU-2-
60) is mainly governed by the lateral packing73−75
of the
bidentate H-bonded urea groups from molecular level to
nanoscale. In general, the lateral packing results in fibrillar
phase-separated morphologies comprising an infinite stack of
1D H-bonded structures. This mechanism is also effective in
PU-2-60, but only up to a certain length scale. The apparent
nanoscale features therefore begin to disappear beyond this
length scale (Figure S11a), and they are no longer visible at
larger length scales (Figure 16a). On the contrary, when the
samples are prepared at 100 °C, the structure formation is
mainly driven by the confined crystallization of the PEO chains
in subnanometer urea channels giving rise to the formation of
the thermodynamically stable α-complex crystals. This is
because both soft and hard segments have sufficient mobility to
form the most stable conformation via strong intermolecular
hydrogen bonding between the PEO ether oxygens and the
urea N−H groups. Hence, they are cooperatively assembled
into the tightly packed trigonal form with minimum free
energy. A similar mechanism is also reported for the respective
model compounds.48
The OM images of PU-8-60 (Figure 18a) and PU-8-100
(Figure 18b) recorded at room temperature are provided in
Figure 18. On one hand, the OM image of PU-8-60 (Figure
18a) shows a typical spherulitic morphology of crystalline PEO
with well-defined grain boundaries. As the formation of this
structure is well-known in the literature, it will not be further
discussed here. On the other hand, a geometrically confined
crystalline morphology is observed for PU-8-100 (Figure 18b).
This poses the question of how the confined crystallization of
the PEO chains in the subnanometer urea channels does relate
to the geometric confinement at the microscopic level. Before
getting into this discussion, we should note that the
morphologies presented for PU-8-60 and PU-8-100 represent
the ones observed in PU-5-60 and PU-5-100, respectively.
Furthermore, the presence of the α-complex crystals in PU-5-
100 and PU-8-100 is also evidenced by the microscopic
analyses at a temperature (60 °C) above the melting points of
PEO crystals as representatively shown in Figure S12. We can
therefore conclude that both the monoclinic PEO and the
trigonal α-complex crystals present in both PU-5-100 and PU-
8-100 at ambient temperature.
However, this conclusion poses the question of how the final
room temperature morphology given in Figure 18b is formed
in the copolymers comprising both PEO and PEO−urea α-
complex crystals. To address this issue, AFM is used to
examine the phase morphologies at smaller length scales. For
both PU-5-100 and PU-8-100, a “beads on a string” type
nanoscale morphology consisting of compact globular domains
is observed. An AFM image recorded on PU-8-100 is
representatively shown in Figure 19. Each globular domain is
isotropically distributed at nanoscale. The average size of a
globular domain of PU-8-100 is 48 ± 4 nm, whereas that of
PU-5-100 is 25 ± 3 nm. This means that each globular domain
consists of tightly packed secondary structures demonstrated
above (72-helix, 41-helix, and β-sheet). However, the question
of which forces drive the formation of these globular domains
with well-defined internal secondary structures still remains to
be addressed.
In principle, any self-avoiding flexible polymer chain would
form a great number of secondary structures since it is basically
driven to become more and more compact through any
attractive force among the chain monomers.76
This means that
the structure formation in compact polymers is mainly related
to the severity of steric constraints.76
This steric principle of
organization can provide a plausible explanation for why the
samples dried at 100 °C are more compact than the ones dried
at 60 °C. We basically have more steric constraints, i.e.,
geometric confinement, in the samples dried at 100 °C as
compared to the ones dried at 60 °C since we have two
mechanisms in which we have geometric confinement effects,
i.e., the formation of PEO−urea α-complex crystals and the
“bulk” crystallization of PEO segments in the former, whereas
we have only one of them, i.e., the “bulk” crystallization of
PEO segments, in the latter. The only notable geometric
confinement arisen from the “bulk” crystallization of PEO
segments is the acquirement of the trans−gauche−trans (ttg)
conformation in the ethylene oxide units in the crystalline PEO
soft domains with helical conformation (72-helix). This gives
rise to a decrease in the conformation entropy. In addition, the
oxygen atoms in these ethylene oxide units reside in the core of
the helix surrounded by hydrophobic methylene groups40
due
to the presence of packed antiparallel helical strands with
opposing handedness. This leads to hydrophobic core
development in the materials.
The formation of PEO−urea α-complex crystals, on the
other hand, brings more steric constraints as it comprises
confined crystallization of PEO within the subnanometer urea
channels, “ordering” of hydrogen-bonded urea groups with
antiparallel β-sheet conformation on the walls of the channels.
Similar to the “bulk” crystallization case, the acquirement of
the (tgt)4 conformation in the ethylene oxide units in the
confined helical PEO crystals (41-helix) also leads to a decrease
in the conformation entropy. This is a relatively more
substantial decrease since 41-helix is more squashed than 72-
helix. The formation of hydrogen-bonded urea groups with
antiparallel β-sheet conformation contributes to the reduction
Figure 19. “Beads on a string” type morphology observed in PU-8-
100 along the multiple length scales as demonstrated by the AFM
phase image with a scale bar of 500 nm.
Macromolecules pubs.acs.org/Macromolecules Article
https://doi.org/10.1021/acs.macromol.1c00596
Macromolecules 2021, 54, 4704−4725
4719
of conformational entropy. Two mechanisms take place in the
samples dried at 100 °C along with the “bulk” crystallization of
PEO. Hence, the geometric confinement is, overall, more
severe in these samples. The severity of steric constraints
enables them to collapse to highly compact globular domains
with large amounts of tightly packed secondary structures. This
may be of interest in designing synthetic replica of certain
proteins with specific internal architectures. As illustrated in
Figure 20, we can create various morphologies containing
distinctly different substructures based on the same basic
building blocks solely by adjusting soft segment molecular
weight and drying temperature.
3.6. Tensile Properties. Stress−strain curves of the PU
copolymers are provided in Figure 21. PU-2-based samples
display a well-defined elastomeric behavior while PU-5 and
PU-8 based films show a typical elastoplastic behavior with a
distinct initial elastic response followed by yielding, softening,
hardening, and then failure. This is because the soft segment in
PU-2 is completely amorphous and (due to its Tg) highly
mobile at room temperature whereas it is semicrystalline in
both PU-5 and PU-8.
Significant differences are observed in the tensile behavior of
homologous PUs regarding drying temperature. The drying at
100 °C results in dramatic improvements in mechanical
properties of all the copolymers under investigated. The results
obtained from tensile tests are summarized in Table 3. As
compared to PU-2-60, PU-5-60, and PU-8-60, 276, 208, and
84% increases in elastic modulus (E), 13.6, 56.4, and 118%
increases in ultimate tensile strength (σmax), 18.6, 31.3, and
63.8% increases in elongation at break (ε), and 93.6, 123, and
213% increases in toughness (W) are obtained in PU-2-100,
PU-5-100, and PU-8-100, respectively. In line with this, yield
strengths (σy) of PU-5-100 and PU-8-100 are 103 and 72%
higher than those of PU-5-60 and PU-8-60, respectively. No
distinct yield is observed for PU-2 based samples due to their
well-defined elastomeric behavior.
These enhancements that arise from the change in drying
temperature are mainly attributed to the structural and
morphological changes along the multiple length scales
demonstrated in previous sections. More specifically, the
hierarchical self-assembly of tightly packed secondary
structures along the multiple length scales based on the
confined crystallization of PEO chains in subnanometer urea
Figure 20. Schematic representations of the morphologies and structures demonstrated here: (a) Nanoscale morphology of PU-2-60 whose
microscale morphology is completely amorphous. (b−d) Microscale morphologies of PU-2-100 (b), PU-5-60 and PU-8-60 (c), and PU-5-100 and
PU-8-100 (d). (e) Hierarchical self-assembly found in PU-5-100 and PU-8-100 along the multiple length scales. (f) Model network representation
of the hierarchical structures formed in a single macromolecular PU domain.
Macromolecules pubs.acs.org/Macromolecules Article
https://doi.org/10.1021/acs.macromol.1c00596
Macromolecules 2021, 54, 4704−4725
4720
channels in the samples dried at 100 °C is the main reason for
notable increases in their mechanical properties as compared
to those of the samples dried at 60 °C since this enables the
structural elements involved in this hierarchical architecture to
work cooperatively and maintain a homogeneous deformation
state at each hierarchical level along the multiple length scales.
This is because the formation of α-complex crystals ensures
the confinement of key secondary structures and hence the
hydrogen bonds. When confined, hydrogen bonds are
deformed within a small region corresponding to the size of
several bonds in which the deformation and rupture of
hydrogen bonds are delocalized. The formation of α-complex
crystals means a greatly increased density of hydrogen bonds
and the formation of densely packed interlocking regions
where hydrogen bonds act in the “confined” state (delocalized
deformation) which ensures an effective load transfer between
Figure 21. Expanded initial regions and complete stress−strain curves of the PU copolymers under investigation: (a, b) PU-2-60 vs PU-2-100, (c,
d) PU-5-60 vs PU-5-100, and (e, f) PU-8-60 vs PU-8-100. E = elastic modulus; W = toughness (work to fracture).
Table 3. Mechanical Properties of the PU Films Investigated
sample E (MPa) σy (MPa) σmax (MPa) ε (%) W (MJ m−3
)
PU-2-60 5.1 ± 0.3 30.1 ± 1.1 1000 ± 64 94.0 ± 6.7
PU-2-100 19.2 ± 2.8 34.2 ± 1.6 1240 ± 48 182 ± 9.3
PU-5-60 145 ± 19 7.72 ± 0.8 28.7 ± 1.3 627 ± 51 103 ± 7.8
PU-5-100 447 ± 23 15.7 ± 1.1 44.9 ± 2.4 823 ± 42 230 ± 14
PU-8-60 370 ± 20 11.6 ± 0.7 24.4 ± 3.4 412 ± 33 67.2 ± 5.7
PU-8-100 683 ± 36 20.0 ± 0.4 53.2 ± 5.1 675 ± 27 210 ± 12
Macromolecules pubs.acs.org/Macromolecules Article
https://doi.org/10.1021/acs.macromol.1c00596
Macromolecules 2021, 54, 4704−4725
4721
the chains under tension. Densely packed hydrogen bonds in
these crystalline regions eventually break and allow strands of
secondary structures to slide, leading to the separation of
smaller intact crystals. This markedly contributes to the
strength, extensibility, and toughness.
For PU-2, the geometric confinement is limited to the
confinement of hydrogen bonds in α-complex crystals. Hence,
from a mechanical point of view, the presence of α-complex
crystals solely suggests a more robust elastomeric network for
PU-2-based samples. The E, σmax, ε, and W of PU-2-100 are
therefore higher than those of PU-2-60. However, the
formation of α-complex crystals is even more important for
PU-5 and PU-8 since it leads up to the geometric confinement
of other structural elements, such as soft segment crystals (72-
helix), changes the entire structural hierarchy along the
multiple length scales, and hence influences each deformation
regime under tension. In this case, the geometric confinement
is not only limited to the confinement of hydrogen bonds in α-
complex crystals. These nanocrystals, and hence 41-helices and
β-sheets, along with helical soft segment crystals are also
confined into the compact globular domains (Figure 19). At
nanoscale, these compact globular domains (Figure 19) can be
considered as the three-dimensional “composite” network of
different secondary structures that stiff complex nanocrystals
containing 41-helices and β-sheets embedded in a semicrystal-
line matrix with 72-helices. Under tension, this three-dimen-
sional “composite” network shows a distinct elastic response
up to a yield point. At the yield, hydrogen bonds in relatively
more disordered secondary structures in the matrix phase
break and hence the materials undergoes a softening regime in
which the semicrystalline matrix phase unfolds along the
stretching direction. The softening is mainly due to the
unravelling of hidden length unlocked as a result of the rupture
of hydrogen bonds. This is then followed by a stiffening regime
where the load is mainly transferred from a fully extended
matrix phase to stiff complex nanocrystals whose plastic
deformation eventually results in failure.
At microscale, the geometric confinement along the multiple
length scales leads to a microstructure that consists of
homogeneously distributed small microcrystals and does not
have sharp grain boundaries. This means that these micro-
crystals are also in a confined state. This explains why PU-5-
100 and PU-8-100 have greater stiffness and strength
compared to PU-5-60 and PU-8-60 which have a lot larger
microcrystals and sharp grain boundries. Hence, the geometric
confinement along the multiple length scales plays a key role in
achieving remarkably enhanced stiffness, strength, extensibility,
and toughness.
4. CONCLUSION
Here we mainly conclude that geometric confinement governs
stiffness, strength, extensibility, and toughness in sol-cast PU
films. Soft segment molecular weight and drying temperature
are demonstrated to be practical and effective design/
processing parameters to tune the severity of geometric
confinement. This approach, i.e., tuning the severity of
geometric confinement via simple parameters, can be utilized
to produce advanced PU-based materials with well-defined
hierarchical structures and desired functional properties and,
hence, to address the challenge of attaining unprecedented
combinations of stiffness, strength, extensibility, and toughness.
In line with this main conclusion, several important findings
may be highlighted as follows:
• Governing mechanism behind the structure formation in
the PU copolymers investigated displays significant
variations depending on soft segment molecular weight
and drying conditions. On one hand, phase mixing plays
a key role for final morphology and associated properties
of the PU-2 copolymer, when its sol-cast films are dried
at 60 °C as demonstrated in PU-2-60. No notable
confinement is observed for this sample. On the other
hand, the structure formation is mainly driven by the
confined crystallization of PEO chains in subnanometer
urea channels, which gives rise to the formation of α-
complex crystals, and the final morphology consists of
“microphase-separated” clusters of these complex
crystals at larger length scales, when they are dried at
100 °C as shown in PU-2-100. The geometric
confinement is only limited to the primary and
secondary structures forming the α-complex crystals.
No confinement is observed at larger length scales.
• For PU-5 and PU-8, bulk crystallization of the PEO soft
segments controls the structure formation, and hence
the final semicrystalline (spherulitic) morphology
governs their structure−property relations when their
sol-cast films are dried at 60 °C as demonstrated in PU-
5-60 and PU-8-60. The geometric confinement in these
samples is only limited to the conformation of ethylene
oxide units in the PEO crystals. There is no considerable
confinement at larger length scales, especially at the
microlevel. When they are dried at 100 °C, an elegant
hierarchical self-assembly (spanning length scales from
angstroms to micrometers) is observed as shown in PU-
5-100 and PU-8-100. The geometric confinement is of
particular importance for this structural hierarchy
responsible for a unique combination of mutually
exclusive mechanical properties, i.e. stiffness, strength,
extensibility, and toughness. The structure formation in
these samples is driven by the confined crystallization of
helical PEO chains in subnanometer urea channels and
complemented by the “bulk” crystallization of PEO
matrix phase and/or the microphase separation. In this
case, the “bulk” crystallization of the PEO matrix phase
also takes place in a confined space as due to the
presence of α-complex crystals. However, we use the
term “bulk” here to distinguish these two crystallization
mechanisms from each other. In addition, the micro-
phase separation here refers to the “separation” of the
crystalline domains from the amorphous regions at
larger length scales. Overall, these samples show severe
geometric confinement.
• The structural hierarchy demonstrated here contains
synthetic replica of natural design motifs like helices,
antiparallel β-sheets, and β-turns with dimensional
features comparable to those found in native structures.
Hence, our findings might be of interest in mimicking
certain protein structures containing these design motifs.
• In addition to the structural changes highlighted above,
it should be noted that the increase in total crystallinity
is also important for a better understanding of the
significant variations in mechanical properties.
Macromolecules pubs.acs.org/Macromolecules Article
https://doi.org/10.1021/acs.macromol.1c00596
Macromolecules 2021, 54, 4704−4725
4722
oguz2021.pdf
oguz2021.pdf
oguz2021.pdf

More Related Content

Similar to oguz2021.pdf

Degradation of poly-L-lactide. Part 1, IMechE, 2004
Degradation of poly-L-lactide. Part 1, IMechE, 2004Degradation of poly-L-lactide. Part 1, IMechE, 2004
Degradation of poly-L-lactide. Part 1, IMechE, 2004Dr Neill Weir
 
Depolymerization OF PP Review Article
Depolymerization OF PP Review ArticleDepolymerization OF PP Review Article
Depolymerization OF PP Review ArticleParag Kulkarni
 
Processing, annealing and sterilisation of poly-l-lactide, Biomaterials, 2003
Processing, annealing and sterilisation of poly-l-lactide, Biomaterials, 2003Processing, annealing and sterilisation of poly-l-lactide, Biomaterials, 2003
Processing, annealing and sterilisation of poly-l-lactide, Biomaterials, 2003Dr Neill Weir
 
Thesis ChenQ
Thesis ChenQThesis ChenQ
Thesis ChenQQi Chen
 
Cossiello Synthetic Metals Capa
Cossiello   Synthetic Metals   CapaCossiello   Synthetic Metals   Capa
Cossiello Synthetic Metals CapaRafael Cossiello
 
OPTUM® Technology an innovative barrier solution for polypropylene-based mate...
OPTUM® Technology an innovative barrier solution for polypropylene-based mate...OPTUM® Technology an innovative barrier solution for polypropylene-based mate...
OPTUM® Technology an innovative barrier solution for polypropylene-based mate...José Luis Feijoo
 
Optum® Technology an innovative barrier solution for polypropylene based mate...
Optum® Technology an innovative barrier solution for polypropylene based mate...Optum® Technology an innovative barrier solution for polypropylene based mate...
Optum® Technology an innovative barrier solution for polypropylene based mate...Sergio Torres-Giner
 
Masters_Thesis_Presentation_9-3-15
Masters_Thesis_Presentation_9-3-15Masters_Thesis_Presentation_9-3-15
Masters_Thesis_Presentation_9-3-15Denise Williamson
 
Electrospn 18 casasola-full
Electrospn 18 casasola-fullElectrospn 18 casasola-full
Electrospn 18 casasola-fullmiroli
 
Crimson Publishers-Poly(Glycerol-Sebacate) Elastomer: A Mini Review
Crimson Publishers-Poly(Glycerol-Sebacate) Elastomer: A Mini ReviewCrimson Publishers-Poly(Glycerol-Sebacate) Elastomer: A Mini Review
Crimson Publishers-Poly(Glycerol-Sebacate) Elastomer: A Mini ReviewcrimsonpublishersOOIJ
 
Shrinkage of Polyester Fibre in Selected Chlorinated Solvents and Effects on ...
Shrinkage of Polyester Fibre in Selected Chlorinated Solvents and Effects on ...Shrinkage of Polyester Fibre in Selected Chlorinated Solvents and Effects on ...
Shrinkage of Polyester Fibre in Selected Chlorinated Solvents and Effects on ...IOSR Journals
 
Degradation of poly-L-lactide. Part 2, IMechE, 2004
Degradation of poly-L-lactide. Part 2, IMechE, 2004Degradation of poly-L-lactide. Part 2, IMechE, 2004
Degradation of poly-L-lactide. Part 2, IMechE, 2004Dr Neill Weir
 
Impact of Gamma Irradiation on Structural and Dielectric Properties of CuI-PV...
Impact of Gamma Irradiation on Structural and Dielectric Properties of CuI-PV...Impact of Gamma Irradiation on Structural and Dielectric Properties of CuI-PV...
Impact of Gamma Irradiation on Structural and Dielectric Properties of CuI-PV...iosrjce
 
Incorporation of Se (IV) Complexes based on Amino Acids in Biomatrixes in Hyd...
Incorporation of Se (IV) Complexes based on Amino Acids in Biomatrixes in Hyd...Incorporation of Se (IV) Complexes based on Amino Acids in Biomatrixes in Hyd...
Incorporation of Se (IV) Complexes based on Amino Acids in Biomatrixes in Hyd...IIJSRJournal
 
Marras nanostruct vs microst
Marras nanostruct vs microstMarras nanostruct vs microst
Marras nanostruct vs microstsotmarr
 
Review of Tribological characteristics of Modified PEEK Composites
Review of Tribological characteristics of Modified PEEK  CompositesReview of Tribological characteristics of Modified PEEK  Composites
Review of Tribological characteristics of Modified PEEK Compositesvivatechijri
 

Similar to oguz2021.pdf (20)

Degradation of poly-L-lactide. Part 1, IMechE, 2004
Degradation of poly-L-lactide. Part 1, IMechE, 2004Degradation of poly-L-lactide. Part 1, IMechE, 2004
Degradation of poly-L-lactide. Part 1, IMechE, 2004
 
BiochemPaper
BiochemPaperBiochemPaper
BiochemPaper
 
Depolymerization OF PP Review Article
Depolymerization OF PP Review ArticleDepolymerization OF PP Review Article
Depolymerization OF PP Review Article
 
Paper
PaperPaper
Paper
 
Processing, annealing and sterilisation of poly-l-lactide, Biomaterials, 2003
Processing, annealing and sterilisation of poly-l-lactide, Biomaterials, 2003Processing, annealing and sterilisation of poly-l-lactide, Biomaterials, 2003
Processing, annealing and sterilisation of poly-l-lactide, Biomaterials, 2003
 
Thesis ChenQ
Thesis ChenQThesis ChenQ
Thesis ChenQ
 
Cossiello Synthetic Metals Capa
Cossiello   Synthetic Metals   CapaCossiello   Synthetic Metals   Capa
Cossiello Synthetic Metals Capa
 
OPTUM® Technology an innovative barrier solution for polypropylene-based mate...
OPTUM® Technology an innovative barrier solution for polypropylene-based mate...OPTUM® Technology an innovative barrier solution for polypropylene-based mate...
OPTUM® Technology an innovative barrier solution for polypropylene-based mate...
 
Optum® Technology an innovative barrier solution for polypropylene based mate...
Optum® Technology an innovative barrier solution for polypropylene based mate...Optum® Technology an innovative barrier solution for polypropylene based mate...
Optum® Technology an innovative barrier solution for polypropylene based mate...
 
Masters_Thesis_Presentation_9-3-15
Masters_Thesis_Presentation_9-3-15Masters_Thesis_Presentation_9-3-15
Masters_Thesis_Presentation_9-3-15
 
Electrospn 18 casasola-full
Electrospn 18 casasola-fullElectrospn 18 casasola-full
Electrospn 18 casasola-full
 
Crimson Publishers-Poly(Glycerol-Sebacate) Elastomer: A Mini Review
Crimson Publishers-Poly(Glycerol-Sebacate) Elastomer: A Mini ReviewCrimson Publishers-Poly(Glycerol-Sebacate) Elastomer: A Mini Review
Crimson Publishers-Poly(Glycerol-Sebacate) Elastomer: A Mini Review
 
Shrinkage of Polyester Fibre in Selected Chlorinated Solvents and Effects on ...
Shrinkage of Polyester Fibre in Selected Chlorinated Solvents and Effects on ...Shrinkage of Polyester Fibre in Selected Chlorinated Solvents and Effects on ...
Shrinkage of Polyester Fibre in Selected Chlorinated Solvents and Effects on ...
 
Kronfeld asc2009-li
Kronfeld asc2009-liKronfeld asc2009-li
Kronfeld asc2009-li
 
Degradation of poly-L-lactide. Part 2, IMechE, 2004
Degradation of poly-L-lactide. Part 2, IMechE, 2004Degradation of poly-L-lactide. Part 2, IMechE, 2004
Degradation of poly-L-lactide. Part 2, IMechE, 2004
 
Impact of Gamma Irradiation on Structural and Dielectric Properties of CuI-PV...
Impact of Gamma Irradiation on Structural and Dielectric Properties of CuI-PV...Impact of Gamma Irradiation on Structural and Dielectric Properties of CuI-PV...
Impact of Gamma Irradiation on Structural and Dielectric Properties of CuI-PV...
 
Borkar,Poly,v47p8337
Borkar,Poly,v47p8337Borkar,Poly,v47p8337
Borkar,Poly,v47p8337
 
Incorporation of Se (IV) Complexes based on Amino Acids in Biomatrixes in Hyd...
Incorporation of Se (IV) Complexes based on Amino Acids in Biomatrixes in Hyd...Incorporation of Se (IV) Complexes based on Amino Acids in Biomatrixes in Hyd...
Incorporation of Se (IV) Complexes based on Amino Acids in Biomatrixes in Hyd...
 
Marras nanostruct vs microst
Marras nanostruct vs microstMarras nanostruct vs microst
Marras nanostruct vs microst
 
Review of Tribological characteristics of Modified PEEK Composites
Review of Tribological characteristics of Modified PEEK  CompositesReview of Tribological characteristics of Modified PEEK  Composites
Review of Tribological characteristics of Modified PEEK Composites
 

Recently uploaded

Unveiling Falcon Invoice Discounting: Leading the Way as India's Premier Bill...
Unveiling Falcon Invoice Discounting: Leading the Way as India's Premier Bill...Unveiling Falcon Invoice Discounting: Leading the Way as India's Premier Bill...
Unveiling Falcon Invoice Discounting: Leading the Way as India's Premier Bill...Falcon Invoice Discounting
 
SEO Case Study: How I Increased SEO Traffic & Ranking by 50-60% in 6 Months
SEO Case Study: How I Increased SEO Traffic & Ranking by 50-60%  in 6 MonthsSEO Case Study: How I Increased SEO Traffic & Ranking by 50-60%  in 6 Months
SEO Case Study: How I Increased SEO Traffic & Ranking by 50-60% in 6 MonthsIndeedSEO
 
joint cost.pptx COST ACCOUNTING Sixteenth Edition ...
joint cost.pptx  COST ACCOUNTING  Sixteenth Edition                          ...joint cost.pptx  COST ACCOUNTING  Sixteenth Edition                          ...
joint cost.pptx COST ACCOUNTING Sixteenth Edition ...NadhimTaha
 
PARK STREET 💋 Call Girl 9827461493 Call Girls in Escort service book now
PARK STREET 💋 Call Girl 9827461493 Call Girls in  Escort service book nowPARK STREET 💋 Call Girl 9827461493 Call Girls in  Escort service book now
PARK STREET 💋 Call Girl 9827461493 Call Girls in Escort service book nowkapoorjyoti4444
 
PHX May 2024 Corporate Presentation Final
PHX May 2024 Corporate Presentation FinalPHX May 2024 Corporate Presentation Final
PHX May 2024 Corporate Presentation FinalPanhandleOilandGas
 
Ooty Call Gril 80022//12248 Only For Sex And High Profile Best Gril Sex Avail...
Ooty Call Gril 80022//12248 Only For Sex And High Profile Best Gril Sex Avail...Ooty Call Gril 80022//12248 Only For Sex And High Profile Best Gril Sex Avail...
Ooty Call Gril 80022//12248 Only For Sex And High Profile Best Gril Sex Avail...pujan9679
 
Mckinsey foundation level Handbook for Viewing
Mckinsey foundation level Handbook for ViewingMckinsey foundation level Handbook for Viewing
Mckinsey foundation level Handbook for ViewingNauman Safdar
 
Cannabis Legalization World Map: 2024 Updated
Cannabis Legalization World Map: 2024 UpdatedCannabis Legalization World Map: 2024 Updated
Cannabis Legalization World Map: 2024 UpdatedCannaBusinessPlans
 
Quick Doctor In Kuwait +2773`7758`557 Kuwait Doha Qatar Dubai Abu Dhabi Sharj...
Quick Doctor In Kuwait +2773`7758`557 Kuwait Doha Qatar Dubai Abu Dhabi Sharj...Quick Doctor In Kuwait +2773`7758`557 Kuwait Doha Qatar Dubai Abu Dhabi Sharj...
Quick Doctor In Kuwait +2773`7758`557 Kuwait Doha Qatar Dubai Abu Dhabi Sharj...daisycvs
 
Berhampur 70918*19311 CALL GIRLS IN ESCORT SERVICE WE ARE PROVIDING
Berhampur 70918*19311 CALL GIRLS IN ESCORT SERVICE WE ARE PROVIDINGBerhampur 70918*19311 CALL GIRLS IN ESCORT SERVICE WE ARE PROVIDING
Berhampur 70918*19311 CALL GIRLS IN ESCORT SERVICE WE ARE PROVIDINGpr788182
 
CROSS CULTURAL NEGOTIATION BY PANMISEM NS
CROSS CULTURAL NEGOTIATION BY PANMISEM NSCROSS CULTURAL NEGOTIATION BY PANMISEM NS
CROSS CULTURAL NEGOTIATION BY PANMISEM NSpanmisemningshen123
 
Arti Languages Pre Seed Teaser Deck 2024.pdf
Arti Languages Pre Seed Teaser Deck 2024.pdfArti Languages Pre Seed Teaser Deck 2024.pdf
Arti Languages Pre Seed Teaser Deck 2024.pdfwill854175
 
Falcon Invoice Discounting: Unlock Your Business Potential
Falcon Invoice Discounting: Unlock Your Business PotentialFalcon Invoice Discounting: Unlock Your Business Potential
Falcon Invoice Discounting: Unlock Your Business PotentialFalcon investment
 
Berhampur 70918*19311 CALL GIRLS IN ESCORT SERVICE WE ARE PROVIDING
Berhampur 70918*19311 CALL GIRLS IN ESCORT SERVICE WE ARE PROVIDINGBerhampur 70918*19311 CALL GIRLS IN ESCORT SERVICE WE ARE PROVIDING
Berhampur 70918*19311 CALL GIRLS IN ESCORT SERVICE WE ARE PROVIDINGpr788182
 
Call 7737669865 Vadodara Call Girls Service at your Door Step Available All Time
Call 7737669865 Vadodara Call Girls Service at your Door Step Available All TimeCall 7737669865 Vadodara Call Girls Service at your Door Step Available All Time
Call 7737669865 Vadodara Call Girls Service at your Door Step Available All Timegargpaaro
 
Katrina Personal Brand Project and portfolio 1
Katrina Personal Brand Project and portfolio 1Katrina Personal Brand Project and portfolio 1
Katrina Personal Brand Project and portfolio 1kcpayne
 
JAJPUR CALL GIRL ❤ 82729*64427❤ CALL GIRLS IN JAJPUR ESCORTS
JAJPUR CALL GIRL ❤ 82729*64427❤ CALL GIRLS IN JAJPUR  ESCORTSJAJPUR CALL GIRL ❤ 82729*64427❤ CALL GIRLS IN JAJPUR  ESCORTS
JAJPUR CALL GIRL ❤ 82729*64427❤ CALL GIRLS IN JAJPUR ESCORTSkajalroy875762
 
Berhampur Call Girl Just Call 8084732287 Top Class Call Girl Service Available
Berhampur Call Girl Just Call 8084732287 Top Class Call Girl Service AvailableBerhampur Call Girl Just Call 8084732287 Top Class Call Girl Service Available
Berhampur Call Girl Just Call 8084732287 Top Class Call Girl Service Availablepr788182
 
Berhampur CALL GIRL❤7091819311❤CALL GIRLS IN ESCORT SERVICE WE ARE PROVIDING
Berhampur CALL GIRL❤7091819311❤CALL GIRLS IN ESCORT SERVICE WE ARE PROVIDINGBerhampur CALL GIRL❤7091819311❤CALL GIRLS IN ESCORT SERVICE WE ARE PROVIDING
Berhampur CALL GIRL❤7091819311❤CALL GIRLS IN ESCORT SERVICE WE ARE PROVIDINGpr788182
 

Recently uploaded (20)

Unveiling Falcon Invoice Discounting: Leading the Way as India's Premier Bill...
Unveiling Falcon Invoice Discounting: Leading the Way as India's Premier Bill...Unveiling Falcon Invoice Discounting: Leading the Way as India's Premier Bill...
Unveiling Falcon Invoice Discounting: Leading the Way as India's Premier Bill...
 
SEO Case Study: How I Increased SEO Traffic & Ranking by 50-60% in 6 Months
SEO Case Study: How I Increased SEO Traffic & Ranking by 50-60%  in 6 MonthsSEO Case Study: How I Increased SEO Traffic & Ranking by 50-60%  in 6 Months
SEO Case Study: How I Increased SEO Traffic & Ranking by 50-60% in 6 Months
 
joint cost.pptx COST ACCOUNTING Sixteenth Edition ...
joint cost.pptx  COST ACCOUNTING  Sixteenth Edition                          ...joint cost.pptx  COST ACCOUNTING  Sixteenth Edition                          ...
joint cost.pptx COST ACCOUNTING Sixteenth Edition ...
 
HomeRoots Pitch Deck | Investor Insights | April 2024
HomeRoots Pitch Deck | Investor Insights | April 2024HomeRoots Pitch Deck | Investor Insights | April 2024
HomeRoots Pitch Deck | Investor Insights | April 2024
 
PARK STREET 💋 Call Girl 9827461493 Call Girls in Escort service book now
PARK STREET 💋 Call Girl 9827461493 Call Girls in  Escort service book nowPARK STREET 💋 Call Girl 9827461493 Call Girls in  Escort service book now
PARK STREET 💋 Call Girl 9827461493 Call Girls in Escort service book now
 
PHX May 2024 Corporate Presentation Final
PHX May 2024 Corporate Presentation FinalPHX May 2024 Corporate Presentation Final
PHX May 2024 Corporate Presentation Final
 
Ooty Call Gril 80022//12248 Only For Sex And High Profile Best Gril Sex Avail...
Ooty Call Gril 80022//12248 Only For Sex And High Profile Best Gril Sex Avail...Ooty Call Gril 80022//12248 Only For Sex And High Profile Best Gril Sex Avail...
Ooty Call Gril 80022//12248 Only For Sex And High Profile Best Gril Sex Avail...
 
Mckinsey foundation level Handbook for Viewing
Mckinsey foundation level Handbook for ViewingMckinsey foundation level Handbook for Viewing
Mckinsey foundation level Handbook for Viewing
 
Cannabis Legalization World Map: 2024 Updated
Cannabis Legalization World Map: 2024 UpdatedCannabis Legalization World Map: 2024 Updated
Cannabis Legalization World Map: 2024 Updated
 
Quick Doctor In Kuwait +2773`7758`557 Kuwait Doha Qatar Dubai Abu Dhabi Sharj...
Quick Doctor In Kuwait +2773`7758`557 Kuwait Doha Qatar Dubai Abu Dhabi Sharj...Quick Doctor In Kuwait +2773`7758`557 Kuwait Doha Qatar Dubai Abu Dhabi Sharj...
Quick Doctor In Kuwait +2773`7758`557 Kuwait Doha Qatar Dubai Abu Dhabi Sharj...
 
Berhampur 70918*19311 CALL GIRLS IN ESCORT SERVICE WE ARE PROVIDING
Berhampur 70918*19311 CALL GIRLS IN ESCORT SERVICE WE ARE PROVIDINGBerhampur 70918*19311 CALL GIRLS IN ESCORT SERVICE WE ARE PROVIDING
Berhampur 70918*19311 CALL GIRLS IN ESCORT SERVICE WE ARE PROVIDING
 
CROSS CULTURAL NEGOTIATION BY PANMISEM NS
CROSS CULTURAL NEGOTIATION BY PANMISEM NSCROSS CULTURAL NEGOTIATION BY PANMISEM NS
CROSS CULTURAL NEGOTIATION BY PANMISEM NS
 
Arti Languages Pre Seed Teaser Deck 2024.pdf
Arti Languages Pre Seed Teaser Deck 2024.pdfArti Languages Pre Seed Teaser Deck 2024.pdf
Arti Languages Pre Seed Teaser Deck 2024.pdf
 
Falcon Invoice Discounting: Unlock Your Business Potential
Falcon Invoice Discounting: Unlock Your Business PotentialFalcon Invoice Discounting: Unlock Your Business Potential
Falcon Invoice Discounting: Unlock Your Business Potential
 
Berhampur 70918*19311 CALL GIRLS IN ESCORT SERVICE WE ARE PROVIDING
Berhampur 70918*19311 CALL GIRLS IN ESCORT SERVICE WE ARE PROVIDINGBerhampur 70918*19311 CALL GIRLS IN ESCORT SERVICE WE ARE PROVIDING
Berhampur 70918*19311 CALL GIRLS IN ESCORT SERVICE WE ARE PROVIDING
 
Call 7737669865 Vadodara Call Girls Service at your Door Step Available All Time
Call 7737669865 Vadodara Call Girls Service at your Door Step Available All TimeCall 7737669865 Vadodara Call Girls Service at your Door Step Available All Time
Call 7737669865 Vadodara Call Girls Service at your Door Step Available All Time
 
Katrina Personal Brand Project and portfolio 1
Katrina Personal Brand Project and portfolio 1Katrina Personal Brand Project and portfolio 1
Katrina Personal Brand Project and portfolio 1
 
JAJPUR CALL GIRL ❤ 82729*64427❤ CALL GIRLS IN JAJPUR ESCORTS
JAJPUR CALL GIRL ❤ 82729*64427❤ CALL GIRLS IN JAJPUR  ESCORTSJAJPUR CALL GIRL ❤ 82729*64427❤ CALL GIRLS IN JAJPUR  ESCORTS
JAJPUR CALL GIRL ❤ 82729*64427❤ CALL GIRLS IN JAJPUR ESCORTS
 
Berhampur Call Girl Just Call 8084732287 Top Class Call Girl Service Available
Berhampur Call Girl Just Call 8084732287 Top Class Call Girl Service AvailableBerhampur Call Girl Just Call 8084732287 Top Class Call Girl Service Available
Berhampur Call Girl Just Call 8084732287 Top Class Call Girl Service Available
 
Berhampur CALL GIRL❤7091819311❤CALL GIRLS IN ESCORT SERVICE WE ARE PROVIDING
Berhampur CALL GIRL❤7091819311❤CALL GIRLS IN ESCORT SERVICE WE ARE PROVIDINGBerhampur CALL GIRL❤7091819311❤CALL GIRLS IN ESCORT SERVICE WE ARE PROVIDING
Berhampur CALL GIRL❤7091819311❤CALL GIRLS IN ESCORT SERVICE WE ARE PROVIDING
 

oguz2021.pdf

  • 1. Geometric Confinement Controls Stiffness, Strength, Extensibility, and Toughness in Poly(urethane−urea) Copolymers Oguzhan Oguz,* Nicolas Candau, Gregory Stoclet, Eren Simsek, Cagla Kosak Soz, Emel Yilgor, Iskender Yilgor,* and Yusuf Z. Menceloglu* Cite This: Macromolecules 2021, 54, 4704−4725 Read Online ACCESS Metrics & More Article Recommendations * sı Supporting Information ABSTRACT: Achieving a unique combination of stiffness, strength, extensibility, and toughness in sol-cast poly(urethane−urea) (PU) copolymer films is a challenge since these properties arein general mutually exclusive. Here we demonstrate that geometric confinement of the basic building blocks controls stiffness, strength, extensibility, and toughness in PU films. Our results suggest that the severity of geometric confinement can be tuned by adjusting (i) soft segment molecular weight (SSMW) and (ii) drying temperature (DT) thanks to their effects on the structure formation via microphase separation and/or (confined and/or bulk) crystallization. It is therefore possible to produce (i) soft (no notable confinement) and (ii) stiff, strong, extensible, and tough (severe confinement) materials without changing any other parameter except SSMW and DT. The former has a typical physically cross-linked network and shows a well- defined elastomeric behavior with an elastic modulus (E) of 5−20 MPa, a tensile strength (σmax) of 30−35 MPa, an extensibility (ε) of 1000−1300%, and a toughness (W) of 90−180 MJ m−3 . The latter, on the other hand, possesses an elegant hierarchical structure containing tightly packed secondary structures (72-helix, 41-helix, and antiparallel β-sheets) and displays an elastoplastic behavior with an E of 400−700 MPa, a σmax of 45−55 MPa, an ε of 650−850%, and a W of 200−250 MJ m−3 . Hence, our findings may be of interest in designing advanced materials containing synthetic replica of the secondary structures found in protein-based materials. The structure formation in the materials with this structural hierarchy is driven by the confined crystallization of helical poly(ethylene oxide) (PEO) chains in subnanometer urea channels, whichto the best of our knowledgeis a phenomenon well- known in host−guest systems but has not yet demonstrated in PU copolymers, and complemented by the “bulk” crystallization of PEO and/or the microphase separation. 1. INTRODUCTION Urethane−urea chemistry offers diverse possibilities for design and synthesis of thermoplastic polyurethanes1−4 (TPUs), that is, segmented polyurethane, polyurea, and poly(urethane− urea) copolymers, with functional surface and bulk properties. TPUs are, in general, linear macromolecules typically formed by alternating soft and hard segments. Soft segments (SS) are oligomeric diols or diamines with a glass transition temper- ature (Tg) well below room temperature, catering elastomeric characteristics of TPUs at service temperatures. Hard segments (HS), on the other hand, are obtained by the reaction of diisocyanates with diol or diamine chain extenders and form hydrogen-bonded domains having a Tg and/or melting temperature (Tm) well beyond the service window, which act as physical cross-links providing TPUs with thermoplastic properties.4−7 There is plenty of room for designing multifunctional TPUs with tunable morphologies as the number of commercially available basic building blocks with different features is practically unlimited. However, this also indicates a vast number of parameters4,8 required to be controlled during synthesis and processing, as they significantly affect both microphase separation and crystallization, which are the two keyinterrelatedphenomena determining the structure− property behavior of resulting materials.. These parameters can be roughly divided into two categories as (i) synthesis and (ii) processing parameters. Synthesis parameters have been comprehensively examined in decades of research,9−13 whereas processing parameters have not yet received as much attention. This is particularly true for solution casting since the relevant studies available in the literature mainly rely on melt-processing.14−22 Although parameters like (i) solvent type, (ii) drying atmosphere, (iii) drying temperature, (iv) residence time at the drying temperature, and (v) post thermal/cryo treatments (annealing, Received: March 17, 2021 Revised: April 23, 2021 Published: May 11, 2021 Article pubs.acs.org/Macromolecules © 2021 American Chemical Society 4704 https://doi.org/10.1021/acs.macromol.1c00596 Macromolecules 2021, 54, 4704−4725 Downloaded via UNIV OF EDINBURGH on August 11, 2021 at 19:50:24 (UTC). See https://pubs.acs.org/sharingguidelines for options on how to legitimately share published articles.
  • 2. quenching, etc.) are extremely important to obtain high-quality sol-cast films/sheets, they have been somewhat overlooked in the literature. For instance, most of the sol-cast TPU films/ sheets found in the literature have reported to be dried at 60 °C, even though the solvent systems used, and hence their evaporation rates at this temperature, are completely different than each other.23−25 To address this issue, here we focus on the effect of drying temperature on the structure−property behavior of a series of poly(ethylene oxide)26,27 (PEO)-based poly(urethane−urea) copolymers with a hard segment content of 30 wt %. PEO oligomers with 2000, 4600, and 8000 g mol−1 molar masses were used as soft segments. While all the other parameters were kept constant, two different drying temperatures (60 and 100 °C) were applied to prepare the film specimens that were then comprehensively characterized by a series of techniques. This has enabled us to demonstrate that geometric confinement of the basic building blocks along the multiple length scales controls stiffness, strength, extensibility, and toughness in sol-cast PU films. Our findings suggest that the severity of geometric confinement in sol-cast PU films can be tuned by controlling soft segment molecular weight and drying temperature since these two parameters are of great importance for the structure formation through microphase separation and/or (confined and/or bulk) crystallization. This, in return, can be utilized to create entirely different morphologies and hence achieve significant variations in mechanical properties without changing any other parameter. To demonstrate, sol-cast PU films with/without severe geometric confinement are prepared and comprehensively investigated. The films with severe confinement possess a structural hierarchy spanning length scales from angstroms to micrometers, leading to unique combinations of stiffness, strength, extensibility, and toughness. Our findings may also be of interest in mimicking certain protein structures containing tightly packed natural design motifs like helices and antiparallel β-sheets as the structural hierarchy demonstrated here consists of these secondary structures. The structure formation in these films is governed by the confined crystallization of helical poly(ethylene oxide) (PEO) chains in subnanometer urea channels and complemented by the “bulk” crystallization of PEO and the microphase separation. The confined crystal- lization of PEO in subnanometer urea channels is indeed known to create host−guest (inclusion) complexes. However, to the best of our knowledge, it has not yet been demonstrated in PU copolymers. We therefore also show how the α form of these complex crystals is formed and what kind of impacts it has on the structure−property relations of the PU films. 2. EXPERIMENTAL SECTION 2.1. Materials. PEO oligomers with number-average molar masses, Mn, of 2000, 4600, and 8000 g mol−1 were obtained from Merck. Bis(4-isocyanatocyclohexyl)methane (HMDI) with a purity of >99.5% was kindly provided by Bayer. 2-Methyl-1,5-diaminopentane (MDAP) chain extender was kindly supplied by DuPont. Dibutyltin dilaurate (DBTDL) catalyst was purchased from Witco. Reagent grade tetrahydrofuran (THF) and dimethylformamide (DMF) were also obtained from Merck. All chemicals were used as received. 2.2. Synthesis. The hard segment model compounds (HMDI− MDAP) with molecular weights similar to those of the HSs in the copolymers were prepared as control samples and characterized as given in Figures S1 and S2. The copolymers were synthesized by the two-step polymerization technique, also known as the prepolymer method. The detailed procedure followed was previously reported by our group.28−32 All reactions were performed in 500 mL three-necked round-bottom Pyrex reaction flasks equipped with a mechanical overhead stirrer, a thermometer and a funnel, with temperature control provided by a heating mantle. The isocyanate-terminated PEO prepolymer solution in THF with 50 wt % solids content was prepared at 60 °C. We added 150 ppm of DBTDL catalyst (diluted to 1 wt % in THF solution) into the mixture of PEO and HMDI that was stirred for 1 h at the same temperature. Prepolymer formation was monitored by Fourier transform infrared (FTIR) spectroscopy. The reaction was complete after about 1 h. The heat was then turned off, and the prepolymer was dissolved in DMF to obtain a solution with 25 wt % solids content. Chain extension was performed at room temperature by dropwise addition of MDAP dissolved in DMF (≈10 wt % solids content) to the prepolymer solution. Completion of the chain extension was also monitored by FTIR spectroscopy. The dropwise addition of MDAP was ceased when the strong isocyanate peak centered on 2260 cm−1 completely disappeared. The viscosity increase during the chain extension reaction was controlled by adding DMF into the reaction flask. The chemical structure of the PU copolymers is shown in Figure S3. 2.3. Preparation of PU Films for Testing. PU films were cast from polymer solution (THF:DMF/1:6.25) into Teflon molds. Two different drying protocols were followed. In the first protocol, the molds were kept at room temperature for 24 h in a fume hood and then placed in an oven at 60 °C for 24 h under vacuum to ensure complete evaporation of the solvent. Samples were then cooled to room temperature and stored in sealed polyethylene bags minimum 24 h before testing. In the second protocol, the same steps were followed, but this time the oven was set to 100 °C instead of 60 °C. A list of the PU copolymers investigated, their compositions, and drying conditions is provided in Table 1. In the sample nomenclature (PU-X- T), X indicates the molecular weight of the PEO used in kilodaltons and (T) is the drying temperature in degrees Celsius. 2.4. Characterization Techniques. Gel permeation chromatog- raphy (GPC) analyses were performed by using a Viscotek GPCmax VE-2001 instrument equipped with D5000-D, 3000-D, and 1000-D guard columns and RI, LS, and DP detectors. DMF was used as the solvent, and analysis was performed at 55 °C with a flow rate of 1 mL/min. Polymer solutions were prepared in DMF at a concentration of 2 mg/mL. The samples were filtered by VMR PTFE syringe filters with average pore size of 0.45 μm before measurements. Average molecular weights were determined by using calibration curves obtained from polystyrene standards. Average molecular weights and molecular weight distributions of the copolymers along with the effect of thermal treatment on the samples are listed in Table 2. Thermogravimetric analyses were performed by using a STA 449C simultaneous thermal analyzer (Netzsch, Germany) under a nitrogen atmosphere with a heating rate of 3 °C/min from ambient temperature to 700 °C. Modulated differential scanning calorimetry (MDSC) analyses were performed by a TA Q2000 instrument calibrated with indium standard and equipped with Tzero functionality that significantly improves the baseline via compensating resistance and capacitance Table 1. Sample Notation and Compositional Details of the PUs along with Drying Temperatures Used in This Study coding PEO ⟨Mn⟩ (g/mol) PEO chain lengtha (nm) HS ⟨Mn⟩ (g/mol) HS content (wt %) drying temp (°C) PU-2-60 2000 12.0 860 30 60 PU-5-60 4600 27.3 1970 30 60 PU-8-60 8000 51.2 3400 30 60 PU-2-100 2000 12.0 860 30 100 PU-5-100 4600 27.3 1970 30 100 PU-8-100 8000 51.2 3400 30 100 a PEO segment lengths were taken from the literature.33 Macromolecules pubs.acs.org/Macromolecules Article https://doi.org/10.1021/acs.macromol.1c00596 Macromolecules 2021, 54, 4704−4725 4705
  • 3. imbalances. In this technique, a harmonic modulation is applied on a typical DSC linear ramp. Then the typical DSC thermograms are deconvoluted by a signal analysis process into two different components mainly referred to as reversing and nonreversing ones. The reversing component involves the reversible events in the time scale of modulation such as the glass transition step and melting of outer layers of crystallites. Apart from this, melting of crystal cores and enthalpy relaxation accompanying the glass transition are mainly characterized by the nonreversing component.33−35 All measurements were performed in the range of −160 and 250 °C at a rate of 3 °C/min and a modulation of ±1 °C over a period of 90 s. We applied a typical procedure for the sample preparation. For each composition, a small piece of thin film sample, weighting around 10 mg, was encapsulated in a hermetic DSC pan prior to measurement. At least five specimens were measured for each sample. Overall thermal properties of the samples were followed by the total specific heat flow signals as a function of temperature. As the copolymers with PEO-4600 and PEO-8000 soft segments display very weak glassy−rubbery transitions, it is not easy to detect the soft segment glass transition temperature. For this reason, the reversing signal is used to analyze the glassy−rubbery transition region for all the samples under investigation. The glass transition temperature (Tg) and the heat capacity change at Tg (ΔCp at Tg) were determined by the inflection point and the tangent methods, respectively. The degree of soft segment crystallinity (χc) is calculated by using the following equation, assuming that the hard segment does not contribute to the crystallinity of the soft segment: H H X H (1 ) 100% c m c HS 100%,PEO χ = Δ − Δ − × Δ × where ΔHm and ΔHc are the enthalpy changes obtained from the areas of the respective endothermic and exothermic peaks and XHS is the weight fraction of the hard segment. The melting enthalpy for the 100% crystalline polymer is considered to be equal to that of pure PEO (ΔH100%PEO), which is denoted as 196.6 J/g.33,35 X-ray diffraction (XRD) measurements of the film samples were performed on a Bruker D8 Advance X-ray diffractometer using Ni- filtered Cu Kα radiation (λ = 0.1542 nm). All the measurements were performed from 5° up to 90° with a step size of 0.01°. The results were plotted as a function of the scattering angle 2θ. During the measurements, specific instrumental and sample effects were also considered. The d-spacing is calculated with respect to Bragg’s law, nλ = 2d sin θ, where λ is the wavelength of the radiation, d is the interplanar spacing, θ is the diffraction angle, and n is the order of the reflection. At least five specimens of each sample were measured and then analyzed for determining the total degree of crystallinity values presented in the respective section. Fourier transform infrared spectroscopy (FTIR) measurements were performed on a Nicolet 7600 spectrometer. For the progress and completion of the synthesis, solutions were cast on KBr discs, and thin films were obtained after evaporating the solvent with an air gun. A total of 32 scans were taken for each spectrum with a resolution of 2 cm−1 . A Thermo Scientific Nicolet iS10 spectrometer equipped with a Thermo Scientific Smart iTR Accessory with a Diamond ATR crystal and with an incident angle of 42° was used to record ATR-IR (attenuated total reflectance infrared spectroscopy) spectra of the film samples prepared under different thermal protocols. Thirty-two scans were taken for each spectrum with a resolution of 2 cm−1 in the range 4000−400 cm−1 . All spectral corrections, such as background subtraction, were carefully performed by Omnic Software. Deconvo- lution of the amide-I and amide-II bands was performed by using Origin data processing software. A linear baseline was used. The peak maxima were denoted as the frequencies detected by second- derivative analysis. A Lorentzian peak function was applied throughout the nonlinear fitting process. Quantification of the secondary structures was performed by analyzing the amide-I region. The average percent fractions of the secondary structures were calculated by integrating the area under each deconvoluted peak and then normalizing to the total area of the amide-I region. At least five specimens of each material were measured by the ATR-IR technique and then analyzed by the deconvolution procedure summarized above to determine the standard deviations for the respective quantities. A Renishaw Invia Raman spectrometer (equipped with 785, 633, and 532 nm excitation laser sources) was used to obtain the Raman spectra of the samples at the excitation wavelength of 633 nm. To avoid the structural deterioration, 50% laser power was used to excite the sol-cast films with an average thickness of 0.2 mm. Each measurement accumulates the signal for 1 min with an exposure time of 10 s under ambient temperature and humidity conditions. A Nikon Eclipse ME 600 optical microscope (OM) equipped with a hot stage was used to investigate the micrometer scale morphologies of thin polymer films placed between two clean glass slides. All measurements were performed under the polarized light in bright field. Atomic force microscopy (AFM) images of the free surface of completely dried solution cast films were captured on a Bruker ScanAsyst enabled Multimode-8 atomic force microscope equipped with a Nanoscope 8.1 controller. All samples were analyzed in standard tapping/noncontact mode by using a Bruker Scanasyst air probe with a nominal spring constant of 0.4 N/m, a resonance frequency of 70 kHz, and a radius of curvature of 2 nm. All images were recorded at 1 Hz frequency with a 512 × 512 scan and a set point ratio of ∼0.6 at ambient temperature and humidity conditions. Stress−strain analyses were performed on dog-bone-type speci- mens punched out of thin films by using a standard die (ASTM D 1708). Measurements were made on a Zwick Z100 model tester under ambient temperature and humidity conditions with a crosshead speed of 25.0 mm/min (L0 = 24.0 mm). At least five specimens were tested for each sample. 3. RESULTS AND DISCUSSION 3.1. Thermal Stability. TGA and GPC measurements were performed to check the effect of drying protocols on the specimens. For the thermal stability measurements, the samples were subjected to the same experimental conditions applied in DSC analyses, i.e., at a heating rate of 3 °C/min under a nitrogen atmosphere, during TGA analyses. Figure S4 displays the weight loss as a function of temperature for the samples. The decomposition starts around 330 °C, which is well above the temperatures applied in our drying protocols for PU-2, PU-5, and PU-8. However, side reactions like chain scission and possible recombination (e.g., by cleavage of urethane and/or urea bonds) are not followed by TGA measurements. In general, such reactions give rise to change in the molecular weight and/or molecular weight distribution of the materials.36 As listed in Table 2, GPC results suggest that no notable change occurred regarding both molecular weights and molecular weight distributions of the samples after drying at 100 °C. These results suggest that there is no substantial degradation taking place in our copolymers within this temperature range. 3.2. Calorimetry. Modulated DSC analyses were per- formed to investigate the thermal properties of the samples, Table 2. Average Molecular Weight and Molecular Weight Distributions of the PEO-Based Poly(urethane−urea)s along with the Effect of Thermal Treatment on the Samples notation ⟨Mw⟩ (g/mol) ⟨Mn⟩ (g/mol) Mw/Mn PU-2 100000 68000 1.48 PU-2 24 h at 100 °C 106000 70400 1.51 PU-5 232000 164000 1.42 PU-5 24 h at 100 °C 243300 168700 1.44 PU-8 309000 209500 1.47 PU-8 24 h at 100 °C 317000 212800 1.49 Macromolecules pubs.acs.org/Macromolecules Article https://doi.org/10.1021/acs.macromol.1c00596 Macromolecules 2021, 54, 4704−4725 4706
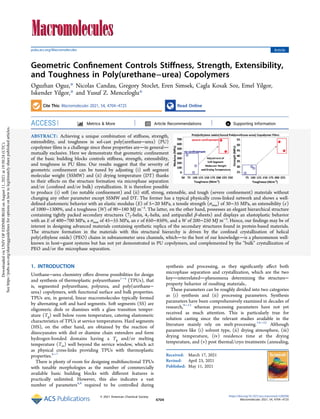
  • 4. which were evaluated by using the data obtained from the first heating scans of the specimens since the mechanical properties can only be influenced by the thermal histories of the materials rely on the applied processing conditions. The total heat flow signals of the PU copolymers are provided in Figure 1. In Figure 1a, PU-2-60 shows a well-defined glassy−rubbery transition between −60 and −50 °C followed by a small exotherm between −50 and −25 °C and an endotherm at 19.9 °C with a PEO (ΔHm − ΔHc) of 44.9 ± 4.3 J/gPU. PU-5-60 and PU-8-60 display very weak glassy−rubbery transitions at temperatures between −60 and −40 °C followed by sharp endotherms at 42.1 and 51.2 °C with enthalpy changes of 59.9 ± 5.2 and 77.6 ± 3.7 J/gPU, respectively. No other high- temperature exothermic and/or endothermic transitions are observed for the samples prepared at 60 °C. In Figure 1b, PU-2-100 displays a distinct glass transition followed by an exotherm between −50 and −25 °C and an endotherm at 17.1 °C with a PEO (ΔHm − ΔHc) of 30.2 ± 3.1 J/gPU. PU-2-100 also shows another exotherm with a peak temperature of 119 °C and multiple endotherms with peak temperatures of 176, 184, and 192 °C in the high-temperature region. PU-5-100 and PU-8-100 show weak glass transition steps at temperatures between −70 and −60 °C, followed by bimodal endotherms in the intermediate regions of the thermograms. The bimodal endotherm of PU-5-100 comprises a relatively small endotherm apparent as a shoulder with a peak temperature of 28.6 °C and a main endotherm with a peak temperature of 38.3 °C and a total enthalpy change (shoulder and main peak) of 47.7 ± 3.4 J/gPU, whereas a shoulder with a peak temperature of 35.4 °C and a main endotherm with a peak temperature of 45.1 °C and a total enthalpy change of 57.0 ± 3.0 J/gPU are observed in that of PU-8-100. In addition, PU-5-100 displays an exotherm with a peak temperature of 139 °C followed by an endotherm with a peak temperature of 206 °C in the high-temperature region of the thermogram. Similarly, PU-8-100 shows an exotherm with a peak temper- ature of 159 °C and an endotherm with a peak temperature of 220 °C. These results are elaborately discussed in (i) Soft Segment Glass Transition, (ii) Melting Behavior of PEO Soft Segment Crystals and Soft Segment Crystallinity, and (iii) Microphase Separation/Mixing subsections in the following. The α ΔH values given in Figure 1b and a respective discussion are provided in the Microphase Separation/Mixing subsection. In addition, the enthalpy changes given in Figure 1 (PEO ΔHm, PEO (ΔHm − ΔHc)) are not the ones normalized by the weight fraction of PEO. The normalized values used to calculate soft segment crystallinity values are denoted in the melting of PEO soft segment crystals and soft segment crystallinity subsection. It should also be noted that the soft segment glass transition temperatures were determined by using the reversing heat flow signals in Figures 2 and 3 as discussed in the Soft Segment Glass Transition subsection. Soft Segment Glass Transition. The transition located at between −70 and −40 °C is assigned to the soft segment (PEO) glass transition (PEO Tg), which is mainly followed by the reversing heat flow signals by using the inflection point method. To provide a clear overview on the effects of soft segment molecular weight and drying protocol, the reversing heat flow signals for the corresponding temperature range are replotted in Figure 2 for PU-2-based samples. The Figure 1. Total heat flow signals as a function of temperature obtained from MDSC analyses of the samples dried at (a) 60 °C and (b) 100 °C. Figure 2. Reversing heat flow thermograms of the copolymers based on PEO-2000 soft segment (PU-2-60 and PU-2-100) at temperatures between −80 and −30 °C. The uncertainties in PEO Tg and R ΔCp at PEO Tg values in the plot are ±1 °C and ±0.02 J/(g °C), respectively. Macromolecules pubs.acs.org/Macromolecules Article https://doi.org/10.1021/acs.macromol.1c00596 Macromolecules 2021, 54, 4704−4725 4707
  • 5. corresponding plots for PU-5 and PU-8 samples are provided in Figure S5. PEO Tg values are determined to be −57.3 and −61.9 °C for PU-2-60 and PU-2-100, respectively (Figure 2). The corresponding R ΔCp at PEO Tg values are calculated as 0.383 J/(g °C) (PU-2-60) and 0.436 J/(g °C) (PU-2-100). PEO Tg values of PU-5-60 and PU-5-100 copolymers are determined to be −53.8 and −63.6 °C, respectively (Figure S5a). The corresponding R ΔCp at PEO Tg values are calculated as 0.072 J/ (g °C) (PU-5-60) and 0.123 J/(g °C) (PU-5-100). PEO Tg values of PU-8-60 and PU-8-100 are recorded as −49.3 and −68.7 °C, respectively (Figure S5b). The respective R ΔCp at PEO Tg values are denoted as 0.043 J/(g °C) (PU-8-60) and 0.162 J/(g °C) (PU-8-100). The PEO Tg values are plotted in Figure 3 as a function of soft segment molecular weight for both series of the samples. The PEO Tg increases with increasing SSMW for the PU-X-60 set of samples. The increasing trend in PEO Tg values with increasing SSMW is basically arisen from two different reasons. One of them is the increasing amount of dissolved hard segments in the soft matrix, and the other one is the increasing amount of PEO soft segment crystals formed by bulk crystallization of the soft segments. In contrast, the PEO Tg decreases via increasing SSMW for PU-X-100 set of the samples. For all the PU copolymers investigated (PU-2, PU-5, and PU-8), the decrease in PEO Tg is induced by drying at 100 °C. This leads to an increase in the miscibility between the hard and soft segments; that is, more hard and soft segments participate in a “phase mixing” process. At this stage, PEO and urea molecules act cooperatively to minimize their free energies. This initiates confined crystallization of the PEO chains within the subnanometer urea channels giving rise to the formation of PEO−urea α-complex crystals. Structural details for this complex crystal are provided in the following sections via XRD, FT-IR, Raman, and microscopic analyses. Formation of the α-complex crystals simultaneously activates separation of the molecules participating in this phase from the bulk. As the SSMW increases, the hard segment molecular weight increases, too, and thus, the number of both PEO and urea molecules participating in this process also increases. This corresponds to the same amount of decrease in the number of dissolved hard segments creating physical constraints on the mobility of the PEO chains in the bulk. This means the removal of same amount of constraints on the mobility, which results in an enhanced mobility as characterized by the decrease in PEO Tg. For this reason, increasing SSMW results in a decreasing trend in PEO Tg for the PU-X-100 set of samples. Figure 3 also shows the change in PEO Tg values (ΔTg) originated from the change in the drying temperature. ΔTg defined in this study is different than the one usually described in TPUs to investigate the degree of microphase separation. In conventional TPUs, ΔTg is defined as the absolute value of the difference between Tg of the soft segment in TPUs (SS Tg) and of the pure oligomers/macrodiols (oligomer Tg) used as the soft segment during the synthesis that can be quantified as ΔTg = SS Tg − oligomer Tg. In this respect, it is assumed that higher value of ΔTg indicates higher miscibility, and thus, an increasing trend in ΔTg implies an increasing miscibility due to favorable interactions between the hard and soft segments.37 In return, it is assumed that a lower value of ΔTg suggests a higher degree of phase separation. However, Saiani et al. have reported that the determination of the phase separation degree from the soft segment phase glass transition does not seem to be adequate for high hard block content TPUs displaying high-temperature endothermic peaks like microphase mixing temperature (TMMT).36 They have also denoted that even for such samples, some degree of microphase separation is present even if SS Tg is not observed.36 On this basis, it should be emphasized that here we define ΔTg as the absolute value of PU‑X ΔTg = PU‑X‑60 Tg − PU‑X‑100 Tg, where X indicates the molecular weight of the PEO used in kilodaltons, to only demonstrate the increasing miscibility in the samples prepared at 100 °C compared to the ones prepared at 60 °C. As shown in Figure 3, ΔTg systematically increases with increasing soft segment molecular weight. However, this does not necessarily mean that an increasing trend in SSMW implies a decreasing trend in the degree of microphase separation due to the fact that formation of the α-complex crystals suggests that these two processes, i.e., a phase mixing and a phase separation, can simultaneously work in a cooperative manner since the urea molecules are highly organized by bidentate hydrogen bonds between each other on the walls of the channels while confined PEO chains are tightly hydrogen bonded to the excess urea molecules within the channels during the structure formation. The process on the walls of the channels represents the phase separation, whereas the one within the channels illustrates the phase mixing in terms of the type and extent of intermolecular interactions, i.e., hydrogen bonds, which is generally used to describe these two processes in the literature. Melting Behavior of PEO Soft Segment Crystals and Soft Segment Crystallinity. As shown in Figure 1, the endothermic peaks at 19.9, 42.1, and 51.2 °C are attributed to the melting points (PEO Tm) of PEO soft segment crystals in PU-2-60, PU- 5-60, and PU-8-60, respectively. After the normalization of the enthalpy changes provided in Figure 1a with the weight fraction of PEO, (ΔHm − ΔHc) of 64.1 ± 6.1, ΔHm of 85.5 ± 7.4, and ΔHm of 110.9 ± 5.3 J/gPEO are obtained for PU-2-60, PU-5-60, and PU-8-60, respectively. By use of the normalized enthalpy changes, the degree of soft segment crystallinity Figure 3. Change in the soft segment (PEO) glass transition as a function of SSMW for both series of the samples dried at 60 and 100 °C. PEO Tg increases with increasing SSMW for the samples dried at 60 °C. In contrast, this trend becomes reverse; i.e., PEO Tg decreases with increasing SSMW, for the ones dried at 100 °C. ΔTg is calculated as the absolute value of PU‑X ΔTg = PU‑X‑60 Tg − PU‑X‑100 Tg, where X indicates the molecular weight of the PEO used in kilodaltons for the copolymers based on PEO-2000, PEO-4600, and PEO-8000 soft segments. Macromolecules pubs.acs.org/Macromolecules Article https://doi.org/10.1021/acs.macromol.1c00596 Macromolecules 2021, 54, 4704−4725 4708
  • 6. (PEO χc) values of the samples are calculated as PEO χc‑PU‑2‑60 (%) = 32.6 ± 3.1, PEO χc‑PU‑5‑60 (%) = 43.5 ± 3.8, and PEO χc‑PU‑8‑60 (%) = 56.4 ± 2.7 for PU-2-60, PU-5-60, and PU-8-60, respectively. PEO Tm and PEO χc values increase with increasing molecular weight. For the samples prepared at 100 °C, PEO Tm of PEO values are recorded as 17.6, 38.3, and 45.1 °C for PU-2-100, PU-5- 100, and PU-8-100, respectively. The corresponding PEO χc values of this set of samples are calculated as PEO χc‑PU‑2‑100 (%) = 21.9 ± 2.3, PEO χc‑PU‑5‑100 (%) = 34.6 ± 2.5, and PEO χc‑PU‑8‑100 (%) = 41.4 ± 2.2 after the normalization of the respective enthalpy changes given in Figure 1b with the weight fraction of PEO, which correspond to (ΔHm − ΔHc) of 43.1 ± 4.5, ΔHm of 68.1 ± 4.9, and ΔHm of 81.4 ± 4.3 J/gPEO for PU- 2-100, PU-5-100, and PU-8-100, respectively. The changes in PEO Tm values as a function of soft segment molecular weight and drying temperature are shown in Figure 4. PEO Tm values of the samples prepared at 60 °C are higher than those of their analogues prepared at 100 °C, meaning that the drying protocol comprising a thermal treatment at 100 °C results in a decrease in the PEO Tm. In addition, ΔTm systematically increases with increasing soft segment molecular weight. This is directly related to the formation of α-complex crystals via confined crystallization of poly(ethylene oxide) chains in subnanometer urea channels. As the PEO chain length increases, the thickness of the α- complex in the longitudinal direction, i.e., the channel length, which can be followed by its increasing melting point (α Tm) given in Figure 5b, increases too in accordance with the one- dimensional (1D) nature of the α-complex. This indicates that lateral surface area and, thus, a higher number of nucleation sites on the 1D threadlike cores of the complex also increases with increasing PEO chain length. In this respect, other PEO chains are driven to align in the longitudinal direction, i.e., in a parallel manner with the 1D α-complex, and strung together by the threadlike core. The increase in the thickness in the longitudinal direction with increasing PEO chain length gives rise to the decrease in the thickness in the radial direction with the same extent. For instance, as the formation of α-complex leads to a decrease in the radial thickness resulting in a decrease of 2 °C (PU‑2 ΔTm) in PEO Tm of the copolymer based on PEO-2000 soft segment (PU-2), this decrease (PU‑8 ΔTm) becomes 3 times higher for the copolymer based on PEO-8000 (PU-8), since the PEO chain length in PU-8 is 3 times higher than the one in PU-2. Microphase Separation/Mixing. The exotherms located at 119, 139, and 159 °C in Figure 1b are assigned to the microphase separation temperatures (TMST) of PU-2-100, PU- 5-100, and PU-8-100, respectively. TMST linearly increases with increasing soft segment molecular weight. In general, the microphase separation temperature in diblock copolymers has been reported to be dependent on the product χN as well as the content of the copolymer, where χ is referred as the Flory− Huggins interaction parameter and N is the polymerization index. This is also applied for segmented copolymers like polyurethanes. As the soft segment molecular weight increases, the hard segment molecular weight increases too for achieving a constant weight fraction in terms of percent HS content. Therefore, the average sequence length increases, too. In this respect, as suggested by Koberstein and Russell,38 if χ inversely proportional to temperature, the effect of the increasing average sequence length would be to raise the TMST. In general, this transition (TMST) is followed by the microphase mixing (TMMT) and/or the melting of microcrystalline hard domains in polyurethanes. The presence of multiple endotherms is usually associated with either melting or mixing of phases with the different domain sizes. Consequently, it is crucial to understand the origins of such endothermic peaks observed at high temperatures. It is also of particular interest to address the two interrelated questions denoted as follow: (I) Are these peaks solely formed by the heating effect during DSC scan? (II) Are they arisen from the thermal transitions of the phases, such as melting of the crystals, already existing in the samples? To address this issue, the high-temperature endotherms must be examined together with the microphase separation exotherm since, in such thermograms, the enthalpy changes of microphase separation (ΔHMST) and microphase mixing (ΔHMMT) processes are almost equal to each other. Therefore, it is reasonable to consider that the difference between these two enthalpy changes, which is defined as α ΔH = ΔHMMT − ΔHMST, should originate from the thermal transitions of the phases already existing in the samples. From this perspective, we attempt to understand the origins of the peaks observed at the high temperatures. Aforementioned, PU-2-100 shows an exotherm with a peak temperature of 119 °C and multiple endotherms with peak temperatures of 176, 184, and 192 °C in the high-temperature region (Figure 1b). Interestingly, the peak temperatures vary with the same extent; that is, the differences between two subsequent peak temperatures are equal to each other as described as follows: T192 − T184 = T184 − T176 = 8 °C, where the subscripts represent the corresponding peak temperatures (Figure 5a). Therefore, it is reasonable to consider that PU-2-100 contains the α-complex crystals with three different sizes in three different “mixed” phase domains. For this material, α ΔH is calculated as 11.8 ± 0.7 J/gPU, assuming that the respective three endotherms are Figure 4. Change in the melting point of PEO soft segment crystals (PEO Tm) as a function of SSMW and drying temperature. Effect of SSMW; PEO Tm(PU‑8‑60) > PEO Tm(PU‑5‑60) > PEO Tm(PU‑2−60), and PEO Tm(PU‑8‑100) > PEO Tm(PU‑5‑100) > PEO Tm(PU‑2‑100). Effect of drying temperature; PEO Tm(PU‑2‑60) > PEO Tm(PU‑2‑100), PEO Tm(PU‑5‑60) > PEO Tm(PU‑5‑100), and PEO Tm(PU‑8‑60) > PEO Tm(PU‑8‑100). ΔTm is calculated as the absolute value of PU‑X ΔTm = PU‑X‑60 Tm − PU‑X‑100 Tm, where X indicates the molecular weight of the PEO used in kilodaltons. ΔTm systematically increases with increasing soft segment molecular weight. This is related to the formation of α-complex crystals via confined crystallization of PEO within the subnanometer urea channels. Macromolecules pubs.acs.org/Macromolecules Article https://doi.org/10.1021/acs.macromol.1c00596 Macromolecules 2021, 54, 4704−4725 4709
  • 7. arisen from melting of α-complex crystals with three different sizes, which simultaneously takes place with mixing of the phases in these domains. The α ΔH of 11.8 ± 0.7 J/gPU basically indicates the presence of a crystalline phase giving rise to the formation of such a difference between ΔHMMT and ΔHMST enthalpy changes. α ΔH values are also calculated as 15.4 ± 0.5 and 16.9 ± 0.6 J/gPU for PU-5-100 and PU-8-100, respectively. It should be emphasized that α ΔH increases with increasing soft segment molecular weight. Moreover, there is a correlation between the peak temperatures of high-temperature endotherms observed for the samples prepared at 100 °C with respect to the soft segment molecular weight (Figure 5b). If we assume three different hypothetical domain sizes (Dα1 , Dα2 , Dα3 ) assigned for these three endotherms, one can easily see that the peak temperature linearly increases with increasing domain size (Figure 5a) since the difference between two subsequent peak temperatures are equal to each other that can be defined as Δα TM = T192 − T184 = T184 − T176 = 8 °C, where the subscripts represent the corresponding peak temperatures. A similar trend is also observed as a function of soft segment molecular weight (Figure 5b). If we assume the peak at 192 °C as the main peak of α TM in PU-2-100, one can see that α TM linearly increases with increasing soft segment molecular weight, which can be described as Δα TM = α TPU‑8‑100 − α TPU‑5‑100 = α TPU‑5‑100 − α TPU‑2‑100 = T220 − T206 = T206 − T192 = 14 °C. 3.3. X-ray Diffraction. Three different crystal structures, i.e., PEO with a monoclinic unit cell,39−43 tetragonal urea crystals,44 and PEO−urea α-complex crystals with a trigonal unit cell,45−52 can possibly be formed in our materials (see the Supporting Information, section S5). Figure 6 shows XRD patterns obtained from PU-2-60 and PU-2-100. PU-2-60 only displays an amorphous halo, whereas PU-2-100 shows two sharp peaks at 19.3° and 23.3° and a fairly weak peak at 27.4° and 36.2°. The XRD pattern obtained for PU-2-60 is expected and in accordance with the results obtained from thermal analyses (Figure 1a), indicating that the sample is amorphous at room temperature as the melting endotherm observed in PU-2-60 is below room temperature. However, the XRD pattern of PU-2-100 is an unexpected result due to the following reasons: (i) The melting endotherm of PEO soft segment in PU-2-100 is below the room temperature (Figure 1b) which indicates an amorphous sample at room temper- ature like PU-2-60. Thus, these peaks are unlikely to be originated only from PEO soft segments. (ii) The hard segment model compounds are also found to be completely amorphous as demonstrated in Figure S2. Hence, the peaks are unlikely to be derived only from the hard segments either. (iii) Even if we assume that they are originated from pure crystalline hard domains formed by hydrogen bonded urea groups, the positions of these peaks, at least, should be similar to the ones reported for urea model compounds. However, this is not the case here. (iv) In addition, the peaks, at least at the first glance, are fairly similar to the ones typically assigned for the crystalline PEO rather than urea. (v) Nevertheless, they should be associated with the structures giving rise to the formation of multiple endotherms at high temperatures (Figure 1b). We therefore consider that the peaks may be originated from a complex crystal structure involving both PEO and urea units. Upon a careful literature review, we have then found out that the peaks at 19.3° and 27.4° can indeed be arisen from PEO− urea α-complex crystals. They mainly correspond to the crystal planes of (200) and (202), respectively. The intensity of the peak at 19.3° is significantly higher than that of the peak at 27.4°. Structural features of this complex crystal formed in “host−guest”’ systems termed PEO−urea inclusion complexes are well-documented in the literature.45−52 However, to the Figure 5. Change in α TM as a function of domain size for triple endotherms in PU-2-100 (a) and soft segment molecular weight (b). Figure 6. XRD patterns of PU-2-60 and PU-2-100. Macromolecules pubs.acs.org/Macromolecules Article https://doi.org/10.1021/acs.macromol.1c00596 Macromolecules 2021, 54, 4704−4725 4710
  • 8. best of our knowledge, the question of whether this kind of complex crystal can form in PU copolymers containing PEO and urea units has not yet been addressed. Our results suggest that this, in fact, is possible. There is also another strong peak at 23.3° (Figure 6). This peak is generally termed a characteristic peak of helical PEO chains assigned to (112) and/or (032) crystal planes representing the degree of helicity since it is not observed in the transplanar form.41 Considering 72 helical nature of PEO chains in pure form, this peak can be an indication of some “crystallized” PEO chains in the mixed phase placed in the immediate vicinity of threadlike cores of the α-complex. There is another peak at 36.2°, which is in the middle of two characteristic peaks of tetragonal urea crystals generally observed at 35.5° and 37.1° corresponding to the crystal planes of (210) and (201). The intensity of this peak is very similar to that of the peak located at 27.4°. Considering all the apparent peaks together, it is reasonable to envisage that 1D threadlike cores of the α-complex involving 41 helical PEO chains and hydrogen bonded urea molecules are surrounded by another crystalline layer of the mixed phase containing some “crystallized” PEO chains with 72 helical conformation and tetragonal urea crystals. In comparison to the tightly packed α-complex crystals, this crystalline layer is expected to be in a relatively more “disordered” state. Figure 7 display XRD patterns of the PU copolymers based on PEO-4600 and PEO-8000 soft segments. On one hand, PU- 5-60 displays the peaks located at 14.9°, 19.3°, 23.2°, and 26.2° (Figure 7a). The peaks at 14.9°, 19.3°, and 23.2° are also observed for PU-8-60 (Figure 7b). However, the peak located at 26.2° is not clearly visible for this sample. The intensities of the peaks at 19.3° and 23.2° are significantly higher than the ones observed at 14.9° and 26.2° for both PU-5-60 and PU-8- 60. On the other hand, PU-5-100 shows the peaks at 13.6°, 14.6°, 15.2°, 19.3°, 23.2°, 25.8°, 26.2°, 27.2°, 29.4°, 30.8°, and 36.2° (Figure 7a). Similarly, the peaks located at 13.6°, 14.5°, 15.1°, 19.3°, 21.1°, 22.0°, 23.2°, 25.8°, 26.2°, 27.2°, 27.7°, 30.8°, and 36.2° are observed for PU-8-100 (Figure 7b). The intensities of the peaks at 19.3° and 23.2° are significantly higher than those of the other peaks in both of the samples. Figure 7. XRD patterns of (a) PU-5-60 and PU-5-100 and (b) PU-8-60 and PU-8-100. Figure 8. XRD patterns of (a) PU-2-60, PU-5-60, and PU-8-60 and (b) PU-2-100, PU-5-100, and PU-8-100 as a function of soft segment molecular weight. Macromolecules pubs.acs.org/Macromolecules Article https://doi.org/10.1021/acs.macromol.1c00596 Macromolecules 2021, 54, 4704−4725 4711
  • 9. The peaks located at 21.1°, 22.0°, and 27.7° are not clearly visible in the diffractogram of PU-5-100, whereas they become more apparent for PU-8-100. The assignment of these peaks is provided in Figure 8 which also shows the comparison of the XRD patterns as a function of soft segment molecular weight. For PU-5-60 and PU-8-60 (Figure 8a), the peaks at 14.9°, 19.3°, and 23.2° mainly correspond to the crystal planes of (110), (120), and (112), respectively.41 The peak at 26.2°, which is only visible for PU- 5-60, is assigned to the crystal plane of (033). They are reported for 72 helical PEO chains and originated from the crystalline matrix phase in these two copolymers. These results are in a good agreement with the results obtained from MDSC analyses of these two copolymers, suggesting that the endotherms located at 42.1 and 51.2 °C in the MDSC thermograms of PU-5-60 and PU-8-60 originate from the melting of PEO soft segment crystals. For PU-5-100 and PU-8-100 (Figure 8b), the peaks located at 13.6° and 25.8° originate only from the presence of PEO− urea α-complex crystals. These two peaks are assigned to the crystal planes of (101) and (112) with d-spacings of 6.52 and 3.45 Å, respectively. Besides, the peaks resulted only from the presence of monoclinic PEO crystals are listed in the following along with the corresponding crystal planes and d-spacings: the peaks at 14.5°, 21.1°, 23.2°, and 26.2° are assigned to the crystal planes of (021), (031), (112), and (033) with d- spacings of 6.11, 4.21, 3.83, and 3.40 Å, respectively. It should be noted that the peak at 23.2° can also be assigned to the crystal plane of (032) as reported in the literature.41 More importantly, there are two mutual peaks located at 19.3° and 27.2°−27.7°, which are originated from the presence of both of the PEO−urea α-complex and the PEO crystals. The peak located at 19.3° represents the crystal plane of (120) for the crystalline PEO, whereas it also corresponds to the crystal plane of (200) for PEO−urea α-complex. If we assume that this peak is only resulted from the presence of PEO crystals, the peak intensities recorded for PU-5-100 and PU-8-100 samples should be lower than those of PU-5-60 and PU-8-60 since the corresponding crystallinity values of PU-5-60 and PU-8-60 are relatively higher than the ones recorded for PU-5- 100 and PU-8-100, respectively. However, this is not the case in here. For this peak, the peak intensities in PU-5-100 and PU-8-100 are notably higher than the ones in PU-5-60 and PU-8-60, respectively. This result strongly suggests that the PEO−urea α-complex crystals directly contribute to the total intensity of the peak located at 19.3° which mainly corresponds to the d-spacing of 4.59 Å. Therefore, it should be emphasized that this peak originated from the presence of both of the PEO−urea α-complex and the PEO crystals in both samples. To provide a clear overview on the peaks located at 27.2°− 27.7° as well as the other small peaks, a magnified view of the diffractogram obtained from PU-8-100 is representatively reproduced in Figure 9. It should be noted that most of the small peaks highlighted in Figure 9 are also observed for PU-5- 100. However, its diffractogram is not used in this figure for clarity. The peaks at 13.4°, 14.5°, 15.1°, 21.1°, 22.0°, and 26.2° (Figure 9) arise only from the presence of monoclinic PEO crystals. These peaks correspond to the crystal planes of (100), (021), (110), (104), (023), and (033), respectively. The peaks at 13.6° and 25.8° corresponding to the crystal planes of (101) and (112) originate only from the presence of PEO−urea α- complex crystals. The peak expected to be located at 27.4°, which is assigned to the crystal planes of (202) and (200) for trigonal PEO−urea α-complex and monoclinic PEO crystals, respectively, in the literature, seems to be split into two different peaks located at 27.2° and 27.7°. The d-spacings of these two peaks are 3.27 and 3.22 Å, respectively. Another small peak is observed at 30.8°. In this region, it is expected to see two characteristic peaks of crystalline urea, which are generally located at 29.3° and 31.6° corresponding to the crystal planes of (111) and (200), respectively. Thus, it is likely that the small peak at 30.8° arises from a combination of two characteristic peaks of crystalline urea. This might be due to the interactions between the PEO and urea groups. A similar combination is also observed for the peaks expected to be located at 35.5° and 37.1° in pure form as denoted in Figure 7. Instead of these two characteristic peaks corresponding to the crystal planes of (210) and (201) of urea crystals, there is a single peak at 36.2°, which is in the middle of those two. Overall, the XRD results are in a good agreement with the data obtained from MDSC analyses of the PU copolymers. These results mainly suggest that PU-2-60 is completely amorphous at room temperature, whereas PU-2-100 contains the PEO−urea α-complex crystals surrounded by another crystalline layer, which is formed by a mixed phase comprising some “crystallized” helical (monoclinic) PEO crystals and hydrogen-bonded (tetragonal) urea crystals (Figure 6). On the other hand, PU-5-60 and PU-8-60 contain monoclinic PEO crystals, whereas PU-5-100 and PU-8-100 comprise both trigonal PEO−urea α-complex crystals and monoclinic PEO crystals (Figure 7). The structure formation is basically governed by the bulk crystallization of the PEO chains in both PU-5-60 and PU-8-60, whereas it is mainly driven by the confined crystallization of the PEO chains in subnanometer urea channels in both PU-5-100 and PU-8-100, which is followed by the formation of monoclinic PEO crystals that are initially nucleated on the lateral surfaces of the α-complex crystals. Our interpretation has been only based on the peak positions so far. However, the positions of characteristic diffraction peaks of the crystalline PEO are very similar to those of the PEO−urea α-complex crystal structure. We therefore consider that this should be supported by the quantitative analysis of the results in terms of crystallinity. Figure 9. Small peaks representatively shown in the XRD pattern of PU-8-100. Macromolecules pubs.acs.org/Macromolecules Article https://doi.org/10.1021/acs.macromol.1c00596 Macromolecules 2021, 54, 4704−4725 4712
  • 10. In an effort to quantify our results, the patterns over a specific angular range of 10°−40° were fitted by using Origin data processing software to a linear combination of a Lorentz function for the amorphous halo and Pearson functions for the crystalline peaks, which is a widely accepted fitting procedure for such materials in the literature.41,53 The total crystallinity values of the samples were calculated as XRD χc = [Ic/(Ic + Ia)], where Ic and Ia are the integrated intensity of all crystalline peaks and of the amorphous halo, respectively. The corresponding results are plotted in Figure 10. The XRD χc values are calculated as 0%, 44.2%, and 57.3% for PU-2-60, PU-5-60, and PU-8-60, respectively. As PU-2-60 displays an amorphous halo in its XRD pattern recorded at room temperature and an endotherm below the room temperature in its MDSC thermogram, it is reasonable to obtain the XRD χc value as 0% for this sample. In addition, the XRD χc values of PU-5-60 and PU-8-60 are in a good agreement with DSC χc(SS) values calculated from the total heat flow signals. The total crystalline fractions of the samples prepared at 60 °C (PU-2-60, PU-5-60, and PU-8-60) are equal to the crystalline fractions of the PEO soft segments since there is no apparent thermal transitions related to the hard segments in their MDSC thermograms (Figure 1a). The XRD χc values of PU-2-100, PU-5-100, and PU-8-100 are calculated as 17.6%, 57.9%, and 67.2%, respectively. The DSC χc(PEO) values of these samples, on the other hand, are determined to be 0%, 34.6%, and 41.4%, respectively. One can see that the XRD χc values are significantly different than DSC χc(PEO) values for the samples prepared at 100 °C. This means that there is a significant contribution to the XRD χc values, i.e., total crystallinity, of the samples PU-2-100, PU-5- 100, and PU-8-100, which must arise from the presence of another crystalline phase. We therefore believe that this result confirms the presence of the PEO−urea α-complex crystals. To provide a more detailed insight, XRD χc is defined as XRD χc = XRD χc(PEO) + XRD χc(α), where XRD χc(PEO) and XRD χc(α) correspond to crystalline fractions of the PEO and the PEO−urea α-complex, respectively. Assuming the same standard deviation between XRD χc(PEO) and DSC χc(PEO) values observed for the samples prepared at 60 °C, which is arisen from the different experimental conditions between XRD and MDSC analyses, XRD χc(PEO) values of PU-2-100, PU-5-100, and PU-8-100 are calculated as 0%, 35.1%, and 42.1%, respectively. Because PEO Tm of PU-2-100 is also well below room temperature (Figure 1b), the XRD χc(PEO) value is denoted as 0% for this sample. Inserting these XRD χc(PEO) values into the equation of XRD χc = XRD χc(PEO) + XRD χc(α), the corresponding XRD χc(α) values of PU-2-100, PU-5-100, and PU-8-100 are calculated as 17.6%, 22.8%, and 25.1%, respectively. The XRD χc(α) value of PU-2-100 also includes the crystalline fraction of the mixed phase containing some “crystallized” PEO chains with 72 helical conformation and tetragonal urea crystals in line with the multiple endotherms detected by MDSC analyses (Figure 1b). Figure 10 also shows the difference in the total degree of room temperature crystallinity values (Δχc) between the homologue samples prepared at 60 and 100 °C, i.e., PU-2- Figure 10. Total crystallinity values of the samples at 25 °C along with the percent increases arisen from the change in the drying temperature. Figure 11. (a) Comparative ATR-IR spectra of PU-2-100 (top spectrum) and PU-2-60 (bottom spectrum) in the 1400−1200 cm−1 region. (b) Comparative ATR-IR spectra of PU-8-100 (top spectrum), PU-5-100 (middle spectrum), and PU-2-100 (bottom spectrum) in the 1400−1200 cm−1 region. Macromolecules pubs.acs.org/Macromolecules Article https://doi.org/10.1021/acs.macromol.1c00596 Macromolecules 2021, 54, 4704−4725 4713
  • 11. 60 vs PU-2-100, PU-5-60 vs PU-5-100, and PU-8-60 vs PU-8- 100, which is induced by the change in the drying temperature and calculated as PU‑X Δχc = PU‑X‑100 χc − PU‑X‑60 χc, where X represents the molecular weight of the PEO used in kilodaltons. The drying at 100 °C results in (approximately) 18, 14, and 10% increases in the room temperature total crystallinity values of PU-2, PU-5, and PU-8 copolymers, respectively (Figure 10). 3.4. Spectroscopy. ATR-IR is a simple but powerful tool to investigate the characteristic features of PEO−urea α- complex crystalline structures. Characteristic absorption bands for α-complex were listed as 1360, 1342, 1277, 1248, 953, and 945 cm−1 .48,51 From these key bands, the absorption bands at 1360, 1277, 1248, and 945 cm−1 are generally assigned to CH2 wagging, CH2 twisting, CH2 rocking, and C−O−C deforma- tion perpendicular to the chain axis, respectively, whereas the ones at 1342 and 953 cm−1 correspond to CH2 wagging, CH2 twisting, and rocking conformation parallel to the chain axis.48,51,54 Because PEO and urea can also form various metastable complexes with different forms, the difference between the thermodynamically stable α-complex and the others is mainly followed by CH2 wagging absorption band of amorphous PEO chains at 1352 cm−1 . This band has been reported to split into two bands at 1360 and 1342 cm−1 as a direct result of the formation of α-complex crystals.46,48,51 This can be clearly seen when the ATR-IR spectra of PU-2-60 and PU-2-100 provided in Figure 11a are compared. When the polymer film is annealed at 60 °C, PEO chains are mainly in the amorphous state as evidenced by a single absorption band at 1352 cm−1 in the ATR-IR spectrum of PU- 2-60, given in Figure 11a. On the other hand, when it is prepared at 100 °C (PU-2-100), this band splits into two peaks centered at 1360 and 1342 cm−1 as shown in Figure 11a. A significant effect of PEO molecular weight on the formation of the PEO−urea α-complex can be seen in the 1400−1200 cm−1 region of the AT-IR spectra provided in Figure 11b for PU-2- 100, PU-5-100, and PU-8-100. As the PEO molecular weight increases, the peaks at 1360, 1342, and 1277 cm−1 showing the formation of PEO−urea α-complex become much more pronounced. The formation of PEO−urea α-complex can also be confirmed by Raman spectroscopy. Characteristic Raman bands of α-complex are listed as 1278, 1237, 862, and 845 cm−1 , whereas the peaks for the metastable complex are reported to be at 1308, 1259, and 845 cm−1 in the literature.48 These bands are very similar to various crystalline forms of PEO, and detailed conformational analysis and band assign- ments can be found in the literature.41,55−57 The 1350−550 cm−1 region of the Raman spectra of PU-2-60 and PU-2-100 are reproduced in Figure 12a. Formation of α-complex in PU- 2-100 is indicated by the presence of well-defined peaks centered at 1278 and 1237 cm−1 , which are not observed in PU-2-60, and the sharp peak at 845 cm−1 which is significantly intense in PU-2-100 compared to PU-2-60 as shown in Figure 12a. Characteristic absorption bands of the α-complex at 1278, 1237, 862, and 845 cm−1 are much more pronounced in the Raman spectra of PU-5-100 and PU-8-100, which are provided in Figure 12b together with PU-2-100 for comparison. The spectroscopic data obtained from ATR-IR and Raman measurements are in accordance with the results obtained from MDSC and XRD analyses. Therefore, they can be evaluated together to provide more detailed structural insight into final room temperature morphologies of the PU copolymers under investigation, particularly for the ones prepared at 100 °C. Considering all these results together, it is interesting to note that PEO chains are adapted to two different secondary structures termed 41-helix and 72-helix. One of them (41-helix) is attributed to the PEO chains confined into the subnanometer urea channels as demonstrated by the presence of α-complex crystals, and the other one (72-helix) is assigned to the ones located in “bulk” PEO crystals. Both structures are stable in PU-5-100 and PU-8-100 at room temperature as both materials display two different melting endotherms well above the room temperature. For PU-2-100, the results basically suggest that the 41-helix in α-complex is stable at room temperature. Although multiple endotherms located at high temperatures (Figure 1b) and the XRD peak located at 23.2° standing for the crystal plane of (112)PEO are present (Figures 6 and 8b), it is not easy to identify the room temperature stability of the 72-helix in PU-2-100 as the melting endotherm belonging to the “bulk” PEO crystals is well below ambient Figure 12. (a) Raman spectra of PU-2-100 (top spectrum) and PU-2-60 (bottom spectrum) in the 1350−550 cm−1 region. (b) Raman spectra of PU-8-100 (top spectrum), PU-5-100 (middle spectrum), and PU-2-100 (bottom spectrum) in the 1350−550 cm−1 region. Macromolecules pubs.acs.org/Macromolecules Article https://doi.org/10.1021/acs.macromol.1c00596 Macromolecules 2021, 54, 4704−4725 4714
  • 12. temperature. However, it is more interesting to determine other possible secondary structures in the PU copolymers under investigation, particularly PU-5-100 and PU-8-100, in addition to these two helical conformations. It is well-known that hydrogen-bonded hard segments in PU copolymersin generalform secondary structures identical with parallel/ antiparallel (mostly antiparallel) β-sheets found in native structures like spider silk. Determining these structures in the presence of the two helical conformations demonstrated here would allow for a better understanding of intermolecular interactions and packing behavior between these sheets and helices. More importantly, it can provide a convenient framework to reconcile structural similarities between synthetic PU copolymers and protein-based materials containing such secondary structures, such as spider silk.58−66 Most recently, Johnson et al.67 investigated the influence of such secondary structures, α-helix and β-sheet in particular, on the mechanical properties of peptide−polyurea hybrids based on 1,6-hexam- ethylene diisocyanate (HDI) and poly(dimethylsiloxane) (PDMS, 2500 g/mol) incorporated by either poly(β-benzyl- L-aspartate) (PBLA) or poly(ε-carbobenzyloxy-L-lysine) (PZLY) peptide blocks with different sequence length in the form of “peptide-b-PDMS-b-peptide”. ATR-IR studies con- ducted by these authors verified the existence of the desired secondary structures despite the simplicity of the polyureas. They observed mixtures of α-helix and β-sheet in those polymers consisting of longer peptidic segments. Besides, Tanaka et al.68 studied the secondary structures in highly crystallized ABA triblock copolymers (PBLA−PEO−PBLA) containing PEO blocks with Mn values of 11000 and 20000 g/ mol. FT-IR results reported by these authors revealed the formation of a specific α-helix−72-helix−α-helix conformation. They did not observe the β-sheet conformation in as-casted samples, but they reported a structural change from an α-helix to a β-sheet conformation induced by thermal treatment. The forenamed natural design motifs, secondary structures, were also examined by Sogah’s group69,70 in silk-inspired multiblock copolymers containing poly(alanine-b-oxyethylene-b-alanine) triblock (Mn = 823 and 1097 g/mol) comprising short PEG as a nonnative equivalence of the amorphous polypeptide domain of a spider silk.69 They demonstrated the formation of β-sheets and their assembly into discrete nanostructures.69 These secondary structures are usually followed by amide-I and amide-II regions of the ATR-IR spectra, which are provided in Figure 13a for the PU copolymers prepared at 100 °C. Although secondary structure characterization has received particular attention in such polymeric systems containing peptidic units, the respective spectral regions (amide-I and amide-II) in non-peptide-based PU copolymers like our materials have not been comprehensively analyzed in terms of those secondary structures. More specifically, despite the extensive base of PU literature, at least to the best of our knowledge, there are no reports where qualitative and quantitative assessments of secondary structures, and their effects on structure−property relationships of final materials have been systematically investigated as a function of critical design parameters like molecular weights of soft and hard segments. In the present work, we give an exclusive focus on the secondary structure determination as a part of our continuing efforts to provide more structural insight into the PU copolymers under investigation for a better understanding of their structure−property behavior. As shown in Figure 13a, at first glance, three different peaks are clearly visible at 1715− 1711, 1633−1629, and 1557−1550 cm−1 in the ATR-IR spectra of the samples. In polyurethane literature, these peaks are usually assigned to “ordered” urethane CO, “ordered” urea CO stretching, and amide-II vibrations, respectively.4 In line with this, quantification of these peaks is generally performed to determine the extent of hard segment phase separation by calculating percent amounts of different carbonyl groups representing non-hydrogen-bonded, hydrogen-bonded, disordered, and ordered structures.71 However, such descrip- tions do not allow for the identification of the forenamed secondary structures in PU copolymers, which is of particular interest to understand the packing behavior in such complex materials along the multiple length scales. In addition, as it can be seen in Figure 13a, the respective region is very broad due to overlapping of several peaks Figure 13. (a) Comparative ATR-IR spectra of PU-8-100 (top spectrum), PU-5-100 (middle spectrum,) and PU-2-100 (bottom spectrum) in the 1750−1500 cm−1 region. (b) Representative amide-I band deconvolution in PU-8-100. Six different peaks with peak maxima at 1711 cm−1 (β- turnpeak‑I), 1699 cm−1 (β-turnpeak‑II), 1683 cm−1 (β-turnpeak‑III), 1668 cm−1 (β-sheetpeak‑I), 1652 cm−1 (41-helix), and 1629 cm−1 (β-sheetpeak‑II) are detected by deconvolution. Macromolecules pubs.acs.org/Macromolecules Article https://doi.org/10.1021/acs.macromol.1c00596 Macromolecules 2021, 54, 4704−4725 4715
  • 13. originating from the presence of different secondary structures. This suggests that the respective regions should be investigated in detail to provide more structural insight into the materials. To this end, a typical deconvolution procedure, which is summarized in section 2.4, is carefully applied to provide a clear overview on the secondary structures in the PU copolymers prepared at 100 °C. Figure 13b representatively displays the deconvoluted amide-I peaks in the 1750−1600 cm−1 region of the ATR-IR spectra of PU-8-100. The corresponding results obtained from PU-2-100 and PU-5-100 are also provided in Figures S6 and S7, respectively. Six different peaks are found at 1715−1711, 1699, 1683, 1668, 1652, and 1633−1629 cm−1 for these three samples, i.e., PU-2-100, PU-5-100, and PU-8-100. The peaks at 1715−1711 cm−1 (at 1713 cm−1 for PU-2-100, at 1714 cm−1 for PU-5-100, and at 1711 cm−1 for PU-8-100) as well as 1699 and 1683 cm−1 originate from the presence of several different HMDI isomers, such as trans,trans (E, E), trans,cis (E, Z), and cis,cis (Z, Z). HMDI isomers affect the packing behavior in the solid state. This in turn restricts the formation of the well-ordered hydrogen-bonded structures in the PU copolymers.71 There- fore, it is reasonable to consider that these three peaks mainly represent the monodentate hydrogen-bonded structures. However, for these three peaks, the relative hydrogen-bonding strength is different than each other. Considering the peak positions, it should be noted that the peak at 1683 cm−1 represents a monodentate, but relatively well-ordered, hydro- gen-bonded structure (relatively stronger hydrogen bonding) compared to the peaks at 1699 and 1715−1711 cm−1 . In other words, the degree of imperfection in monodentate hydrogen bonding for the structures giving rise to the formation of these three peaks can be listed as follow: 1715−1711 cm−1 > 1699 cm−1 > 1683 cm−1 . In terms of secondary structures, we consider that these peaks can be assigned to β-turns since they are mainly formed by monodentate hydrogen bonds and create loops at the chain ends. The peaks at 1668 and 1633−1629 cm−1 (at 1633 cm−1 for PU-2-100, at 1631 cm−1 for PU-5-100, and at 1629 cm−1 for PU-8-100) are assigned to antiparallel β- sheets, whereas the peak at 1652 cm−1 is mainly attributed to 41-helix. The antiparallel β-sheets are formed by the bidentate hydrogen-bonded highly ordered urea molecules on the walls of the channels, whereas the excess urea molecules inside the channels adapt to 41-helix conformation as well as confined PEO chains. In accordance with this, characteristic amide-II peaks of the 41-helix and β-sheet secondary structures are also detected at 1557−1550 cm−1 (41-helix), 1535 cm−1 (β-sheet), and 1515 cm−1 (β-sheet) by the deconvolution. The corresponding results are provided in Figures S8−S10. Similar results are obtained in the literature.72 It should be emphasized that the peak around 1652 cm−1 is usually assigned to several Figure 14. Fractions (ϕ) of the secondary structures as a function of soft segment molecular weight: (a) Fractions of β-turnpeak‑I (1715−1711 cm−1 ) are calculated as PU‑2 ϕI = 14.5%, PU‑5 ϕI = 10.5%, and PU‑8 ϕI = 5.2%. Fractions of β-turnpeak‑II (1699 cm−1 ) are determined to be PU‑2 ϕII = 15.6%, PU‑5‑100 ϕII = 11.5%, and PU‑8‑100 ϕII = 6.3%. (b) Fractions of β-turnpeak‑III (1683 cm−1 ) are calculated as 12.9%, 10.5%, and 7.5% for PU-2-100, PU-5-100, and PU-8-100, respectively. Figure 15. Fractions (ϕ) of the secondary structures as a function of soft segment molecular weight: (a) Fractions of the 41-helix: 41‑helix ϕPU‑2‑100 = 19%, 41‑helix ϕPU‑5‑100 = 22.5%, and 41‑helix ϕPU‑8‑100 = 27%. (b) Fractions of the β-sheet: β‑sheet ϕPU‑2‑100 = 38%, β‑sheet ϕPU‑5‑100 = 45%, and β‑sheet ϕPU‑8‑100 = 54%. Macromolecules pubs.acs.org/Macromolecules Article https://doi.org/10.1021/acs.macromol.1c00596 Macromolecules 2021, 54, 4704−4725 4716
  • 14. helical structures, such as α-helix and 31-helix for different materials. This suggests that the respective peak should be particularly examined for each system. In our case, the peak at 1652 cm−1 is attributed to 41-helix for the PU copolymers under investigation as it is also characterized by a series of experiments in this study. On the other hand, the deconvolution allows for quantitative assessment of the secondary structures listed above. Figures 14 and 15 display the fractions of the secondary structures as a function of soft segment molecular weight. In a general form, the fraction is defined as follow: s ϕ = s Apeak/Atotal, where s, s Apeak, and Atotal illustrate the secondary structure, the area under the respective peak, and the total area under the cumulative peak, respectively. The peaks at 1715−1711 cm−1 (β-turnpeak‑I), 1699 cm−1 (β- turnpeak‑II), and 1683 cm−1 (β-turnpeak‑III) are assigned to β-turn secondary structures. The total β-turn fraction is defined as β‑turn ϕPU‑X‑100 = β‑turn‑peak‑I ϕPU‑X‑100 + β‑turn‑peak‑II ϕPU‑X‑100 + β‑turn‑peak‑III ϕPU‑X‑100 where X represents ⟨Mn⟩ of the PEO in kilodaltons. β‑turn‑peak‑I ϕPU‑X‑100 and β‑turn‑peak‑II ϕPU‑X‑100 are equal to PU‑X ϕI and PU‑X ϕII values denoted for β-turnpeak‑I and β- turnpeak‑II in Figure 14a, respectively, whereas ϕ values in Figure 14b represent β‑turn‑peak‑III ϕPU‑X‑100 for β-turnpeak‑III. It should be noted that β-turnpeak‑III, the peak at 1683 cm−1 , is also termed “monodetate hydrogen bonded and/or disordered helix” in the literature.72 Because of this reason, its relationship with PEO molecular weight is provided in a separate plot (Figure 14b), and its assignment is denoted with a “question mark”. The β-turnpeak‑I fractions of PU-2-100, PU-5-100, and PU-8-100 are calculated as 14.5%, 10.5%, and 5.2%, whereas their β-turnpeak‑II fractions are determined to be 15.6%, 11.5%, and 6.3%, respectively (Figure 14a). The β-turnpeak‑III fractions of these three samples (PU-2-100, PU-5-100, and PU-8-100) are calculated as 12.9%, 10.5%, and 7.5%, respectively (Figure 14b). Accordingly, their total β-turn fractions are determined to be β‑turn ϕPU‑2‑100 = 43%, β‑turn ϕPU‑5‑100 = 32.5%, and β‑turn ϕPU‑8‑100 = 19%. As shown in Figure 14, β‑turn‑peak‑I ϕ, β‑turn‑peak‑II ϕ, β‑turn‑peak‑III ϕ, and thus β‑turn ϕ linearly decrease with increasing soft segment molecular weight (SSMW) since the number of chain ends decreases with increasing SSMW. In contrast, the fractions of both 41-helix (Figure 15a) and β- sheet (Figure 15b) secondary structures linearly increase with increasing SSMW (Figure 15). This is due to the fact that increasing SSMW also means increasing hard segment molecular weight and, thus, the increasing number of urea molecules that can participate in the secondary structure formation. The 41-helix fractions (41‑helix ϕ) of PU-2-100, PU-5- 100, and PU-8-100 are calculated as 19%, 22.5%, and 27% (Figure 14a), whereas their β-sheet fractions (β‑sheet ϕ) are determined to be 38%, 45%, and 54%, respectively (Figure 15b). The 41‑helix ϕ values are calculated as the area under the peak at 1652 cm−1 divided by the area under the cumulative peak (41‑helix ϕ = A1652/Atotal). Likewise, the β‑sheet ϕ values are calculated as the total area under the peaks at 1668 and 1629 cm−1 divided by the area under the cumulative peak (β‑sheet ϕ = (A1668 + A1629)/Atotal). As a part of the α-complex crystals, the 41-helix is also the conformation of the excess urea molecules inside the channels that adapt to the same conformation with the confined PEO chains within the channels. The β-sheet, on the other hand, is the conformation of the well-ordered urea molecules on the channel walls of the α-complex crystals. The quantitative results obtained from the deconvolution also support the presence of the α-complex crystals and their structural features. Based on the secondary structures, the superstructure of the α-complex crystals can be defined as the combination of three different layers: one internal (41-helix) and two external layers, i.e., the channel walls (β-sheet). Based on this three-layer model, the total fraction of the α-complex crystals can be calculated as α‑complex ϕ = [41‑helix ϕ + (β‑sheet ϕ/2)]/2. Using this equation, we determined α‑complex ϕ values of PU-2-100, PU-5-100, and PU- 8-100 to be 19%, 22.5%, and 27%, respectively. The α‑complex ϕ values are in a good agreement with the XRD χc(α) values, which are calculated as 17.6%, 22.8%, and 25.1% for PU-2-100, PU-5- 100, and PU-8-100, respectively. 3.5. Microscopy. Microscopic studies of the samples were performed by OM and AFM techniques. Figure 16 shows OM images of PU-2-60 and PU-2-100 recorded at room temper- ature. As an expected result, PU-2-60 does not display any microstructural feature since it is completely amorphous at ambient temperature (Figure 16a). This is also confirmed by AFM studies (Figure S11a). In line with this, the AFM phase image recorded with a scan size of 200 × 200 nm2 displays typical nanoscale morphology comprising dissolved hard segments in the soft matrix (Figure S11b). These results are in an excellent agreement with the results obtained from MDSC, XRD, FT-IR, and Raman spectroscopy. As shown in Figure 16b, PU-2-100 shows microcrystalline domains distributed in an amorphous matrix. This observation provides a convenient framework to examine the origins of multiple high-temperature endotherms observed in the MDSC Figure 16. Optical microscope images of (a) PU-2-60 and (b) PU-2-100 at 25 °C. Macromolecules pubs.acs.org/Macromolecules Article https://doi.org/10.1021/acs.macromol.1c00596 Macromolecules 2021, 54, 4704−4725 4717
  • 15. thermograms. As the melting point of PEO crystals is below room temperature, the apparent crystalline phases in PU-2-100 should be related to the α-complex crystals giving rise to the formation of the high-temperature endotherms. To clearly identify the form of microcrystalline domains, a high- magnification image of one of the microcrystalline domains is also presented in Figure 17a. These results are of importance from two different perspectives: First, the presence of microcrystals in the image of PU-2-100 recorded at room temperature basically proves that at least one of the multiple endotherms at high temperatures are not formed during the MDSC heating scan. Second, the apparent crystal shape also confirms our claim about the presence of the α-complex crystals. If we assume that one of the high-temperature endotherms is originated from the presence of “pure” microcrystalline hard domains solely formed by hydrogen- bonded hard segments, one should expect to see some needle- like structures as the hard segments mainly consist of urea groups. However, this is not the case here. This mainly suggests that at least one of the endotherms at high temperatures is due to the melting of a crystalline phase already present in the material. Considering the apparent shape of the crystals along with the data obtained from XRD, ATR- IR, and Raman spectroscopy measurements, this phase is considered to be formed by the α-complex crystals. In this respect, one can envisage two plausible scenarios: (I) These three endotherms might originate from the melting of the α-complex crystals with three different domain sizes. (II) The two of the three endotherms, most probably the ones at 176 and 184 °C, might arise from the melting/microphase mixing of ordered hard domains formed by microphase separation process characterized with a peak temperature of 119 °C during the MDSC heating scan. However, one of them, most probably the one at 192 °C, originates from the melting of a crystalline phase that already exists in the material as observed by OM and AFM (Figures 16b and 17). We believe that the first scenario is relatively more plausible as presented in Figure 5a. The nanoscale phase morphology comprising a stack of hexagonal nanoplatelets shown in Figure 17b is in a good agreement with the literature. PEO molecular-weight-depend- ent morphologies of single crystals of the PEO/Urea α- complex in the range 1000−100000 g/mol were analyzed by using scanning electron microscopy by Chenite and Brisse.45 The authors suggested that for the high Mw values the morphology is more likely to be a stack of hexagonal platelets rather than that of elongated pseudohexagonal prisms with very smooth faces which is mainly accounted for low- molecular-weight compounds. Considering the Mw of PU-2- Figure 17. Morphology of PEO−urea α-complex crystals as demonstrated by the optic microscope (a) and AFM phase (b) images along the multiple length scales. Figure 18. Optical microscope images of (a) PU-8-60 and (b) PU-8-100 at 25 °C. Macromolecules pubs.acs.org/Macromolecules Article https://doi.org/10.1021/acs.macromol.1c00596 Macromolecules 2021, 54, 4704−4725 4718
  • 16. 100 (106000 g/mol), our results are in a good agreement with the observations made by Chenite and Brisse. Upon these observations on the copolymer based on PEO- 2000 soft segment, it is reasonable to consider that the structure formation in the material prepared at 60 °C (PU-2- 60) is mainly governed by the lateral packing73−75 of the bidentate H-bonded urea groups from molecular level to nanoscale. In general, the lateral packing results in fibrillar phase-separated morphologies comprising an infinite stack of 1D H-bonded structures. This mechanism is also effective in PU-2-60, but only up to a certain length scale. The apparent nanoscale features therefore begin to disappear beyond this length scale (Figure S11a), and they are no longer visible at larger length scales (Figure 16a). On the contrary, when the samples are prepared at 100 °C, the structure formation is mainly driven by the confined crystallization of the PEO chains in subnanometer urea channels giving rise to the formation of the thermodynamically stable α-complex crystals. This is because both soft and hard segments have sufficient mobility to form the most stable conformation via strong intermolecular hydrogen bonding between the PEO ether oxygens and the urea N−H groups. Hence, they are cooperatively assembled into the tightly packed trigonal form with minimum free energy. A similar mechanism is also reported for the respective model compounds.48 The OM images of PU-8-60 (Figure 18a) and PU-8-100 (Figure 18b) recorded at room temperature are provided in Figure 18. On one hand, the OM image of PU-8-60 (Figure 18a) shows a typical spherulitic morphology of crystalline PEO with well-defined grain boundaries. As the formation of this structure is well-known in the literature, it will not be further discussed here. On the other hand, a geometrically confined crystalline morphology is observed for PU-8-100 (Figure 18b). This poses the question of how the confined crystallization of the PEO chains in the subnanometer urea channels does relate to the geometric confinement at the microscopic level. Before getting into this discussion, we should note that the morphologies presented for PU-8-60 and PU-8-100 represent the ones observed in PU-5-60 and PU-5-100, respectively. Furthermore, the presence of the α-complex crystals in PU-5- 100 and PU-8-100 is also evidenced by the microscopic analyses at a temperature (60 °C) above the melting points of PEO crystals as representatively shown in Figure S12. We can therefore conclude that both the monoclinic PEO and the trigonal α-complex crystals present in both PU-5-100 and PU- 8-100 at ambient temperature. However, this conclusion poses the question of how the final room temperature morphology given in Figure 18b is formed in the copolymers comprising both PEO and PEO−urea α- complex crystals. To address this issue, AFM is used to examine the phase morphologies at smaller length scales. For both PU-5-100 and PU-8-100, a “beads on a string” type nanoscale morphology consisting of compact globular domains is observed. An AFM image recorded on PU-8-100 is representatively shown in Figure 19. Each globular domain is isotropically distributed at nanoscale. The average size of a globular domain of PU-8-100 is 48 ± 4 nm, whereas that of PU-5-100 is 25 ± 3 nm. This means that each globular domain consists of tightly packed secondary structures demonstrated above (72-helix, 41-helix, and β-sheet). However, the question of which forces drive the formation of these globular domains with well-defined internal secondary structures still remains to be addressed. In principle, any self-avoiding flexible polymer chain would form a great number of secondary structures since it is basically driven to become more and more compact through any attractive force among the chain monomers.76 This means that the structure formation in compact polymers is mainly related to the severity of steric constraints.76 This steric principle of organization can provide a plausible explanation for why the samples dried at 100 °C are more compact than the ones dried at 60 °C. We basically have more steric constraints, i.e., geometric confinement, in the samples dried at 100 °C as compared to the ones dried at 60 °C since we have two mechanisms in which we have geometric confinement effects, i.e., the formation of PEO−urea α-complex crystals and the “bulk” crystallization of PEO segments in the former, whereas we have only one of them, i.e., the “bulk” crystallization of PEO segments, in the latter. The only notable geometric confinement arisen from the “bulk” crystallization of PEO segments is the acquirement of the trans−gauche−trans (ttg) conformation in the ethylene oxide units in the crystalline PEO soft domains with helical conformation (72-helix). This gives rise to a decrease in the conformation entropy. In addition, the oxygen atoms in these ethylene oxide units reside in the core of the helix surrounded by hydrophobic methylene groups40 due to the presence of packed antiparallel helical strands with opposing handedness. This leads to hydrophobic core development in the materials. The formation of PEO−urea α-complex crystals, on the other hand, brings more steric constraints as it comprises confined crystallization of PEO within the subnanometer urea channels, “ordering” of hydrogen-bonded urea groups with antiparallel β-sheet conformation on the walls of the channels. Similar to the “bulk” crystallization case, the acquirement of the (tgt)4 conformation in the ethylene oxide units in the confined helical PEO crystals (41-helix) also leads to a decrease in the conformation entropy. This is a relatively more substantial decrease since 41-helix is more squashed than 72- helix. The formation of hydrogen-bonded urea groups with antiparallel β-sheet conformation contributes to the reduction Figure 19. “Beads on a string” type morphology observed in PU-8- 100 along the multiple length scales as demonstrated by the AFM phase image with a scale bar of 500 nm. Macromolecules pubs.acs.org/Macromolecules Article https://doi.org/10.1021/acs.macromol.1c00596 Macromolecules 2021, 54, 4704−4725 4719
  • 17. of conformational entropy. Two mechanisms take place in the samples dried at 100 °C along with the “bulk” crystallization of PEO. Hence, the geometric confinement is, overall, more severe in these samples. The severity of steric constraints enables them to collapse to highly compact globular domains with large amounts of tightly packed secondary structures. This may be of interest in designing synthetic replica of certain proteins with specific internal architectures. As illustrated in Figure 20, we can create various morphologies containing distinctly different substructures based on the same basic building blocks solely by adjusting soft segment molecular weight and drying temperature. 3.6. Tensile Properties. Stress−strain curves of the PU copolymers are provided in Figure 21. PU-2-based samples display a well-defined elastomeric behavior while PU-5 and PU-8 based films show a typical elastoplastic behavior with a distinct initial elastic response followed by yielding, softening, hardening, and then failure. This is because the soft segment in PU-2 is completely amorphous and (due to its Tg) highly mobile at room temperature whereas it is semicrystalline in both PU-5 and PU-8. Significant differences are observed in the tensile behavior of homologous PUs regarding drying temperature. The drying at 100 °C results in dramatic improvements in mechanical properties of all the copolymers under investigated. The results obtained from tensile tests are summarized in Table 3. As compared to PU-2-60, PU-5-60, and PU-8-60, 276, 208, and 84% increases in elastic modulus (E), 13.6, 56.4, and 118% increases in ultimate tensile strength (σmax), 18.6, 31.3, and 63.8% increases in elongation at break (ε), and 93.6, 123, and 213% increases in toughness (W) are obtained in PU-2-100, PU-5-100, and PU-8-100, respectively. In line with this, yield strengths (σy) of PU-5-100 and PU-8-100 are 103 and 72% higher than those of PU-5-60 and PU-8-60, respectively. No distinct yield is observed for PU-2 based samples due to their well-defined elastomeric behavior. These enhancements that arise from the change in drying temperature are mainly attributed to the structural and morphological changes along the multiple length scales demonstrated in previous sections. More specifically, the hierarchical self-assembly of tightly packed secondary structures along the multiple length scales based on the confined crystallization of PEO chains in subnanometer urea Figure 20. Schematic representations of the morphologies and structures demonstrated here: (a) Nanoscale morphology of PU-2-60 whose microscale morphology is completely amorphous. (b−d) Microscale morphologies of PU-2-100 (b), PU-5-60 and PU-8-60 (c), and PU-5-100 and PU-8-100 (d). (e) Hierarchical self-assembly found in PU-5-100 and PU-8-100 along the multiple length scales. (f) Model network representation of the hierarchical structures formed in a single macromolecular PU domain. Macromolecules pubs.acs.org/Macromolecules Article https://doi.org/10.1021/acs.macromol.1c00596 Macromolecules 2021, 54, 4704−4725 4720
  • 18. channels in the samples dried at 100 °C is the main reason for notable increases in their mechanical properties as compared to those of the samples dried at 60 °C since this enables the structural elements involved in this hierarchical architecture to work cooperatively and maintain a homogeneous deformation state at each hierarchical level along the multiple length scales. This is because the formation of α-complex crystals ensures the confinement of key secondary structures and hence the hydrogen bonds. When confined, hydrogen bonds are deformed within a small region corresponding to the size of several bonds in which the deformation and rupture of hydrogen bonds are delocalized. The formation of α-complex crystals means a greatly increased density of hydrogen bonds and the formation of densely packed interlocking regions where hydrogen bonds act in the “confined” state (delocalized deformation) which ensures an effective load transfer between Figure 21. Expanded initial regions and complete stress−strain curves of the PU copolymers under investigation: (a, b) PU-2-60 vs PU-2-100, (c, d) PU-5-60 vs PU-5-100, and (e, f) PU-8-60 vs PU-8-100. E = elastic modulus; W = toughness (work to fracture). Table 3. Mechanical Properties of the PU Films Investigated sample E (MPa) σy (MPa) σmax (MPa) ε (%) W (MJ m−3 ) PU-2-60 5.1 ± 0.3 30.1 ± 1.1 1000 ± 64 94.0 ± 6.7 PU-2-100 19.2 ± 2.8 34.2 ± 1.6 1240 ± 48 182 ± 9.3 PU-5-60 145 ± 19 7.72 ± 0.8 28.7 ± 1.3 627 ± 51 103 ± 7.8 PU-5-100 447 ± 23 15.7 ± 1.1 44.9 ± 2.4 823 ± 42 230 ± 14 PU-8-60 370 ± 20 11.6 ± 0.7 24.4 ± 3.4 412 ± 33 67.2 ± 5.7 PU-8-100 683 ± 36 20.0 ± 0.4 53.2 ± 5.1 675 ± 27 210 ± 12 Macromolecules pubs.acs.org/Macromolecules Article https://doi.org/10.1021/acs.macromol.1c00596 Macromolecules 2021, 54, 4704−4725 4721
  • 19. the chains under tension. Densely packed hydrogen bonds in these crystalline regions eventually break and allow strands of secondary structures to slide, leading to the separation of smaller intact crystals. This markedly contributes to the strength, extensibility, and toughness. For PU-2, the geometric confinement is limited to the confinement of hydrogen bonds in α-complex crystals. Hence, from a mechanical point of view, the presence of α-complex crystals solely suggests a more robust elastomeric network for PU-2-based samples. The E, σmax, ε, and W of PU-2-100 are therefore higher than those of PU-2-60. However, the formation of α-complex crystals is even more important for PU-5 and PU-8 since it leads up to the geometric confinement of other structural elements, such as soft segment crystals (72- helix), changes the entire structural hierarchy along the multiple length scales, and hence influences each deformation regime under tension. In this case, the geometric confinement is not only limited to the confinement of hydrogen bonds in α- complex crystals. These nanocrystals, and hence 41-helices and β-sheets, along with helical soft segment crystals are also confined into the compact globular domains (Figure 19). At nanoscale, these compact globular domains (Figure 19) can be considered as the three-dimensional “composite” network of different secondary structures that stiff complex nanocrystals containing 41-helices and β-sheets embedded in a semicrystal- line matrix with 72-helices. Under tension, this three-dimen- sional “composite” network shows a distinct elastic response up to a yield point. At the yield, hydrogen bonds in relatively more disordered secondary structures in the matrix phase break and hence the materials undergoes a softening regime in which the semicrystalline matrix phase unfolds along the stretching direction. The softening is mainly due to the unravelling of hidden length unlocked as a result of the rupture of hydrogen bonds. This is then followed by a stiffening regime where the load is mainly transferred from a fully extended matrix phase to stiff complex nanocrystals whose plastic deformation eventually results in failure. At microscale, the geometric confinement along the multiple length scales leads to a microstructure that consists of homogeneously distributed small microcrystals and does not have sharp grain boundaries. This means that these micro- crystals are also in a confined state. This explains why PU-5- 100 and PU-8-100 have greater stiffness and strength compared to PU-5-60 and PU-8-60 which have a lot larger microcrystals and sharp grain boundries. Hence, the geometric confinement along the multiple length scales plays a key role in achieving remarkably enhanced stiffness, strength, extensibility, and toughness. 4. CONCLUSION Here we mainly conclude that geometric confinement governs stiffness, strength, extensibility, and toughness in sol-cast PU films. Soft segment molecular weight and drying temperature are demonstrated to be practical and effective design/ processing parameters to tune the severity of geometric confinement. This approach, i.e., tuning the severity of geometric confinement via simple parameters, can be utilized to produce advanced PU-based materials with well-defined hierarchical structures and desired functional properties and, hence, to address the challenge of attaining unprecedented combinations of stiffness, strength, extensibility, and toughness. In line with this main conclusion, several important findings may be highlighted as follows: • Governing mechanism behind the structure formation in the PU copolymers investigated displays significant variations depending on soft segment molecular weight and drying conditions. On one hand, phase mixing plays a key role for final morphology and associated properties of the PU-2 copolymer, when its sol-cast films are dried at 60 °C as demonstrated in PU-2-60. No notable confinement is observed for this sample. On the other hand, the structure formation is mainly driven by the confined crystallization of PEO chains in subnanometer urea channels, which gives rise to the formation of α- complex crystals, and the final morphology consists of “microphase-separated” clusters of these complex crystals at larger length scales, when they are dried at 100 °C as shown in PU-2-100. The geometric confinement is only limited to the primary and secondary structures forming the α-complex crystals. No confinement is observed at larger length scales. • For PU-5 and PU-8, bulk crystallization of the PEO soft segments controls the structure formation, and hence the final semicrystalline (spherulitic) morphology governs their structure−property relations when their sol-cast films are dried at 60 °C as demonstrated in PU- 5-60 and PU-8-60. The geometric confinement in these samples is only limited to the conformation of ethylene oxide units in the PEO crystals. There is no considerable confinement at larger length scales, especially at the microlevel. When they are dried at 100 °C, an elegant hierarchical self-assembly (spanning length scales from angstroms to micrometers) is observed as shown in PU- 5-100 and PU-8-100. The geometric confinement is of particular importance for this structural hierarchy responsible for a unique combination of mutually exclusive mechanical properties, i.e. stiffness, strength, extensibility, and toughness. The structure formation in these samples is driven by the confined crystallization of helical PEO chains in subnanometer urea channels and complemented by the “bulk” crystallization of PEO matrix phase and/or the microphase separation. In this case, the “bulk” crystallization of the PEO matrix phase also takes place in a confined space as due to the presence of α-complex crystals. However, we use the term “bulk” here to distinguish these two crystallization mechanisms from each other. In addition, the micro- phase separation here refers to the “separation” of the crystalline domains from the amorphous regions at larger length scales. Overall, these samples show severe geometric confinement. • The structural hierarchy demonstrated here contains synthetic replica of natural design motifs like helices, antiparallel β-sheets, and β-turns with dimensional features comparable to those found in native structures. Hence, our findings might be of interest in mimicking certain protein structures containing these design motifs. • In addition to the structural changes highlighted above, it should be noted that the increase in total crystallinity is also important for a better understanding of the significant variations in mechanical properties. Macromolecules pubs.acs.org/Macromolecules Article https://doi.org/10.1021/acs.macromol.1c00596 Macromolecules 2021, 54, 4704−4725 4722