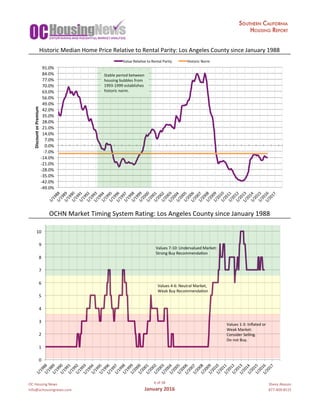
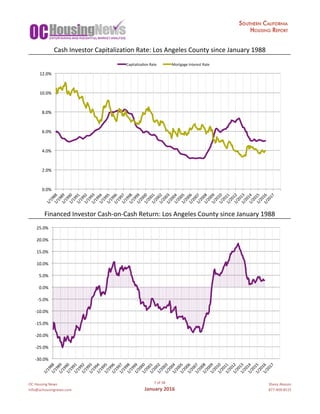
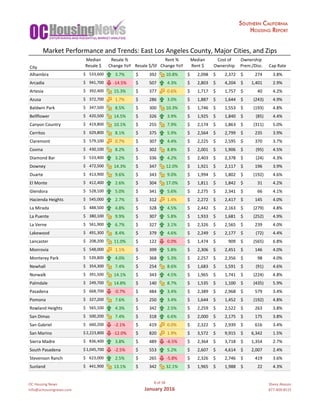
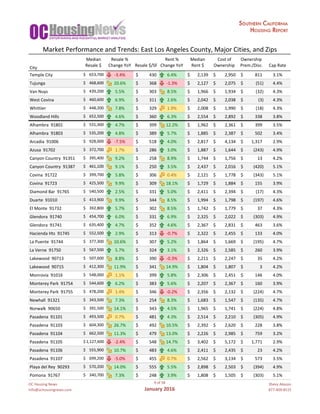
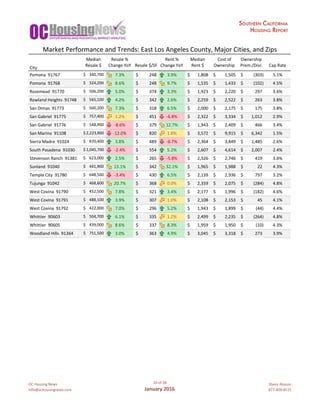
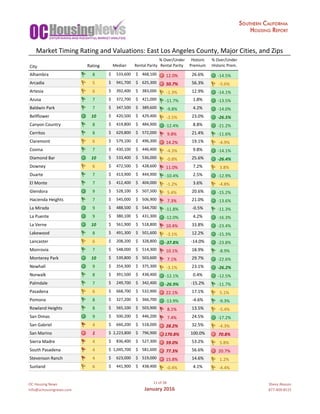
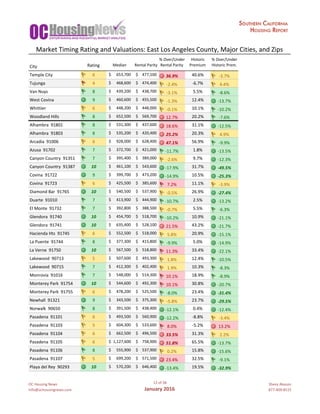
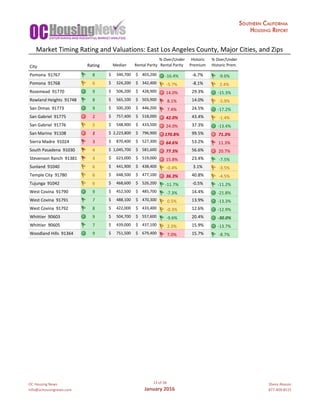
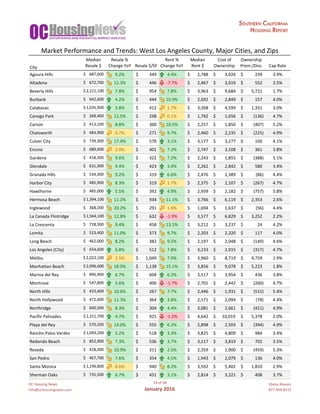
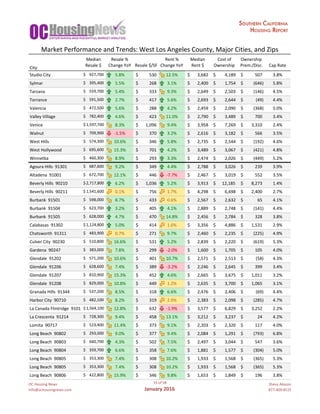
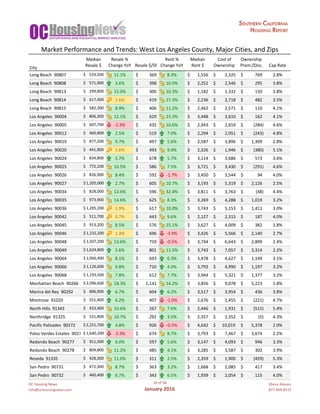
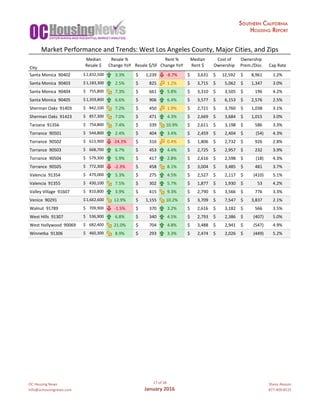
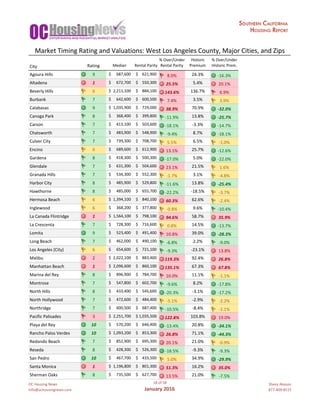
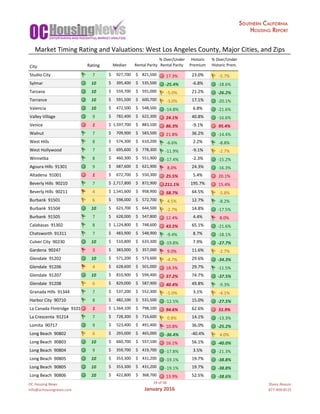
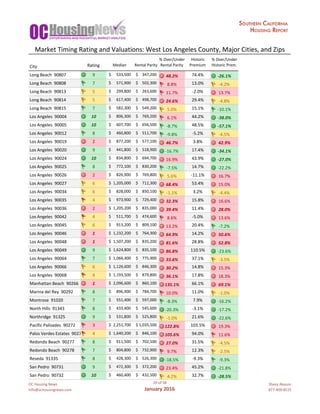
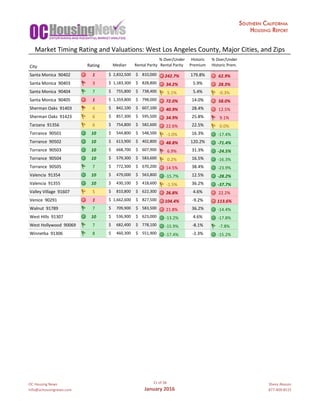
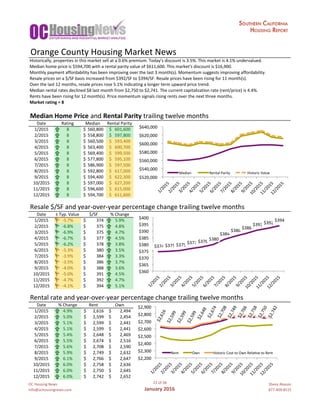
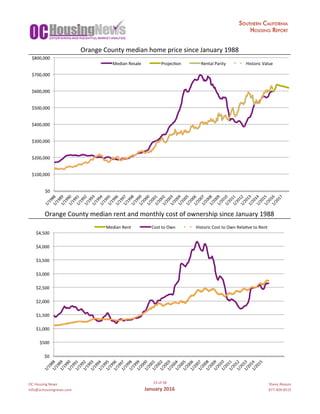
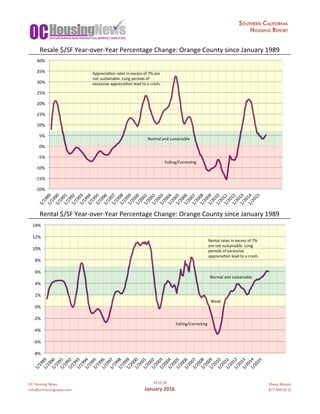
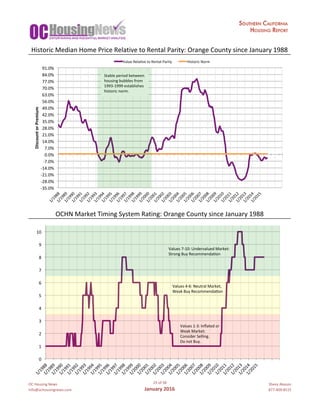
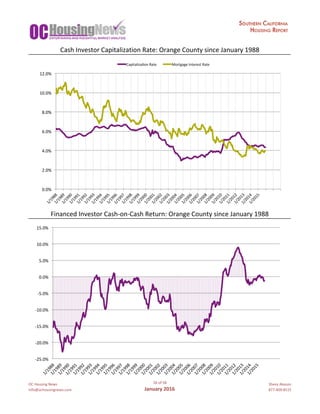
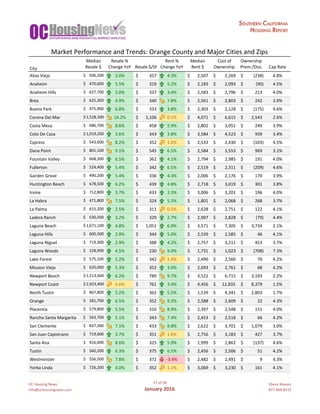
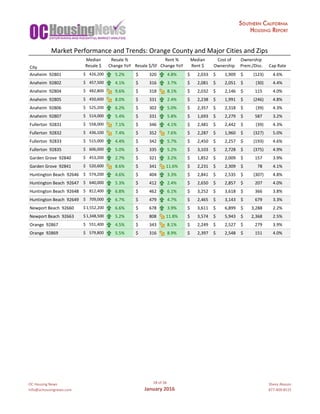
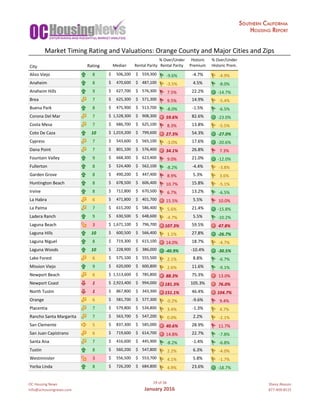
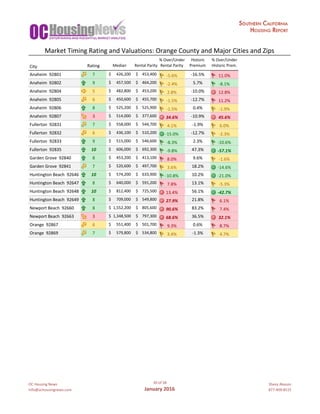
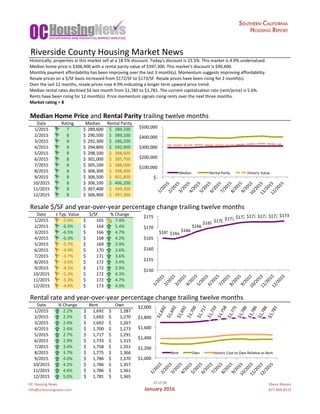
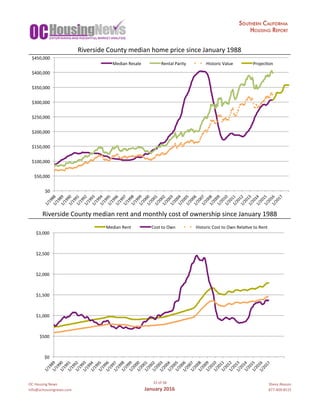
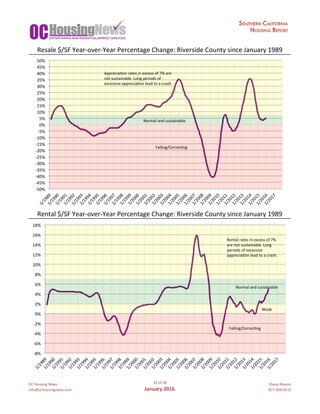
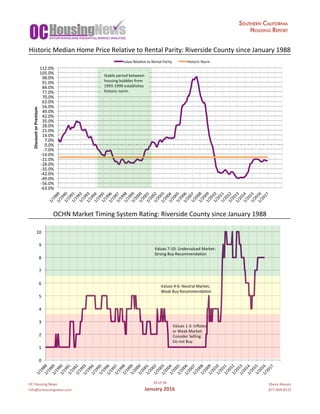
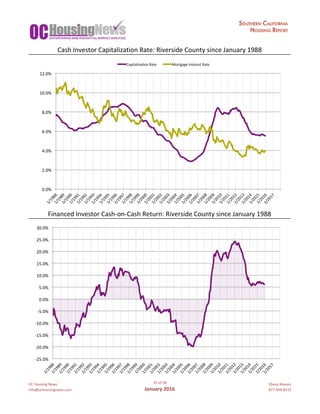
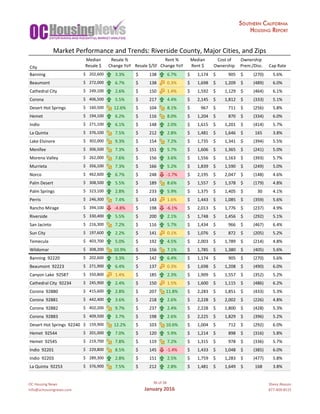
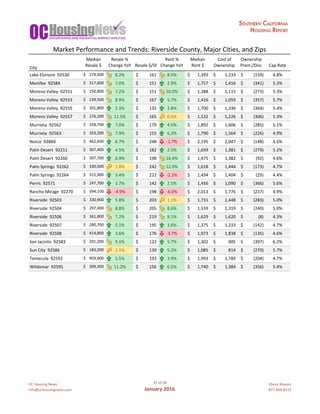
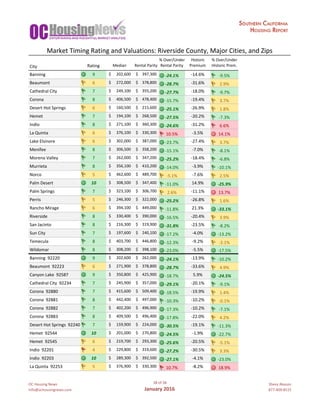
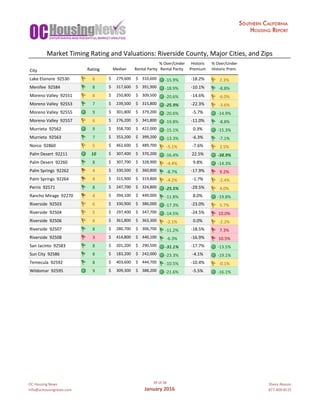
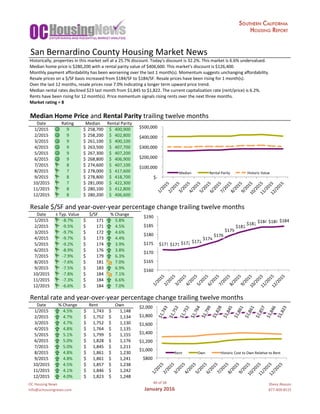
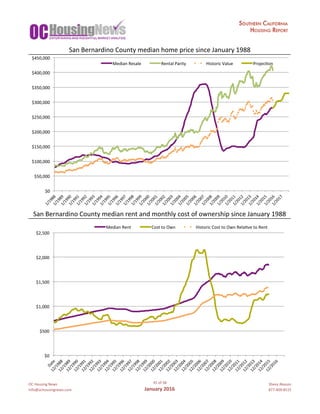
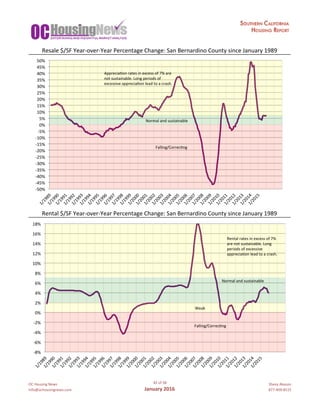
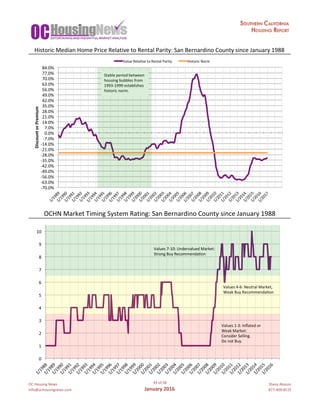
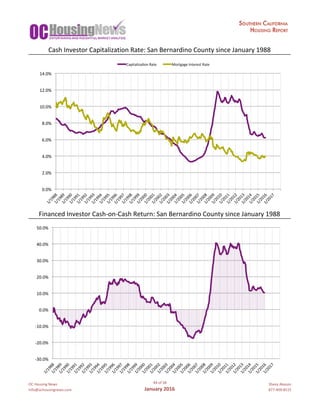
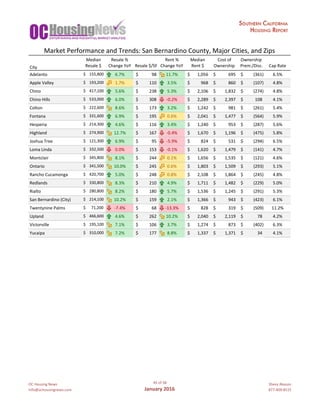
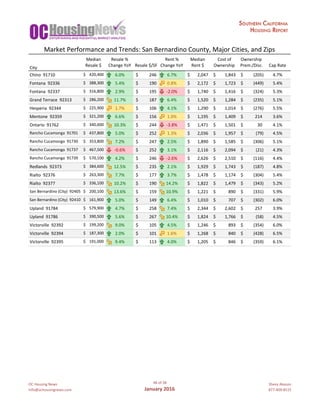
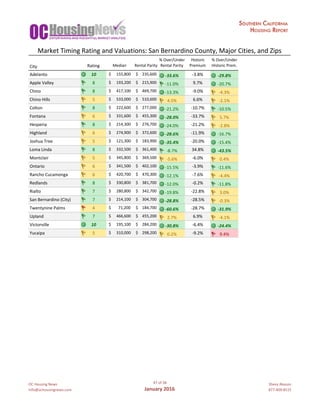
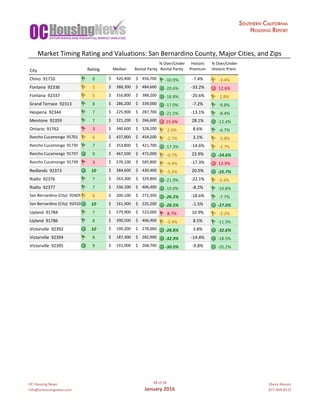
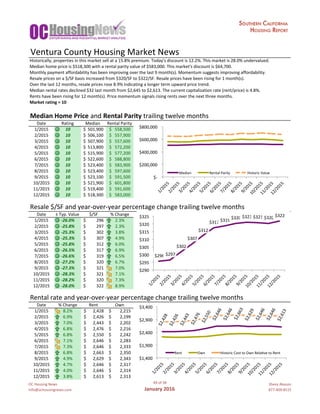
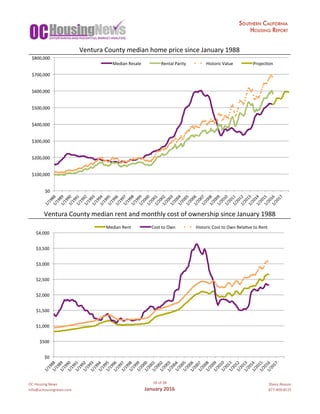
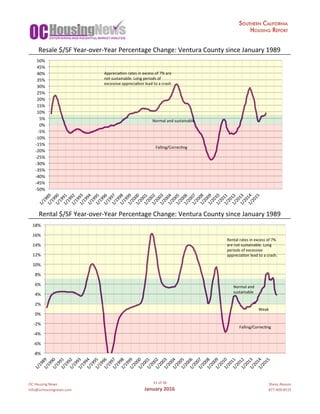
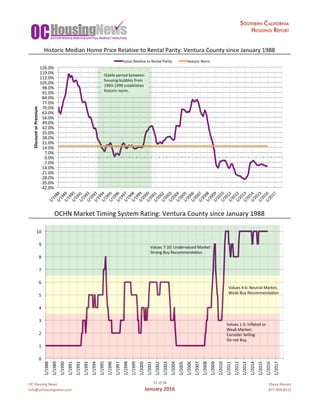
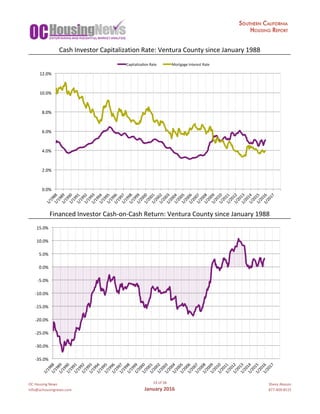
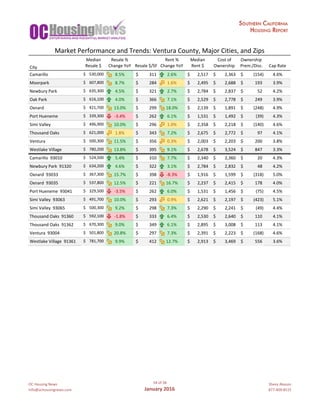
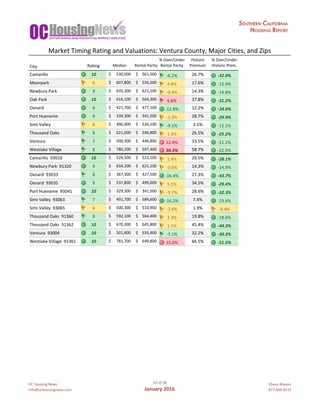
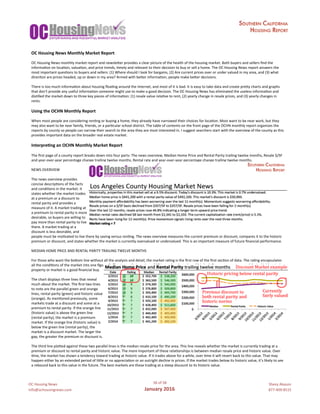
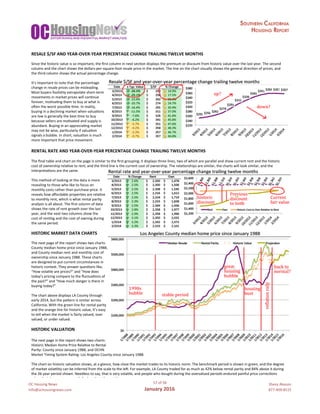
OC	Housing	News
info@ochousingnews.com
1	of	58
January	2016
Shevy	Akason
877-409-8515
2	..…	Meet	the	Everyday	Luxury	Real	Estate	Group	at	Evergreen	Realty
3	..…	Los	Angeles	County	Housing	Market	Overview
4	..…	Los	Angeles	County	Median	Home	Price	and	Rents
5	..…	Los	Angeles	County	Resale	and	rental	$/SF	Year-over-Year	Percentage	Change
6	..…	Los	Angeles	County	Historic	Valuation	and	Market	Timing	Rating
7	..…	Los	Angeles	County	Investor	Returns
8	..…	East	Los	Angeles	Market	Performance	and	Trends:	Ventura	County,	Major	Cities,	and	Zips
11	..…	East	Los	Angeles	Market	Timing	Rating	and	Valuations:	Ventura	County,	Major	Cities,	and	Zips
14	..…	West	Los	Angeles	Market	Performance	and	Trends:	Ventura	County,	Major	Cities,	and	Zips
18	..…	West	Los	Angeles	Market	Timing	Rating	and	Valuations:	Ventura	County,	Major	Cities,	and	Zips
22	..…	Orange	County	Housing	Market	Overview
23	..…	Orange	County	Median	Home	Price	and	Rents
24	..…	Orange	County	Resale	and	rental	$/SF	Year-over-Year	Percentage	Change
25	..…	Orange	County	Historic	Valuation	and	Market	Timing	Rating
26	..…	Orange	County	Investor	Returns
27	..…	Orange	County	Market	Performance	and	Trends:	Ventura	County,	Major	Cities,	and	Zips
29	..…	Orange	County	Market	Timing	Rating	and	Valuations:	Ventura	County,	Major	Cities,	and	Zips
31	..…	Riverside	County	Housing	Market	Overview
32	..…	Riverside	County	Median	Home	Price	and	Rents
33	..…	Riverside	County	Resale	and	rental	$/SF	Year-over-Year	Percentage	Change
34	..…	Riverside	County	Historic	Valuation	and	Market	Timing	Rating
35	..…	Riverside	County	Investor	Returns
36	..…	Riverside	County	Market	Performance	and	Trends:	Ventura	County,	Major	Cities,	and	Zips
38	..…	Riverside	County	Market	Timing	Rating	and	Valuations:	Ventura	County,	Major	Cities,	and	Zips
40	..…	San	Bernardino	County	Housing	Market	Overview 	
41	..…	San	Bernardino	County	Median	Home	Price	and	Rents
42	..…	San	Bernardino	County	Resale	and	rental	$/SF	Year-over-Year	Percentage	Change
43	..…	San	Bernardino	County	Historic	Valuation	and	Market	Timing	Rating
44	..…	San	Bernardino	County	Investor	Returns
45	..…	San	Bernardino	County	Market	Performance	and	Trends:	Ventura	County,	Major	Cities,	and	Zips
47	..…	San	Bernardino	County	Market	Timing	Rating	and	Values:	Ventura	County,	Major	Cities,	and	Zips
49	..…	Ventura	County	Housing	Market	Overview
50	..…	Ventura	County	Median	Home	Price	and	Rents
51	..…	Ventura	County	Resale	and	rental	$/SF	Year-over-Year	Percentage	Change
52	..…	Ventura	County	Historic	Valuation	and	Market	Timing	Rating
53	..…	Ventura	County	Investor	Returns
54	..…	Ventura	County	Market	Performance	and	Trends:	Ventura	County,	Major	Cities,	and	Zips
55	..…	Ventura	County	Market	Timing	Rating	and	Valuations:	Ventura	County,	Major	Cities,	and	Zips
Southern	California	Housing	Report
Table	of	Contents
OC	Housing	News
info@ochousingnews.com
2	of	58
January	2016
Shevy	Akason
877-409-8515
OC	Housing	News
info@ochousingnews.com
3	of	58
January	2016
Shevy	Akason
877-409-8515
Historically,	properties	in	this	market	sell	at	a	9.5%	discount.	Today's	discount	is	14.2%.	This	market	is	4.7%	undervalued.
Median	home	price	is	$507,300	with	a	rental	parity	value	of	$589,300.	This	market's	discount	is	$82,000.
Monthly	payment	affordability	has	been	improving	over	the	last	3	month(s).	Momentum	suggests	improving	affordability.
Resale	prices	on	a	$/SF	basis	increased	from	$407/SF	to	$409/SF.	Resale	prices	have	been	rising	for	10	month(s).
Over	the	last	12	months,	resale	prices	rose	5.4%	indicating	a	longer	term	upward	price	trend.
Median	rental	rates	increased	$8	last	month	from	$2,633	to	$2,641.	The	current	capitalization	rate	(rent/price)	is	5.0%.
Rents	have	been	rising	for	12	month(s).	Price	momentum	signals	rising	rents	over	the	next	three	months.
Market	rating	=	7
Median	Home	Price	and	Rental	Parity	trailing	twelve	months
Date Rating Median	 Rental	Parity Historic	Value
1/2015 7 469,300$			 569,000$				 514,855$			
2/2015 7 467,600$			 570,000$				 515,759$			
3/2015 8 470,100$			 567,700$				 513,678$			
4/2015 8 475,100$			 578,200$				 523,179$			
5/2015 7 484,300$			 571,900$				 517,479$			
6/2015 7 492,600$			 566,200$				 512,321$			
7/2015 8 501,000$			 567,000$				 513,045$			
8/2015 8 505,100$			 581,300$				 525,984$			
9/2015 8 508,100$			 588,300$				 532,318$			
10/2015 7 508,000$			 599,000$				 542,000$			
11/2015 7 508,800$			 588,900$				 532,861$			
12/2015 7 507,300$			 589,300$				 533,223$			
Resale	$/SF	and	year-over-year	percentage	change	trailing	twelve	months
Date ±	Typ.	Value $/SF %	Change
1/2015 -6.2% 388$											 8.7%
2/2015 -7.5% 382$											 7.1%
3/2015 -8.0% 383$											 7.1%
4/2015 -8.1% 387$											 7.6%
5/2015 -7.3% 391$											 7.6%
6/2015 -5.9% 395$											 7.6%
7/2015 -3.8% 398$											 6.6%
8/2015 -3.1% 400$											 4.8%
9/2015 -3.3% 403$											 4.4%
10/2015 -4.5% 406$											 4.8%
11/2015 -4.6% 407$											 4.9%
12/2015 -4.7% 409$											 5.4% -0.0951588
Rental	rate	and	year-over-year	percentage	change	trailing	twelve	months
Date %	Change Rent Own Historic	Cost	to	Own	Relative	to	Rent
1/2015 5.3% 2,474$							 2,087$									 2,239$								
2/2015 5.5% 2,478$							 2,054$									 2,242$								
3/2015 6.0% 2,487$							 2,044$									 2,250$								
4/2015 6.2% 2,502$							 2,049$									 2,264$								
5/2015 6.7% 2,527$							 2,085$									 2,286$								
6/2015 6.8% 2,544$							 2,136$									 2,302$								
7/2015 6.9% 2,569$							 2,208$									 2,325$								
8/2015 6.9% 2,590$							 2,245$									 2,344$								
9/2015 6.9% 2,615$							 2,260$									 2,366$								
10/2015 7.0% 2,633$							 2,247$									 2,383$								
11/2015 7.2% 2,633$							 2,255$									 2,383$								
12/2015 7.4% 2,642$							 2,261$									 2,390$								
Los	Angeles	County	Housing	Market	News
	$-		
	$200,000		
	$400,000		
	$600,000		
	$800,000		
1/2015	2/2015	3/2015	4/2015	5/2015	6/2015	7/2015	8/2015	9/2015	10/2015	11/2015	12/2015	
Median		 Rental	Parity	 Historic	Value	
	$388		
	$382			$383		
	$387		
	$391		
	$395		
	$398		
	$400		
	$403		
	$406			$407		
	$409		
$370	
$375	
$380	
$385	
$390	
$395	
$400	
$405	
$410	
$415	
1/2015	2/2015	3/2015	4/2015	5/2015	6/2015	7/2015	8/2015	9/2015	10/2015	11/2015	12/2015	
	$2,474		
	$2,478		
	$2,487		
	$2,502		
	$2,527		
	$2,544		
	$2,569		
	$2,590		
	$2,615		
	$2,633		
	$2,633		
	$2,642		
$1,800	
$2,000	
$2,200	
$2,400	
$2,600	
$2,800	
1/2015	2/2015	3/2015	4/2015	5/2015	6/2015	7/2015	8/2015	9/2015	10/2015	11/2015	12/2015	
Rent	 Own	 Historic	Cost	to	Own	Relagve	to	Rent
OC	Housing	News
info@ochousingnews.com
4	of	58
January	2016
Shevy	Akason
877-409-8515
Los	Angeles	County	median	home	price	since	January	1988
Los	Angeles	County	median	rent	and	monthly	cost	of	ownership	since	January	1988
$0	
$100,000	
$200,000	
$300,000	
$400,000	
$500,000	
$600,000	
$700,000	
1/1988	1/1989	1/1990	1/1991	1/1992	1/1993	1/1994	1/1995	1/1996	1/1997	1/1998	1/1999	1/2000	1/2001	1/2002	1/2003	1/2004	1/2005	1/2006	1/2007	1/2008	1/2009	1/2010	1/2011	1/2012	1/2013	1/2014	1/2015	1/2016	1/2017	
Median	Resale	 Rental	Parity	 Historic	Value	 Projecgon	
$0	
$500	
$1,000	
$1,500	
$2,000	
$2,500	
$3,000	
$3,500	
1/1988	1/1989	1/1990	1/1991	1/1992	1/1993	1/1994	1/1995	1/1996	1/1997	1/1998	1/1999	1/2000	1/2001	1/2002	1/2003	1/2004	1/2005	1/2006	1/2007	1/2008	1/2009	1/2010	1/2011	1/2012	1/2013	1/2014	1/2015	1/2016	1/2017	
Median	Rent	 Cost	to	Own	 Historic	Cost	to	Own	Relagve	to	Rent
OC	Housing	News
info@ochousingnews.com
5	of	58
January	2016
Shevy	Akason
877-409-8515
Resale	$/SF	Year-over-Year	Percentage	Change:	Los	Angeles	County	since	January	1989
Rental	$/SF	Year-over-Year	Percentage	Change:	Los	Angeles	County	since	January	1989
-8%	
-6%	
-4%	
-2%	
0%	
2%	
4%	
6%	
8%	
10%	
12%	
14%	
16%	
18%	
1/1989	1/1990	1/1991	1/1992	1/1993	1/1994	1/1995	1/1996	1/1997	1/1998	1/1999	1/2000	1/2001	1/2002	1/2003	1/2004	1/2005	1/2006	1/2007	1/2008	1/2009	1/2010	1/2011	1/2012	1/2013	1/2014	1/2015	1/2016	1/2017	
Normal	and	
sustainable	
Rental	rates	in	excess	of	7%	
are	not	sustainable.	Long	
periods	of	excessive	
appreciagon	lead	to	a	crash.	
Falling/Correcgng	
Weak	
-50%	
-45%	
-40%	
-35%	
-30%	
-25%	
-20%	
-15%	
-10%	
-5%	
0%	
5%	
10%	
15%	
20%	
25%	
30%	
35%	
40%	
45%	
50%	
1/1989	1/1990	1/1991	1/1992	1/1993	1/1994	1/1995	1/1996	1/1997	1/1998	1/1999	1/2000	1/2001	1/2002	1/2003	1/2004	1/2005	1/2006	1/2007	1/2008	1/2009	1/2010	1/2011	1/2012	1/2013	1/2014	1/2015	1/2016	1/2017	
Normal	and	sustainable	
Appreciagon	rates	in	excess	of	7%	are	
not	sustainable.	Long	periods	of	
excessive	appreciagon	lead	to	a	crash.	
Falling/Correcgng
OC	Housing	News
info@ochousingnews.com
6	of	58
January	2016
Shevy	Akason
877-409-8515
Historic	Median	Home	Price	Relative	to	Rental	Parity:	Los	Angeles	County	since	January	1988
OCHN	Market	Timing	System	Rating:	Los	Angeles	County	since	January	1988
-49.0%	
-42.0%	
-35.0%	
-28.0%	
-21.0%	
-14.0%	
-7.0%	
0.0%	
7.0%	
14.0%	
21.0%	
28.0%	
35.0%	
42.0%	
49.0%	
56.0%	
63.0%	
70.0%	
77.0%	
84.0%	
91.0%	
1/1988	1/1989	1/1990	1/1991	1/1992	1/1993	1/1994	1/1995	1/1996	1/1997	1/1998	1/1999	1/2000	1/2001	1/2002	1/2003	1/2004	1/2005	1/2006	1/2007	1/2008	1/2009	1/2010	1/2011	1/2012	1/2013	1/2014	1/2015	1/2016	1/2017	
Discount	or	Premium	
Value	Relagve	to	Rental	Parity	 Historic	Norm	
Stable	period	between	
housing	bubbles	from	
1993-1999	establishes	
historic	norm.	
0	
1	
2	
3	
4	
5	
6	
7	
8	
9	
10	
1/1988	1/1989	1/1990	1/1991	1/1992	1/1993	1/1994	1/1995	1/1996	1/1997	1/1998	1/1999	1/2000	1/2001	1/2002	1/2003	1/2004	1/2005	1/2006	1/2007	1/2008	1/2009	1/2010	1/2011	1/2012	1/2013	1/2014	1/2015	1/2016	1/2017	
Values	7-10:	Undervalued	Market:	
Strong	Buy	Recommendagon	
Values	4-6:	Neutral	Market,		
Weak	Buy	Recommendagon	
Values	1-3:	Inflated	or	
Weak	Market:	
Consider	Selling.		
Do	not	Buy.
OC	Housing	News
info@ochousingnews.com
7	of	58
January	2016
Shevy	Akason
877-409-8515
Cash	Investor	Capitalization	Rate:	Los	Angeles	County	since	January	1988
Financed	Investor	Cash-on-Cash	Return:	Los	Angeles	County	since	January	1988
0.0%	
2.0%	
4.0%	
6.0%	
8.0%	
10.0%	
12.0%	
1/1988	1/1989	1/1990	1/1991	1/1992	1/1993	1/1994	1/1995	1/1996	1/1997	1/1998	1/1999	1/2000	1/2001	1/2002	1/2003	1/2004	1/2005	1/2006	1/2007	1/2008	1/2009	1/2010	1/2011	1/2012	1/2013	1/2014	1/2015	1/2016	1/2017	
Capitalizagon	Rate	 Mortgage	Interest	Rate	
-30.0%	
-25.0%	
-20.0%	
-15.0%	
-10.0%	
-5.0%	
0.0%	
5.0%	
10.0%	
15.0%	
20.0%	
25.0%	
1/1988	1/1989	1/1990	1/1991	1/1992	1/1993	1/1994	1/1995	1/1996	1/1997	1/1998	1/1999	1/2000	1/2001	1/2002	1/2003	1/2004	1/2005	1/2006	1/2007	1/2008	1/2009	1/2010	1/2011	1/2012	1/2013	1/2014	1/2015	1/2016	1/2017
OC	Housing	News
info@ochousingnews.com
8	of	58
January	2016
Shevy	Akason
877-409-8515
Median Resale	% Rent	% Median Cost	of Ownership
City Resale	$ Change	YoY Resale	$/SF Change	YoY Rent	$ Ownership Prem./Disc. Cap	Rate
Alhambra		 533,600$					 3.7% 392$											 10.8% 2,098$								 2,372$									 274$												 3.8%
Arcadia		 941,700$					 -14.5% 507$											 4.3% 2,803$								 4,204$									 1,401$								 2.9%
Artesia		 392,400$					 15.3% 377$											 0.6% 1,717$								 1,757$									 40$														 4.2%
Azusa		 372,700$					 1.7% 286$											 3.0% 1,887$								 1,644$									 (243)$										 4.9%
Baldwin	Park		 347,500$					 8.5% 300$											 10.3% 1,746$								 1,553$									 (193)$										 4.8%
Bellflower		 420,500$					 14.5% 326$											 3.9% 1,925$								 1,840$									 (85)$												 4.4%
Canyon	Country		 419,800$					 10.1% 255$											 7.9% 2,174$								 1,863$									 (311)$										 5.0%
Cerritos		 629,800$					 8.1% 375$											 5.9% 2,564$								 2,799$									 235$												 3.9%
Claremont		 579,100$					 0.7% 307$											 4.4% 2,225$								 2,595$									 370$												 3.7%
Covina		 430,100$					 8.2% 302$											 8.8% 2,001$								 1,906$									 (95)$												 4.5%
Diamond	Bar		 533,400$					 3.2% 336$											 4.2% 2,403$								 2,378$									 (24)$												 4.3%
Downey		 472,500$					 14.3% 347$											 12.0% 1,921$								 2,117$									 196$												 3.9%
Duarte		 413,900$					 9.6% 343$											 9.0% 1,994$								 1,802$									 (192)$										 4.6%
El	Monte		 412,400$					 2.6% 304$											 17.0% 1,811$								 1,842$									 31$														 4.2%
Glendora		 528,100$					 5.0% 341$											 5.6% 2,275$								 2,341$									 66$														 4.1%
Hacienda	Heights		 545,000$					 2.7% 312$											 1.4% 2,272$								 2,417$									 145$												 4.0%
La	Mirada		 488,500$					 4.8% 328$											 4.5% 2,442$								 2,163$									 (279)$										 4.8%
La	Puente		 380,100$					 9.9% 307$											 5.8% 1,933$								 1,681$									 (252)$										 4.9%
La	Verne		 561,900$					 6.7% 327$											 3.1% 2,326$								 2,565$									 239$												 4.0%
Lakewood		 491,300$					 8.4% 379$											 4.6% 2,249$								 2,177$									 (72)$												 4.4%
Lancaster		 208,200$					 11.0% 122$											 0.0% 1,474$								 909$												 (565)$										 6.8%
Monrovia		 548,000$					 1.1% 399$											 5.8% 2,306$								 2,451$									 146$												 4.0%
Monterey	Park		 539,800$					 4.0% 368$											 5.3% 2,257$								 2,356$									 98$														 4.0%
Newhall		 354,300$					 7.4% 254$											 8.6% 1,683$								 1,591$									 (91)$												 4.6%
Norwalk		 391,500$					 14.1% 343$											 4.5% 1,965$								 1,741$									 (224)$										 4.8%
Palmdale		 249,700$					 14.8% 140$											 8.7% 1,535$								 1,100$									 (435)$										 5.9%
Pasadena		 668,700$					 -0.7% 484$											 3.4% 2,389$								 2,968$									 579$												 3.4%
Pomona		 327,200$					 7.6% 250$											 3.4% 1,644$								 1,452$									 (192)$										 4.8%
Rowland	Heights		 565,100$					 4.3% 342$											 2.5% 2,259$								 2,522$									 263$												 3.8%
San	Dimas		 500,200$					 7.4% 318$											 6.6% 2,000$								 2,175$									 175$												 3.8%
San	Gabriel		 660,200$					 -2.1% 419$											 0.0% 2,322$								 2,939$									 616$												 3.4%
San	Marino		 2,223,800$	 -12.0% 820$											 1.9% 3,572$								 9,915$									 6,342$								 1.5%
Sierra	Madre		 836,400$					 3.8% 489$											 -6.5% 2,364$								 3,718$									 1,354$								 2.7%
South	Pasadena		 1,045,700$	 -2.5% 553$											 5.2% 2,607$								 4,614$									 2,007$								 2.4%
Stevenson	Ranch		 623,000$					 2.5% 265$											 -5.8% 2,326$								 2,746$									 419$												 3.6%
Sunland		 441,900$					 13.1% 342$											 32.1% 1,965$								 1,988$									 22$														 4.3%
Market	Performance	and	Trends:	East	Los	Angeles	County,	Major	Cities,	and	Zips
OC	Housing	News
info@ochousingnews.com
9	of	58
January	2016
Shevy	Akason
877-409-8515
Median Resale	% Rent	% Median Cost	of Ownership
City
Resale	$ Change	YoY Resale	$/SF Change	YoY Rent	$ Ownership Prem./Disc. Cap	Rate
Temple	City		 653,700$					 -3.4% 430$											 6.4% 2,139$								 2,950$									 811$												 3.1%
Tujunga		 468,600$					 20.6% 368$											 -1.3% 2,127$								 2,075$									 (51)$												 4.4%
Van	Nuys		 439,200$					 5.5% 303$											 8.5% 1,966$								 1,934$									 (32)$												 4.3%
West	Covina		 460,600$					 6.9% 311$											 2.6% 2,042$								 2,038$									 (3)$														 4.3%
Whittier		 448,200$					 7.8% 329$											 1.9% 2,008$								 1,990$									 (18)$												 4.3%
Woodland	Hills		 652,500$					 4.6% 360$											 6.3% 2,554$								 2,892$									 338$												 3.8%
Alhambra		91801 531,300$					 4.7% 399$											 12.2% 1,962$								 2,361$									 399$												 3.5%
Alhambra		91803 535,200$					 4.8% 389$											 5.7% 1,885$								 2,387$									 502$												 3.4%
Arcadia		91006 928,000$					 -7.5% 518$											 4.0% 2,817$								 4,134$									 1,317$								 2.9%
Azusa		91702 372,700$					 1.7% 286$											 3.0% 1,887$								 1,644$									 (243)$										 4.9%
Canyon	Country		91351 395,400$					 9.2% 258$											 8.9% 1,744$								 1,756$									 13$														 4.2%
Canyon	Country		91387 461,100$					 9.1% 250$											 3.5% 2,437$								 2,016$									 (420)$										 5.1%
Covina		91722 399,700$					 5.8% 306$											 0.4% 2,121$								 1,778$									 (343)$										 5.1%
Covina		91723 425,500$					 9.9% 309$											 18.1% 1,729$								 1,884$									 155$												 3.9%
Diamond	Bar		91765 540,500$					 2.5% 331$											 5.0% 2,411$								 2,394$									 (17)$												 4.3%
Duarte		91010 413,900$					 9.9% 344$											 8.5% 1,994$								 1,798$									 (197)$										 4.6%
El	Monte		91732 392,800$					 5.7% 302$											 8.5% 1,742$								 1,779$									 37$														 4.3%
Glendora		91740 454,700$					 6.0% 331$											 6.9% 2,325$								 2,022$									 (303)$										 4.9%
Glendora		91741 635,400$					 4.7% 352$											 4.6% 2,367$								 2,831$									 463$												 3.6%
Hacienda	Hts		91745 552,500$					 2.9% 313$											 -0.7% 2,322$								 2,455$									 133$												 4.0%
La	Puente		91744 377,300$					 10.6% 307$											 5.2% 1,864$								 1,669$									 (195)$										 4.7%
La	Verne		91750 567,500$					 5.7% 324$											 3.1% 2,326$								 2,585$									 260$												 3.9%
Lakewood		90713 507,600$					 8.8% 390$											 -0.3% 2,211$								 2,247$									 35$														 4.2%
Lakewood		90715 412,300$					 11.9% 341$											 14.9% 1,804$								 1,807$									 3$																 4.2%
Monrovia		91016 548,000$					 1.1% 399$											 5.8% 2,306$								 2,451$									 146$												 4.0%
Monterey	Park		91754 544,600$					 6.2% 383$											 5.6% 2,207$								 2,367$									 160$												 3.9%
Monterey	Park		91755 478,200$					 1.4% 346$											 -0.2% 2,356$								 2,132$									 (224)$										 4.7%
Newhall		91321 343,500$					 7.3% 254$											 8.3% 1,683$								 1,547$									 (135)$										 4.7%
Norwalk		90650 391,500$					 14.1% 343$											 4.5% 1,965$								 1,741$									 (224)$										 4.8%
Pasadena		91101 493,500$					 0.7% 481$											 4.3% 2,514$								 2,210$									 (305)$										 4.9%
Pasadena		91103 604,300$					 26.7% 492$											 10.5% 2,392$								 2,620$									 228$												 3.8%
Pasadena		91104 662,500$					 11.3% 479$											 13.0% 2,226$								 2,985$									 759$												 3.2%
Pasadena		91105 1,127,600$	 -2.4% 548$											 14.7% 3,402$								 5,172$									 1,771$								 2.9%
Pasadena		91106 555,900$					 10.7% 483$											 4.6% 2,411$								 2,435$									 23$														 4.2%
Pasadena		91107 699,200$					 -5.0% 455$											 0.7% 2,562$								 3,134$									 573$												 3.5%
Playa	del	Rey		90293 570,200$					 14.0% 555$											 5.5% 2,898$								 2,503$									 (394)$										 4.9%
Pomona		91767 340,700$					 7.3% 248$											 3.9% 1,808$								 1,505$									 (303)$										 5.1%
Market	Performance	and	Trends:	East	Los	Angeles	County,	Major	Cities,	and	Zips
OC	Housing	News
info@ochousingnews.com
10	of	58
January	2016
Shevy	Akason
877-409-8515
Median Resale	% Rent	% Median Cost	of Ownership
City
Resale	$ Change	YoY Resale	$/SF Change	YoY Rent	$ Ownership Prem./Disc. Cap	Rate
Pomona		91767 340,700$					 7.3% 248$											 3.9% 1,808$								 1,505$									 (303)$										 5.1%
Pomona		91768 324,200$					 8.6% 248$											 9.7% 1,535$								 1,433$									 (102)$										 4.5%
Rosemead		91770 506,200$					 5.0% 374$											 3.3% 1,923$								 2,220$									 297$												 3.6%
Rowland	Heights		91748 565,100$					 4.2% 342$											 2.6% 2,259$								 2,522$									 263$												 3.8%
San	Dimas		91773 500,200$					 7.3% 318$											 6.5% 2,000$								 2,175$									 175$												 3.8%
San	Gabriel		91775 757,400$					 1.2% 451$											 -6.8% 2,322$								 3,334$									 1,012$								 2.9%
San	Gabriel		91776 548,900$					 -8.6% 379$											 12.7% 1,943$								 2,409$									 466$												 3.4%
San	Marino		91108 2,223,800$	 -12.0% 820$											 1.8% 3,572$								 9,915$									 6,342$								 1.5%
Sierra	Madre		91024 870,400$					 3.8% 489$											 -6.7% 2,364$								 3,849$									 1,485$								 2.6%
South	Pasadena		91030 1,045,700$	 -2.4% 554$											 5.2% 2,607$								 4,614$									 2,007$								 2.4%
Stevenson	Ranch		91381 623,000$					 2.5% 265$											 -5.8% 2,326$								 2,746$									 419$												 3.6%
Sunland		91040 441,900$					 13.1% 342$											 32.1% 1,965$								 1,988$									 22$														 4.3%
Temple	City		91780 648,500$					 -3.4% 430$											 6.5% 2,139$								 2,936$									 797$												 3.2%
Tujunga		91042 468,600$					 20.7% 368$											 0.0% 2,359$								 2,075$									 (284)$										 4.8%
West	Covina		91790 452,500$					 7.8% 321$											 3.4% 2,177$								 1,996$									 (182)$										 4.6%
West	Covina		91791 488,100$					 3.9% 307$											 1.0% 2,108$								 2,153$									 45$														 4.1%
West	Covina		91792 422,000$					 7.0% 296$											 5.2% 1,943$								 1,899$									 (44)$												 4.4%
Whittier		90603 504,700$					 6.1% 335$											 1.2% 2,499$								 2,235$									 (264)$										 4.8%
Whittier		90605 439,000$					 8.6% 337$											 8.3% 1,959$								 1,950$									 (10)$												 4.3%
Woodland	Hills		91364 751,500$					 3.0% 363$											 4.9% 3,045$								 3,318$									 273$												 3.9%
Market	Performance	and	Trends:	East	Los	Angeles	County,	Major	Cities,	and	Zips
OC	Housing	News
info@ochousingnews.com
11	of	58
January	2016
Shevy	Akason
877-409-8515
%	Over/Under Historic %	Over/Under
City Rating Median Rental	Parity Rental	Parity Premium Historic	Prem.
Alhambra		 8 533,600$						 468,100$					 12.0% 26.6% -14.5%
Arcadia		 5 941,700$						 625,300$					 50.7% 56.3% -5.6%
Artesia		 6 392,400$						 383,000$					 -1.3% 12.9% -14.1%
Azusa		 7 372,700$						 421,000$					 -11.7% 1.8% -13.5%
Baldwin	Park		 7 347,500$						 389,600$					 -9.8% 4.2% -14.0%
Bellflower		 10 420,500$						 429,400$					 -3.5% 23.0% -26.5%
Canyon	Country		 8 419,800$						 484,900$					 -12.4% 8.8% -21.2%
Cerritos		 8 629,800$						 572,000$					 9.8% 21.4% -11.6%
Claremont		 6 579,100$						 496,300$					 14.2% 19.1% -4.9%
Covina		 7 430,100$						 446,400$					 -4.3% 9.8% -14.1%
Diamond	Bar		 10 533,400$						 536,000$					 -0.8% 25.6% -26.4%
Downey		 6 472,500$						 428,600$					 11.0% 7.2% 3.8%
Duarte		 7 413,900$						 444,900$					 -10.4% 2.5% -12.9%
El	Monte		 7 412,400$						 404,000$					 -1.2% 3.6% -4.8%
Glendora		 9 528,100$						 507,500$					 5.4% 20.6% -15.2%
Hacienda	Heights		 7 545,000$						 506,900$					 7.3% 21.0% -13.6%
La	Mirada		 9 488,500$						 544,700$					 -11.8% -0.5% -11.3%
La	Puente		 9 380,100$						 431,300$					 -12.0% 4.2% -16.3%
La	Verne		 10 561,900$						 518,800$					 10.4% 33.8% -23.4%
Lakewood		 8 491,300$						 501,600$					 -3.1% 12.2% -15.3%
Lancaster		 6 208,200$						 328,800$					 -37.8% -14.0% -23.8%
Monrovia		 7 548,000$						 514,300$					 10.1% 18.9% -8.9%
Monterey	Park		 10 539,800$						 503,600$					 7.1% 29.7% -22.6%
Newhall		 9 354,300$						 375,300$					 -3.1% 23.1% -26.2%
Norwalk		 8 391,500$						 438,400$					 -12.1% 0.4% -12.5%
Palmdale		 7 249,700$						 342,400$					 -26.9% -15.2% -11.7%
Pasadena		 6 668,700$						 532,900$					 22.1% 17.1% 5.1%
Pomona		 8 327,200$						 366,700$					 -13.9% -4.6% -9.3%
Rowland	Heights		 8 565,100$						 503,900$					 8.1% 13.5% -5.4%
San	Dimas		 9 500,200$						 446,200$					 7.4% 24.5% -17.2%
San	Gabriel		 4 660,200$						 518,000$					 28.2% 32.5% -4.3%
San	Marino		 1 2,223,800$			 796,900$					 170.8% 100.0% 70.8%
Sierra	Madre		 4 836,400$						 527,300$					 59.0% 53.2% 5.8%
South	Pasadena		 4 1,045,700$			 581,600$					 77.3% 56.6% 20.7%
Stevenson	Ranch		 4 623,000$						 519,000$					 15.8% 14.6% 1.2%
Sunland		 6 441,900$						 438,400$					 -0.4% 4.1% -4.4%
Market	Timing	Rating	and	Valuations:	East	Los	Angeles	County,	Major	Cities,	and	Zips
OC	Housing	News
info@ochousingnews.com
12	of	58
January	2016
Shevy	Akason
877-409-8515
%	Over/Under Historic %	Over/Under
City Rating Median Rental	Parity Rental	Parity Premium Historic	Prem.
Temple	City		 6 653,700$						 477,100$					 36.9% 40.6% -3.7%
Tujunga		 4 468,600$						 474,400$					 -2.4% -6.7% 4.4%
Van	Nuys		 8 439,200$						 438,700$					 -3.1% 5.5% -8.6%
West	Covina		 9 460,600$						 455,500$					 -1.3% 12.4% -13.7%
Whittier		 6 448,200$						 448,000$					 -0.1% 10.1% -10.2%
Woodland	Hills		 8 652,500$						 569,700$					 12.7% 20.2% -7.6%
Alhambra		91801 8 531,300$						 437,600$					 18.6% 31.1% -12.5%
Alhambra		91803 8 535,200$						 420,400$					 25.2% 20.3% 4.9%
Arcadia		91006 6 928,000$						 628,400$					 47.1% 56.9% -9.9%
Azusa		91702 7 372,700$						 421,000$					 -11.7% 1.8% -13.5%
Canyon	Country		91351 7 395,400$						 389,000$					 -2.6% 9.7% -12.3%
Canyon	Country		91387 10 461,100$						 543,600$					 -17.9% 31.7% -49.5%
Covina		91722 9 399,700$						 473,200$					 -14.9% 10.5% -25.3%
Covina		91723 6 425,500$						 385,600$					 7.2% 11.1% -3.9%
Diamond	Bar		91765 10 540,500$						 537,900$					 -0.5% 26.9% -27.4%
Duarte		91010 7 413,900$						 444,900$					 -10.7% 2.5% -13.2%
El	Monte		91732 7 392,800$						 388,500$					 -0.7% 5.5% -6.3%
Glendora		91740 10 454,700$						 518,700$					 -10.2% 10.9% -21.1%
Glendora		91741 10 635,400$						 528,100$					 21.5% 43.2% -21.7%
Hacienda	Hts		91745 6 552,500$						 518,000$					 5.8% 20.9% -15.1%
La	Puente		91744 8 377,300$						 415,800$					 -9.9% 5.0% -14.9%
La	Verne		91750 10 567,500$						 518,800$					 11.3% 33.4% -22.1%
Lakewood		90713 5 507,600$						 493,300$					 1.8% 12.4% -10.5%
Lakewood		90715 7 412,300$						 402,400$					 1.9% 10.3% -8.3%
Monrovia		91016 7 548,000$						 514,300$					 10.1% 18.9% -8.9%
Monterey	Park		91754 10 544,600$						 492,300$					 10.1% 30.8% -20.7%
Monterey	Park		91755 6 478,200$						 525,500$					 -8.0% 23.4% -31.4%
Newhall		91321 9 343,500$						 375,300$					 -5.8% 23.7% -29.5%
Norwalk		90650 8 391,500$						 438,400$					 -12.1% 0.4% -12.4%
Pasadena		91101 6 493,500$						 560,900$					 -12.2% -8.8% -3.4%
Pasadena		91103 5 604,300$						 533,600$					 8.0% -5.2% 13.2%
Pasadena		91104 6 662,500$						 496,500$					 33.5% 31.3% 2.2%
Pasadena		91105 6 1,127,600$			 758,900$					 51.8% 65.5% -13.7%
Pasadena		91106 8 555,900$						 537,900$					 0.2% 15.8% -15.6%
Pasadena		91107 5 699,200$						 571,500$					 23.4% 32.5% -9.1%
Playa	del	Rey		90293 10 570,200$						 646,400$					 -13.4% 19.5% -32.9%
Market	Timing	Rating	and	Valuations:	East	Los	Angeles	County,	Major	Cities,	and	Zips
OC	Housing	News
info@ochousingnews.com
13	of	58
January	2016
Shevy	Akason
877-409-8515
%	Over/Under Historic %	Over/Under
City Rating Median Rental	Parity Rental	Parity Premium Historic	Prem.
Pomona		91767 8 340,700$						 403,200$					 -16.4% -6.7% -9.6%
Pomona		91768 6 324,200$						 342,400$					 -5.7% -8.1% 2.4%
Rosemead		91770 9 506,200$						 428,900$					 14.0% 29.3% -15.3%
Rowland	Heights		91748 8 565,100$						 503,900$					 8.1% 14.0% -5.9%
San	Dimas		91773 9 500,200$						 446,200$					 7.4% 24.5% -17.2%
San	Gabriel		91775 2 757,400$						 518,000$					 42.0% 43.4% -1.4%
San	Gabriel		91776 5 548,900$						 433,500$					 24.0% 37.3% -13.4%
San	Marino		91108 1 2,223,800$			 796,900$					 170.8% 99.5% 71.3%
Sierra	Madre		91024 3 870,400$						 527,300$					 64.6% 53.2% 11.3%
South	Pasadena		91030 4 1,045,700$			 581,600$					 77.3% 56.6% 20.7%
Stevenson	Ranch		91381 4 623,000$						 519,000$					 15.8% 23.4% -7.5%
Sunland		91040 6 441,900$						 438,400$					 -0.4% 3.1% -3.5%
Temple	City		91780 6 648,500$						 477,100$					 36.3% 40.8% -4.5%
Tujunga		91042 6 468,600$						 526,200$					 -11.7% -0.5% -11.2%
West	Covina		91790 9 452,500$						 485,700$					 -7.3% 14.4% -21.8%
West	Covina		91791 7 488,100$						 470,300$					 0.5% 13.9% -13.3%
West	Covina		91792 8 422,000$						 433,400$					 -0.3% 12.6% -12.9%
Whittier		90603 9 504,700$						 557,600$					 -9.6% 20.4% -30.0%
Whittier		90605 7 439,000$						 437,100$					 2.3% 15.9% -13.7%
Woodland	Hills		91364 9 751,500$						 679,400$					 7.0% 15.7% -8.7%
Market	Timing	Rating	and	Valuations:	East	Los	Angeles	County,	Major	Cities,	and	Zips
OC	Housing	News
info@ochousingnews.com
14	of	58
January	2016
Shevy	Akason
877-409-8515
Median Resale	% Rent	% Median Cost	of Ownership
City Resale	$ Change	YoY Resale	$/SF Change	YoY Rent	$ Ownership Prem./Disc. Cap	Rate
Agoura	Hills		 687,600$					 9.2% 349$											 4.4% 2,788$								 3,026$									 239$												 3.9%
Altadena		 672,700$					 12.3% 446$											 -7.7% 2,467$								 3,019$									 552$												 3.5%
Beverly	Hills		 2,211,100$	 7.8% 954$											 7.8% 3,963$								 9,684$									 5,721$								 1.7%
Burbank		 642,600$					 4.2% 444$											 10.9% 2,692$								 2,849$									 157$												 4.0%
Calabasas		 1,035,900$	 5.8% 412$											 1.7% 3,268$								 4,599$									 1,331$								 3.0%
Canoga	Park		 368,400$					 12.5% 298$											 0.1% 1,792$								 1,656$									 (136)$										 4.7%
Carson		 413,100$					 8.8% 300$											 10.5% 2,257$								 1,850$									 (407)$										 5.2%
Chatsworth		 483,900$					 0.7% 271$											 9.7% 2,460$								 2,235$									 (225)$										 4.9%
Culver	City		 739,300$					 17.4% 578$											 3.1% 3,177$								 3,277$									 100$												 4.1%
Encino		 689,600$					 2.0% 401$											 7.2% 2,747$								 3,108$									 361$												 3.8%
Gardena		 418,300$					 9.6% 322$											 7.2% 2,243$								 1,855$									 (388)$										 5.1%
Glendale		 631,300$					 9.4% 423$											 3.4% 2,262$								 2,842$									 580$												 3.4%
Granada	Hills		 534,300$					 9.2% 319$											 6.6% 2,476$								 2,389$									 (86)$												 4.4%
Harbor	City		 485,900$					 8.3% 319$											 1.7% 2,375$								 2,107$									 (267)$										 4.7%
Hawthorne		 485,000$					 5.5% 392$											 4.9% 2,939$								 2,182$									 (757)$										 5.8%
Hermosa	Beach		 1,394,100$	 11.2% 934$											 11.1% 3,766$								 6,119$									 2,353$								 2.6%
Inglewood		 368,200$					 20.2% 291$											 1.6% 1,694$								 1,637$									 (56)$												 4.4%
La	Canada	Flintridge		 1,564,100$	 12.8% 632$											 -1.9% 3,577$								 6,829$									 3,252$								 2.2%
La	Crescenta		 728,300$					 9.4% 458$											 13.1% 3,212$								 3,237$									 24$														 4.2%
Lomita		 523,400$					 11.0% 373$											 9.7% 2,203$								 2,320$									 117$												 4.0%
Long	Beach		 462,000$					 8.2% 382$											 9.5% 2,197$								 2,048$									 (149)$										 4.6%
Los	Angeles	(City)		 654,600$					 6.8% 512$											 7.8% 3,233$								 2,915$									 (317)$										 4.7%
Malibu		 2,022,100$	 1.5% 1,049$								 7.0% 3,960$								 8,719$									 4,759$								 1.9%
Manhattan	Beach		 2,096,600$	 18.0% 1,138$								 15.1% 3,856$								 9,078$									 5,223$								 1.8%
Marina	del	Rey		 896,900$					 6.7% 604$											 6.2% 3,517$								 3,954$									 436$												 3.8%
Montrose		 547,800$					 5.6% 406$											 -1.7% 2,701$								 2,442$									 (260)$										 4.7%
North	Hills		 433,400$					 10.6% 267$											 7.7% 2,446$								 1,931$									 (515)$										 5.4%
North	Hollywood		 472,600$					 11.3% 364$											 3.8% 2,171$								 2,094$									 (78)$												 4.4%
Northridge		 600,500$					 8.3% 304$											 4.4% 3,081$								 2,661$									 (421)$										 4.9%
Pacific	Palisades		 2,251,700$	 4.7% 925$											 -1.2% 4,642$								 10,019$							 5,378$								 2.0%
Playa	del	Rey		 570,200$					 14.0% 555$											 6.2% 2,898$								 2,503$									 (394)$										 4.9%
Rancho	Palos	Verdes		 1,093,200$	 5.2% 518$											 3.3% 3,825$								 4,809$									 984$												 3.4%
Redondo	Beach		 852,900$					 7.3% 536$											 3.7% 3,117$								 3,819$									 702$												 3.5%
Reseda		 428,300$					 10.9% 311$											 2.5% 2,359$								 1,900$									 (459)$										 5.3%
San	Pedro		 467,700$					 7.6% 354$											 4.5% 1,943$								 2,079$									 136$												 4.0%
Santa	Monica		 1,196,800$	 0.6% 940$											 8.2% 3,592$								 5,402$									 1,810$								 2.9%
Sherman	Oaks		 735,500$					 6.7% 451$											 3.1% 2,814$								 3,221$									 408$												 3.7%
Market	Performance	and	Trends:	West	Los	Angeles	County,	Major	Cities,	and	Zips
OC	Housing	News
info@ochousingnews.com
15	of	58
January	2016
Shevy	Akason
877-409-8515
Median Resale	% Rent	% Median Cost	of Ownership
City
Resale	$ Change	YoY Resale	$/SF Change	YoY Rent	$ Ownership Prem./Disc. Cap	Rate
Studio	City		 927,700$					 5.8% 530$											 12.5% 3,682$								 4,189$									 507$												 3.8%
Sylmar		 395,400$					 5.5% 268$											 3.1% 2,400$								 1,754$									 (646)$										 5.8%
Tarzana		 559,700$					 5.4% 333$											 9.3% 2,649$								 2,503$									 (146)$										 4.5%
Torrance		 591,500$					 2.7% 417$											 5.6% 2,693$								 2,644$									 (49)$												 4.4%
Valencia		 472,500$					 5.6% 288$											 4.2% 2,459$								 2,090$									 (368)$										 5.0%
Valley	Village		 782,400$					 4.6% 423$											 11.0% 2,790$								 3,489$									 700$												 3.4%
Venice		 1,597,700$	 8.3% 1,096$								 9.4% 3,958$								 7,269$									 3,310$								 2.4%
Walnut		 709,900$					 -1.5% 370$											 3.2% 2,616$								 3,182$									 566$												 3.5%
West	Hills		 574,300$					 10.6% 346$											 5.8% 2,735$								 2,544$									 (192)$										 4.6%
West	Hollywood		 695,600$					 15.3% 701$											 4.2% 3,489$								 3,067$									 (421)$										 4.8%
Winnetka		 460,300$					 8.9% 293$											 3.3% 2,474$								 2,026$									 (449)$										 5.2%
Agoura	Hills		91301 687,600$					 9.2% 349$											 4.4% 2,788$								 3,026$									 239$												 3.9%
Altadena		91001 672,700$					 12.1% 446$											 -7.7% 2,467$								 3,019$									 552$												 3.5%
Beverly	Hills		90210 2,717,800$	 6.2% 1,036$								 5.2% 3,913$								 12,185$							 8,273$								 1.4%
Beverly	Hills		90211 1,541,600$	 0.1% 756$											 1.7% 4,298$								 6,698$									 2,400$								 2.7%
Burbank		91501 598,000$					 8.7% 433$											 0.6% 2,567$								 2,632$									 65$														 4.1%
Burbank		91504 623,700$					 3.2% 405$											 4.1% 2,889$								 2,748$									 (141)$										 4.4%
Burbank		91505 628,000$					 4.7% 470$											 14.8% 2,456$								 2,784$									 328$												 3.8%
Calabasas		91302 1,124,800$	 5.0% 414$											 1.6% 3,356$								 4,886$									 1,531$								 2.9%
Chatsworth		91311 483,900$					 0.7% 271$											 9.7% 2,460$								 2,235$									 (225)$										 4.9%
Culver	City		90230 510,800$					 16.6% 531$											 5.2% 2,839$								 2,220$									 (619)$										 5.3%
Gardena		90247 383,000$					 7.8% 299$											 -2.0% 1,600$								 1,705$									 105$												 4.0%
Glendale		91202 571,200$					 10.6% 401$											 10.7% 2,571$								 2,513$									 (58)$												 4.3%
Glendale		91206 628,600$					 7.4% 389$											 -3.2% 2,246$								 2,645$									 399$												 3.4%
Glendale		91207 810,900$					 15.3% 452$											 4.6% 2,665$								 3,675$									 1,011$								 3.2%
Glendale		91208 829,000$					 10.8% 449$											 1.2% 2,635$								 3,700$									 1,065$								 3.1%
Granada	Hills		91344 537,200$					 8.5% 318$											 6.6% 2,476$								 2,406$									 (69)$												 4.4%
Harbor	City		90710 482,100$					 8.2% 319$											 2.0% 2,383$								 2,098$									 (285)$										 4.7%
La	Canada	Flintridge		91011 1,564,100$	 12.8% 632$											 -1.9% 3,577$								 6,829$									 3,252$								 2.2%
La	Crescenta		91214 728,300$					 9.4% 458$											 13.1% 3,212$								 3,237$									 24$														 4.2%
Lomita		90717 523,400$					 11.4% 373$											 9.1% 2,203$								 2,320$									 117$												 4.0%
Long	Beach		90802 293,000$					 9.0% 377$											 9.4% 2,084$								 1,291$									 (793)$										 6.8%
Long	Beach		90803 660,700$					 4.3% 502$											 7.5% 2,497$								 3,044$									 547$												 3.6%
Long	Beach		90804 359,700$					 6.6% 358$											 7.6% 1,881$								 1,577$									 (304)$										 5.0%
Long	Beach		90805 353,300$					 7.4% 308$											 10.2% 1,933$								 1,568$									 (365)$										 5.3%
Long	Beach		90806 422,800$					 15.9% 346$											 9.8% 1,653$								 1,849$									 196$												 3.8%
Market	Performance	and	Trends:	West	Los	Angeles	County,	Major	Cities,	and	Zips
OC	Housing	News
info@ochousingnews.com
16	of	58
January	2016
Shevy	Akason
877-409-8515
Median Resale	% Rent	% Median Cost	of Ownership
City
Resale	$ Change	YoY Resale	$/SF Change	YoY Rent	$ Ownership Prem./Disc. Cap	Rate
Long	Beach		90807 533,500$					 11.1% 369$											 8.3% 1,556$								 2,325$									 769$												 2.8%
Long	Beach		90808 571,900$					 3.6% 398$											 10.0% 2,252$								 2,546$									 295$												 3.8%
Long	Beach		90813 299,800$					 15.0% 300$											 10.3% 1,182$								 1,332$									 150$												 3.8%
Long	Beach		90814 617,400$					 1.6% 419$											 27.3% 2,236$								 2,718$									 482$												 3.5%
Long	Beach		90815 582,300$					 8.9% 406$											 11.2% 2,462$								 2,571$									 110$												 4.1%
Los	Angeles		90004 806,300$					 12.1% 629$											 23.3% 3,448$								 3,610$									 162$												 4.1%
Los	Angeles		90005 607,700$					 -2.3% 435$											 10.6% 2,943$								 2,659$									 (284)$										 4.6%
Los	Angeles		90012 460,800$					 2.5% 519$											 7.0% 2,294$								 2,051$									 (243)$										 4.8%
Los	Angeles		90019 877,200$					 9.7% 497$											 5.6% 2,587$								 3,896$									 1,309$								 2.8%
Los	Angeles		90020 441,800$					 1.6% 493$											 9.0% 2,326$								 1,946$									 (380)$										 5.1%
Los	Angeles		90024 834,800$					 5.7% 678$											 5.7% 3,114$								 3,686$									 573$												 3.6%
Los	Angeles		90025 772,100$					 10.5% 586$											 7.5% 3,721$								 3,430$									 (291)$										 4.6%
Los	Angeles		90026 826,900$					 8.4% 592$											 -1.7% 3,450$								 3,544$									 94$														 4.0%
Los	Angeles		90027 1,205,000$	 2.7% 605$											 10.7% 3,193$								 5,319$									 2,126$								 2.5%
Los	Angeles		90034 828,000$					 12.6% 596$											 32.4% 3,811$								 3,763$									 (48)$												 4.4%
Los	Angeles		90035 973,900$					 14.6% 625$											 8.3% 3,269$								 4,288$									 1,019$								 3.2%
Los	Angeles		90036 1,205,200$	 1.9% 617$											 10.0% 3,743$								 5,153$									 1,411$								 3.0%
Los	Angeles		90042 511,700$					 0.7% 443$											 9.6% 2,127$								 2,315$									 187$												 4.0%
Los	Angeles		90045 913,200$					 8.5% 576$											 15.1% 3,627$								 4,009$									 382$												 3.8%
Los	Angeles		90046 1,232,200$	 1.3% 696$											 -3.9% 3,426$								 5,566$									 2,140$								 2.7%
Los	Angeles		90048 1,507,200$	 13.6% 759$											 -0.5% 3,744$								 6,643$									 2,899$								 2.4%
Los	Angeles		90049 1,624,800$	 5.6% 801$											 11.5% 3,743$								 7,057$									 3,314$								 2.2%
Los	Angeles		90064 1,066,400$	 8.1% 693$											 6.3% 3,478$								 4,627$									 1,149$								 3.1%
Los	Angeles		90066 1,126,600$	 9.8% 710$											 4.0% 3,793$								 4,990$									 1,197$								 3.2%
Los	Angeles		90068 1,193,500$	 7.8% 612$											 7.7% 3,944$								 5,321$									 1,377$								 3.2%
Manhattan	Beach		90266 2,096,600$	 18.3% 1,141$								 14.2% 3,856$								 9,078$									 5,223$								 1.8%
Marina	del	Rey		90292 896,900$					 6.7% 604$											 6.2% 3,517$								 3,954$									 436$												 3.8%
Montrose		91020 551,400$					 6.2% 407$											 -1.0% 2,676$								 2,455$									 (221)$										 4.7%
North	Hills		91343 433,400$					 10.6% 267$											 7.6% 2,446$								 1,931$									 (515)$										 5.4%
Northridge		91325 531,800$					 10.7% 292$											 3.5% 2,357$								 2,352$									 (5)$														 4.3%
Pacific	Palisades		90272 2,251,700$	 4.8% 926$											 -0.5% 4,642$								 10,019$							 5,378$								 2.0%
Palos	Verdes	Estates		90274 1,640,200$	 -2.3% 674$											 8.7% 3,793$								 7,467$									 3,674$								 2.2%
Redondo	Beach		90277 911,500$					 6.0% 597$											 5.6% 3,147$								 4,093$									 946$												 3.3%
Redondo	Beach		90278 804,800$					 11.2% 485$											 4.1% 3,285$								 3,587$									 302$												 3.9%
Reseda		91335 428,300$					 11.0% 311$											 2.5% 2,359$								 1,900$									 (459)$										 5.3%
San	Pedro		90731 472,300$					 8.7% 363$											 3.2% 1,668$								 2,085$									 417$												 3.4%
San	Pedro		90732 460,400$					 6.7% 343$											 6.5% 1,939$								 2,054$									 115$												 4.0%
Market	Performance	and	Trends:	West	Los	Angeles	County,	Major	Cities,	and	Zips
OC	Housing	News
info@ochousingnews.com
17	of	58
January	2016
Shevy	Akason
877-409-8515
Median Resale	% Rent	% Median Cost	of Ownership
City
Resale	$ Change	YoY Resale	$/SF Change	YoY Rent	$ Ownership Prem./Disc. Cap	Rate
Santa	Monica		90402 2,832,500$	 3.3% 1,239$								 -8.7% 3,631$								 12,592$							 8,961$								 1.2%
Santa	Monica		90403 1,183,300$	 2.5% 825$											 1.2% 3,715$								 5,062$									 1,347$								 3.0%
Santa	Monica		90404 755,800$					 7.3% 661$											 5.8% 3,310$								 3,505$									 196$												 4.2%
Santa	Monica		90405 1,359,800$	 6.6% 906$											 6.4% 3,577$								 6,153$									 2,576$								 2.5%
Sherman	Oaks		91403 842,100$					 7.2% 450$											 1.9% 2,721$								 3,760$									 1,038$								 3.1%
Sherman	Oaks		91423 857,300$					 7.0% 471$											 4.3% 2,669$								 3,684$									 1,015$								 3.0%
Tarzana		91356 754,800$					 7.4% 339$											 10.9% 2,611$								 3,198$									 586$												 3.3%
Torrance		90501 544,800$					 2.4% 404$											 3.4% 2,459$								 2,404$									 (54)$												 4.3%
Torrance		90502 613,900$					 -24.3% 316$											 0.4% 1,806$								 2,732$									 926$												 2.8%
Torrance		90503 668,700$					 6.7% 453$											 4.4% 2,725$								 2,957$									 232$												 3.9%
Torrance		90504 579,300$					 5.9% 417$											 2.8% 2,616$								 2,598$									 (18)$												 4.3%
Torrance		90505 772,300$					 -2.3% 458$											 8.1% 3,004$								 3,485$									 481$												 3.7%
Valencia		91354 479,000$					 5.3% 275$											 4.5% 2,527$								 2,117$									 (410)$										 5.1%
Valencia		91355 430,100$					 7.5% 302$											 5.7% 1,877$								 1,930$									 53$														 4.2%
Valley	Village		91607 810,800$					 3.9% 415$											 9.3% 2,790$								 3,566$									 776$												 3.3%
Venice		90291 1,662,600$	 12.9% 1,155$								 10.2% 3,709$								 7,547$									 3,837$								 2.1%
Walnut		91789 709,900$					 -1.5% 370$											 3.2% 2,616$								 3,182$									 566$												 3.5%
West	Hills		91307 536,900$					 6.8% 340$											 4.5% 2,793$								 2,386$									 (407)$										 5.0%
West	Hollywood		90069 682,400$					 21.0% 704$											 4.8% 3,488$								 2,941$									 (547)$										 4.9%
Winnetka		91306 460,300$					 8.9% 293$											 3.3% 2,474$								 2,026$									 (449)$										 5.2%
Market	Performance	and	Trends:	West	Los	Angeles	County,	Major	Cities,	and	Zips
OC	Housing	News
info@ochousingnews.com
18	of	58
January	2016
Shevy	Akason
877-409-8515
%	Over/Under Historic %	Over/Under
City Rating Median Rental	Parity Rental	Parity Premium Historic	Prem.
Agoura	Hills		 9 687,600$						 621,900$					 8.0% 24.3% -16.3%
Altadena		 1 672,700$						 550,300$					 25.5% 5.4% 20.1%
Beverly	Hills		 6 2,211,100$			 884,100$					 143.6% 136.7% 6.9%
Burbank		 7 642,600$						 600,500$					 7.4% 3.5% 3.9%
Calabasas		 9 1,035,900$			 729,000$					 38.9% 70.9% -32.0%
Canoga	Park		 8 368,400$						 399,800$					 -11.9% 13.8% -25.7%
Carson		 7 413,100$						 503,600$					 -18.1% -3.3% -14.7%
Chatsworth		 7 483,900$						 548,900$					 -9.4% 8.7% -18.1%
Culver	City		 7 739,300$						 708,700$					 5.5% 6.5% -1.0%
Encino		 6 689,600$						 612,900$					 13.1% 25.7% -12.6%
Gardena		 8 418,300$						 500,300$					 -17.0% 5.0% -22.0%
Glendale		 7 631,300$						 504,600$					 23.1% 21.5% 1.6%
Granada	Hills		 7 534,300$						 552,300$					 -1.7% 3.1% -4.8%
Harbor	City		 8 485,900$						 529,800$					 -11.6% 13.8% -25.4%
Hawthorne		 8 485,000$						 655,700$					 -22.2% -18.5% -3.7%
Hermosa	Beach		 6 1,394,100$			 840,100$					 60.3% 62.6% -2.4%
Inglewood		 6 368,200$						 377,800$					 -0.8% 9.6% -10.4%
La	Canada	Flintridge		 1 1,564,100$			 798,100$					 94.6% 58.7% 35.9%
La	Crescenta		 7 728,300$						 716,600$					 0.8% 14.5% -13.7%
Lomita		 9 523,400$						 491,400$					 10.8% 39.0% -28.3%
Long	Beach		 7 462,000$						 490,100$					 -6.8% 2.2% -9.0%
Los	Angeles	(City)		 6 654,600$						 721,100$					 -9.3% -23.1% 13.8%
Malibu		 2 2,022,100$			 883,400$					 119.3% 92.4% 26.8%
Manhattan	Beach		 1 2,096,600$			 860,100$					 135.1% 67.3% 67.8%
Marina	del	Rey		 8 896,900$						 784,700$					 10.0% 11.1% -1.1%
Montrose		 7 547,800$						 602,700$					 -9.6% 8.2% -17.8%
North	Hills		 8 433,400$						 545,600$					 -20.3% -3.1% -17.2%
North	Hollywood		 7 472,600$						 484,400$					 -5.1% -2.9% -2.2%
Northridge		 7 600,500$						 687,400$					 -10.5% -8.4% -2.1%
Pacific	Palisades		 3 2,251,700$			 1,035,500$		 122.8% 103.8% 19.0%
Playa	del	Rey		 10 570,200$						 646,400$					 -13.4% 20.8% -34.1%
Rancho	Palos	Verdes		 10 1,093,200$			 853,300$					 26.8% 71.1% -44.3%
Redondo	Beach		 7 852,900$						 695,300$					 20.1% 21.0% -0.9%
Reseda		 8 428,300$						 526,300$					 -18.5% -9.3% -9.3%
San	Pedro		 10 467,700$						 433,500$					 5.0% 34.9% -29.9%
Santa	Monica		 1 1,196,800$			 801,300$					 51.3% 16.2% 35.0%
Sherman	Oaks		 8 735,500$						 627,700$					 13.5% 21.0% -7.5%
Market	Timing	Rating	and	Valuations:	West	Los	Angeles	County,	Major	Cities,	and	Zips
OC	Housing	News
info@ochousingnews.com
19	of	58
January	2016
Shevy	Akason
877-409-8515
%	Over/Under Historic %	Over/Under
City Rating Median Rental	Parity Rental	Parity Premium Historic	Prem.
Studio	City		 7 927,700$						 821,500$					 17.3% 23.0% -5.7%
Sylmar		 10 395,400$						 535,500$					 -25.4% -6.8% -18.6%
Tarzana		 10 559,700$						 591,000$					 -5.0% 21.2% -26.2%
Torrance		 10 591,500$						 600,700$					 -3.0% 17.1% -20.1%
Valencia		 10 472,500$						 548,500$					 -14.8% 6.8% -21.6%
Valley	Village		 9 782,400$						 622,300$					 24.1% 40.8% -16.6%
Venice		 1 1,597,700$			 883,100$					 86.3% -9.1% 95.4%
Walnut		 7 709,900$						 583,500$					 21.8% 36.2% -14.4%
West	Hills		 8 574,300$						 610,200$					 -6.6% 2.2% -8.8%
West	Hollywood		 7 695,600$						 778,300$					 -11.9% -9.1% -2.7%
Winnetka		 8 460,300$						 551,900$					 -17.4% -2.3% -15.2%
Agoura	Hills		91301 9 687,600$						 621,900$					 8.0% 24.3% -16.3%
Altadena		91001 1 672,700$						 550,300$					 25.5% 5.4% 20.1%
Beverly	Hills		90210 7 2,717,800$			 872,900$					 211.1% 195.7% 15.4%
Beverly	Hills		90211 4 1,541,600$			 958,900$					 58.7% 64.5% -5.8%
Burbank		91501 6 598,000$						 572,700$					 4.5% 12.7% -8.2%
Burbank		91504 10 623,700$						 644,500$					 -2.7% 14.8% -17.5%
Burbank		91505 7 628,000$						 547,800$					 12.4% 4.4% 8.0%
Calabasas		91302 8 1,124,800$			 748,600$					 43.5% 65.1% -21.6%
Chatsworth		91311 7 483,900$						 548,900$					 -9.4% 8.7% -18.1%
Culver	City		90230 10 510,800$						 633,300$					 -19.8% 7.9% -27.7%
Gardena		90247 3 383,000$						 357,000$					 9.0% 11.6% -2.7%
Glendale		91202 10 571,200$						 573,600$					 -4.7% 29.6% -34.3%
Glendale		91206 4 628,600$						 501,000$					 18.3% 29.7% -11.5%
Glendale		91207 10 810,900$						 594,400$					 37.2% 74.7% -37.5%
Glendale		91208 6 829,000$						 587,900$					 40.4% 49.8% -9.3%
Granada	Hills		91344 7 537,200$						 552,300$					 -1.0% 3.1% -4.1%
Harbor	City		90710 8 482,100$						 531,500$					 -12.5% 15.0% -27.5%
La	Canada	Flintridge		91011 1 1,564,100$			 798,100$					 94.6% 62.6% 31.9%
La	Crescenta		91214 7 728,300$						 716,600$					 0.8% 14.1% -13.3%
Lomita		90717 9 523,400$						 491,400$					 10.8% 36.0% -25.2%
Long	Beach		90802 6 293,000$						 465,000$					 -36.4% -40.4% 4.0%
Long	Beach		90803 10 660,700$						 557,100$					 16.1% 56.1% -40.0%
Long	Beach		90804 9 359,700$						 419,700$					 -17.8% 3.5% -21.3%
Long	Beach		90805 10 353,300$						 431,200$					 -19.1% 19.7% -38.8%
Long	Beach		90806 10 422,800$						 368,700$					 13.9% 52.5% -38.6%
Market	Timing	Rating	and	Valuations:	West	Los	Angeles	County,	Major	Cities,	and	Zips
OC	Housing	News
info@ochousingnews.com
20	of	58
January	2016
Shevy	Akason
877-409-8515
%	Over/Under Historic %	Over/Under
City Rating Median Rental	Parity Rental	Parity Premium Historic	Prem.
Long	Beach		90807 9 533,500$						 347,200$					 48.2% 74.4% -26.1%
Long	Beach		90808 7 571,900$						 502,300$					 8.8% 13.0% -4.2%
Long	Beach		90813 5 299,800$						 263,600$					 11.7% -2.0% 13.7%
Long	Beach		90814 5 617,400$						 498,700$					 24.6% 29.4% -4.8%
Long	Beach		90815 7 582,300$						 549,200$					 5.0% 15.1% -10.1%
Los	Angeles		90004 10 806,300$						 769,200$					 6.1% 44.2% -38.0%
Los	Angeles		90005 10 607,700$						 656,500$					 -8.7% 48.5% -57.1%
Los	Angeles		90012 8 460,800$						 511,700$					 -9.8% -5.2% -4.5%
Los	Angeles		90019 2 877,200$						 577,100$					 46.7% 3.8% 42.9%
Los	Angeles		90020 9 441,800$						 518,900$					 -16.7% 17.4% -34.1%
Los	Angeles		90024 10 834,800$						 694,700$					 16.9% 43.9% -27.0%
Los	Angeles		90025 8 772,100$						 830,200$					 -7.5% 14.7% -22.2%
Los	Angeles		90026 2 826,900$						 769,800$					 5.6% -11.1% 16.7%
Los	Angeles		90027 6 1,205,000$			 712,300$					 68.4% 53.4% 15.0%
Los	Angeles		90034 6 828,000$						 850,100$					 -1.1% 3.2% -4.4%
Los	Angeles		90035 4 973,900$						 729,400$					 32.3% 15.8% 16.6%
Los	Angeles		90036 2 1,205,200$			 835,000$					 39.4% 11.4% 28.0%
Los	Angeles		90042 4 511,700$						 474,600$					 8.6% -5.0% 13.6%
Los	Angeles		90045 6 913,200$						 809,100$					 13.2% 20.4% -7.2%
Los	Angeles		90046 1 1,232,200$			 764,300$					 64.9% 14.2% 50.6%
Los	Angeles		90048 1 1,507,200$			 835,200$					 81.6% 28.8% 52.8%
Los	Angeles		90049 9 1,624,800$			 835,100$					 86.8% 110.5% -23.6%
Los	Angeles		90064 7 1,066,400$			 775,900$					 33.6% 37.1% -3.5%
Los	Angeles		90066 6 1,126,600$			 846,300$					 30.2% 14.8% 15.3%
Los	Angeles		90068 4 1,193,500$			 879,800$					 36.1% 17.8% 18.3%
Manhattan	Beach		90266 1 2,096,600$			 860,100$					 135.1% 66.1% 69.1%
Marina	del	Rey		90292 8 896,900$						 784,700$					 10.0% 11.0% -1.0%
Montrose		91020 7 551,400$						 597,000$					 -8.3% 7.9% -16.2%
North	Hills		91343 8 433,400$						 545,600$					 -20.3% -3.1% -17.2%
Northridge		91325 9 531,800$						 525,800$					 -1.0% 21.6% -22.6%
Pacific	Palisades		90272 3 2,251,700$			 1,035,500$		 122.8% 103.5% 19.3%
Palos	Verdes	Estates		90274 4 1,640,200$			 846,100$					 105.6% 94.0% 11.6%
Redondo	Beach		90277 8 911,500$						 702,100$					 27.0% 31.5% -4.5%
Redondo	Beach		90278 7 804,800$						 732,900$					 9.7% 12.3% -2.5%
Reseda		91335 8 428,300$						 526,300$					 -18.5% -9.3% -9.3%
San	Pedro		90731 9 472,300$						 372,200$					 23.4% 45.2% -21.8%
San	Pedro		90732 10 460,400$						 432,500$					 4.2% 32.7% -28.5%
Market	Timing	Rating	and	Valuations:	West	Los	Angeles	County,	Major	Cities,	and	Zips
OC	Housing	News
info@ochousingnews.com
21	of	58
January	2016
Shevy	Akason
877-409-8515
%	Over/Under Historic %	Over/Under
City Rating Median Rental	Parity Rental	Parity Premium Historic	Prem.
Santa	Monica		90402 1 2,832,500$			 810,000$					 242.7% 179.8% 62.9%
Santa	Monica		90403 3 1,183,300$			 828,800$					 34.2% 5.9% 28.3%
Santa	Monica		90404 7 755,800$						 738,400$					 5.1% 5.4% -0.3%
Santa	Monica		90405 1 1,359,800$			 798,000$					 72.0% 14.0% 58.0%
Sherman	Oaks		91403 4 842,100$						 607,100$					 40.9% 28.4% 12.5%
Sherman	Oaks		91423 6 857,300$						 595,500$					 34.9% 25.8% 9.1%
Tarzana		91356 6 754,800$						 582,600$					 22.6% 22.5% 0.0%
Torrance		90501 10 544,800$						 548,500$					 -1.0% 16.3% -17.4%
Torrance		90502 10 613,900$						 402,800$					 48.8% 120.2% -71.4%
Torrance		90503 10 668,700$						 607,900$					 6.9% 31.3% -24.5%
Torrance		90504 10 579,300$						 583,600$					 0.2% 16.5% -16.3%
Torrance		90505 7 772,300$						 670,200$					 14.5% 38.4% -23.9%
Valencia		91354 10 479,000$						 563,800$					 -15.7% 12.5% -28.2%
Valencia		91355 10 430,100$						 418,600$					 -1.5% 36.2% -37.7%
Valley	Village		91607 5 810,800$						 622,300$					 26.8% 4.6% 22.2%
Venice		90291 1 1,662,600$			 827,500$					 104.4% -9.2% 113.6%
Walnut		91789 7 709,900$						 583,500$					 21.8% 36.2% -14.4%
West	Hills		91307 10 536,900$						 623,000$					 -13.2% 4.6% -17.8%
West	Hollywood		90069 7 682,400$						 778,100$					 -15.9% -8.1% -7.8%
Winnetka		91306 8 460,300$						 551,900$					 -17.4% -2.3% -15.2%
Market	Timing	Rating	and	Valuations:	West	Los	Angeles	County,	Major	Cities,	and	Zips
OC	Housing	News
info@ochousingnews.com
22	of	58
January	2016
Shevy	Akason
877-409-8515
Historically,	properties	in	this	market	sell	at	a	0.6%	premium.	Today's	discount	is	3.5%.	This	market	is	4.1%	undervalued.
Median	home	price	is	$594,700	with	a	rental	parity	value	of	$611,600.	This	market's	discount	is	$16,900.
Monthly	payment	affordability	has	been	improving	over	the	last	3	month(s).	Momentum	suggests	improving	affordability.
Resale	prices	on	a	$/SF	basis	increased	from	$392/SF	to	$394/SF.	Resale	prices	have	been	rising	for	11	month(s).
Over	the	last	12	months,	resale	prices	rose	5.1%	indicating	a	longer	term	upward	price	trend.
Median	rental	rates	declined	$8	last	month	from	$2,750	to	$2,741.	The	current	capitalization	rate	(rent/price)	is	4.4%.
Rents	have	been	rising	for	12	month(s).	Price	momentum	signals	rising	rents	over	the	next	three	months.
Market	rating	=	8
Median	Home	Price	and	Rental	Parity	trailing	twelve	months
Date Rating Median	 Rental	Parity Historic	Value
1/2015 8 560,800$			 601,600$				 605,294$			
2/2015 8 558,800$			 597,800$				 601,470$			
3/2015 8 560,500$			 593,400$				 597,043$			
4/2015 8 563,400$			 600,700$				 604,388$			
5/2015 8 569,400$			 599,500$				 603,181$			
6/2015 8 577,800$			 595,100$				 598,754$			
7/2015 8 586,900$			 597,500$				 601,169$			
8/2015 8 592,800$			 617,000$				 620,788$			
9/2015 8 594,400$			 622,300$				 626,121$			
10/2015 8 597,000$			 627,200$				 631,051$			
11/2015 8 596,600$			 615,000$				 618,776$			
12/2015 8 594,700$			 611,600$				 615,355$			
Resale	$/SF	and	year-over-year	percentage	change	trailing	twelve	months
Date ±	Typ.	Value $/SF %	Change
1/2015 -5.7% 374$											 5.9%
2/2015 -6.8% 375$											 4.8%
3/2015 -6.9% 375$											 4.7%
4/2015 -6.7% 377$											 4.5%
5/2015 -6.2% 378$											 3.8%
6/2015 -5.3% 380$											 3.5%
7/2015 -3.9% 384$											 3.3%
8/2015 -3.5% 386$											 3.7%
9/2015 -4.0% 388$											 3.6%
10/2015 -5.0% 391$											 4.5%
11/2015 -4.7% 392$											 4.7%
12/2015 -4.1% 394$											 5.1% 0.00613984
Rental	rate	and	year-over-year	percentage	change	trailing	twelve	months
Date %	Change Rent Own Historic	Cost	to	Own	Relative	to	Rent
1/2015 4.9% 2,616$							 2,494$									 2,632$								
2/2015 5.0% 2,599$							 2,454$									 2,615$								
3/2015 5.1% 2,599$							 2,441$									 2,615$								
4/2015 5.1% 2,599$							 2,441$									 2,615$								
5/2015 5.4% 2,648$							 2,469$									 2,665$								
6/2015 5.5% 2,674$							 2,516$									 2,691$								
7/2015 5.6% 2,708$							 2,590$									 2,724$								
8/2015 5.9% 2,749$							 2,632$									 2,766$								
9/2015 6.1% 2,766$							 2,647$									 2,783$								
10/2015 6.0% 2,758$							 2,636$									 2,774$								
11/2015 6.0% 2,750$							 2,645$									 2,767$								
12/2015 6.0% 2,742$							 2,652$									 2,759$								
Orange	County	Housing	Market	News
	$520,000		
	$540,000		
	$560,000		
	$580,000		
	$600,000		
	$620,000		
	$640,000		
1/2015	2/2015	3/2015	4/2015	5/2015	6/2015	7/2015	8/2015	9/2015	10/2015	11/2015	12/2015	
Median		 Rental	Parity	 Historic	Value	
	$374			$375			$375			$377			$378			$380		
	$384		
	$386		
	$388		
	$391			$392		
	$394		
$360	
$365	
$370	
$375	
$380	
$385	
$390	
$395	
$400	
1/2015	2/2015	3/2015	4/2015	5/2015	6/2015	7/2015	8/2015	9/2015	10/2015	11/2015	12/2015	
	$2,616		
	$2,599		
	$2,599		
	$2,599		
	$2,648		
	$2,674		
	$2,708		
	$2,749		
	$2,766		
	$2,758		
	$2,750		
	$2,742		
$2,200	
$2,300	
$2,400	
$2,500	
$2,600	
$2,700	
$2,800	
$2,900	
1/2015	2/2015	3/2015	4/2015	5/2015	6/2015	7/2015	8/2015	9/2015	10/2015	11/2015	12/2015	
Rent	 Own	 Historic	Cost	to	Own	Relagve	to	Rent
OC	Housing	News
info@ochousingnews.com
23	of	58
January	2016
Shevy	Akason
877-409-8515
Orange	County	median	home	price	since	January	1988
Orange	County	median	rent	and	monthly	cost	of	ownership	since	January	1988
$0	
$100,000	
$200,000	
$300,000	
$400,000	
$500,000	
$600,000	
$700,000	
$800,000	
1/1988	1/1989	1/1990	1/1991	1/1992	1/1993	1/1994	1/1995	1/1996	1/1997	1/1998	1/1999	1/2000	1/2001	1/2002	1/2003	1/2004	1/2005	1/2006	1/2007	1/2008	1/2009	1/2010	1/2011	1/2012	1/2013	1/2014	1/2015	1/2016	1/2017	
Median	Resale	 Projecgon	 Rental	Parity	 Historic	Value	
$0	
$500	
$1,000	
$1,500	
$2,000	
$2,500	
$3,000	
$3,500	
$4,000	
$4,500	
1/1988	1/1989	1/1990	1/1991	1/1992	1/1993	1/1994	1/1995	1/1996	1/1997	1/1998	1/1999	1/2000	1/2001	1/2002	1/2003	1/2004	1/2005	1/2006	1/2007	1/2008	1/2009	1/2010	1/2011	1/2012	1/2013	1/2014	1/2015	
Median	Rent	 Cost	to	Own	 Historic	Cost	to	Own	Relagve	to	Rent
OC	Housing	News
info@ochousingnews.com
24	of	58
January	2016
Shevy	Akason
877-409-8515
Resale	$/SF	Year-over-Year	Percentage	Change:	Orange	County	since	January	1989
Rental	$/SF	Year-over-Year	Percentage	Change:	Orange	County	since	January	1989
-8%	
-6%	
-4%	
-2%	
0%	
2%	
4%	
6%	
8%	
10%	
12%	
14%	
1/1989	1/1990	1/1991	1/1992	1/1993	1/1994	1/1995	1/1996	1/1997	1/1998	1/1999	1/2000	1/2001	1/2002	1/2003	1/2004	1/2005	1/2006	1/2007	1/2008	1/2009	1/2010	1/2011	1/2012	1/2013	1/2014	1/2015	
Normal	and	sustainable	
Rental	rates	in	excess	of	7%	
are	not	sustainable.	Long	
periods	of	excessive	
appreciagon	lead	to	a	crash.	
Falling/Correcgng	
Weak	
-20%	
-15%	
-10%	
-5%	
0%	
5%	
10%	
15%	
20%	
25%	
30%	
35%	
40%	
1/1989	1/1990	1/1991	1/1992	1/1993	1/1994	1/1995	1/1996	1/1997	1/1998	1/1999	1/2000	1/2001	1/2002	1/2003	1/2004	1/2005	1/2006	1/2007	1/2008	1/2009	1/2010	1/2011	1/2012	1/2013	1/2014	1/2015	
Normal	and	sustainable	
Appreciagon	rates	in	excess	of	7%	are	
not	sustainable.	Long	periods	of	
excessive	appreciagon	lead	to	a	crash.	
Falling/Correcgng
OC	Housing	News
info@ochousingnews.com
25	of	58
January	2016
Shevy	Akason
877-409-8515
Historic	Median	Home	Price	Relative	to	Rental	Parity:	Orange	County	since	January	1988
OCHN	Market	Timing	System	Rating:	Orange	County	since	January	1988
-35.0%	
-28.0%	
-21.0%	
-14.0%	
-7.0%	
0.0%	
7.0%	
14.0%	
21.0%	
28.0%	
35.0%	
42.0%	
49.0%	
56.0%	
63.0%	
70.0%	
77.0%	
84.0%	
91.0%	
1/1988	1/1989	1/1990	1/1991	1/1992	1/1993	1/1994	1/1995	1/1996	1/1997	1/1998	1/1999	1/2000	1/2001	1/2002	1/2003	1/2004	1/2005	1/2006	1/2007	1/2008	1/2009	1/2010	1/2011	1/2012	1/2013	1/2014	1/2015	
Discount	or	Premium	
Value	Relagve	to	Rental	Parity	 Historic	Norm	
Stable	period	between	
housing	bubbles	from	
1993-1999	establishes	
historic	norm.	
0	
1	
2	
3	
4	
5	
6	
7	
8	
9	
10	
1/1988	1/1989	1/1990	1/1991	1/1992	1/1993	1/1994	1/1995	1/1996	1/1997	1/1998	1/1999	1/2000	1/2001	1/2002	1/2003	1/2004	1/2005	1/2006	1/2007	1/2008	1/2009	1/2010	1/2011	1/2012	1/2013	1/2014	1/2015	
Values	7-10:	Undervalued	Market:	
Strong	Buy	Recommendagon	
Values	4-6:	Neutral	Market,		
Weak	Buy	Recommendagon	
Values	1-3:	Inflated	or	
Weak	Market:	
Consider	Selling.		
Do	not	Buy.
OC	Housing	News
info@ochousingnews.com
26	of	58
January	2016
Shevy	Akason
877-409-8515
Cash	Investor	Capitalization	Rate:	Orange	County	since	January	1988
Financed	Investor	Cash-on-Cash	Return:	Orange	County	since	January	1988
0.0%	
2.0%	
4.0%	
6.0%	
8.0%	
10.0%	
12.0%	
1/1988	1/1989	1/1990	1/1991	1/1992	1/1993	1/1994	1/1995	1/1996	1/1997	1/1998	1/1999	1/2000	1/2001	1/2002	1/2003	1/2004	1/2005	1/2006	1/2007	1/2008	1/2009	1/2010	1/2011	1/2012	1/2013	1/2014	1/2015	
Capitalizagon	Rate	 Mortgage	Interest	Rate	
-25.0%	
-20.0%	
-15.0%	
-10.0%	
-5.0%	
0.0%	
5.0%	
10.0%	
15.0%	
1/1988	1/1989	1/1990	1/1991	1/1992	1/1993	1/1994	1/1995	1/1996	1/1997	1/1998	1/1999	1/2000	1/2001	1/2002	1/2003	1/2004	1/2005	1/2006	1/2007	1/2008	1/2009	1/2010	1/2011	1/2012	1/2013	1/2014	1/2015
OC	Housing	News
info@ochousingnews.com
27	of	58
January	2016
Shevy	Akason
877-409-8515
Median Resale	% Rent	% Median Cost	of Ownership
City Resale	$ Change	YoY Resale	$/SF Change	YoY Rent	$ Ownership Prem./Disc. Cap	Rate
Aliso	Viejo 506,200$					 3.0% 357$											 4.3% 2,507$								 2,269$									 (238)$										 4.8%
Anaheim 470,600$					 5.5% 319$											 5.2% 2,183$								 2,093$									 (90)$												 4.5%
Anaheim	Hills 627,700$					 5.0% 337$											 3.4% 2,583$								 2,796$									 213$												 4.0%
Brea 625,300$					 4.9% 340$											 7.8% 2,561$								 2,803$									 242$												 3.9%
Buena	Park 475,900$					 6.8% 333$											 3.8% 2,303$								 2,128$									 (175)$										 4.6%
Corona	Del	Mar 1,528,300$	 14.2% 1,106$								 0.5% 4,071$								 6,615$									 2,543$								 2.6%
Costa	Mesa 686,700$					 8.6% 458$											 5.9% 2,802$								 3,051$									 249$												 3.9%
Coto	De	Caza 1,019,200$	 3.6% 343$											 3.8% 3,584$								 4,523$									 939$												 3.4%
Cypress 543,600$					 8.2% 352$											 1.0% 2,533$								 2,430$									 (103)$										 4.5%
Dana	Point 801,100$					 9.1% 545$											 6.5% 2,584$								 3,553$									 969$												 3.1%
Fountain	Valley 668,300$					 6.5% 362$											 4.1% 2,794$								 2,985$									 191$												 4.0%
Fullerton 524,400$					 5.4% 342$											 6.5% 2,519$								 2,311$									 (209)$										 4.6%
Garden	Grove 490,200$					 5.4% 336$											 4.3% 2,006$								 2,176$									 170$												 3.9%
Huntington	Beach 678,500$					 6.2% 439$											 4.8% 2,718$								 3,019$									 301$												 3.8%
Irvine 712,800$					 3.7% 433$											 3.3% 3,006$								 3,201$									 196$												 4.0%
La	Habra 471,800$					 7.5% 324$											 5.5% 1,801$								 2,068$									 268$												 3.7%
La	Palma 615,200$					 2.5% 311$											 0.5% 2,628$								 2,751$									 122$												 4.1%
Ladera	Ranch 630,500$					 3.2% 329$											 2.7% 2,907$								 2,828$									 (79)$												 4.4%
Laguna	Beach 1,671,100$	 4.8% 1,051$								 6.0% 3,571$								 7,305$									 3,734$								 2.1%
Laguna	Hills 600,500$					 2.9% 344$											 5.0% 2,539$								 2,585$									 46$														 4.1%
Laguna	Niguel 719,300$					 2.9% 388$											 4.2% 2,757$								 3,211$									 453$												 3.7%
Laguna	Woods 228,900$					 4.5% 230$											 9.0% 1,731$								 1,023$									 (708)$										 7.3%
Lake	Forest 575,100$					 5.2% 342$											 1.4% 2,490$								 2,560$									 70$														 4.2%
Mission	Viejo 620,000$					 5.3% 352$											 3.0% 2,693$								 2,761$									 68$														 4.2%
Newport	Beach 1,513,600$	 6.2% 789$											 9.7% 3,522$								 6,715$									 3,193$								 2.2%
Newport	Coast 2,923,400$	 0.6% 761$											 3.4% 4,456$								 12,835$							 8,379$								 1.5%
North	Tustin 867,800$					 5.2% 362$											 5.5% 1,539$								 4,341$									 2,803$								 1.7%
Orange 581,700$					 6.5% 352$											 9.3% 2,588$								 2,609$									 22$														 4.3%
Placentia 579,800$					 5.5% 316$											 8.9% 2,397$								 2,548$									 151$												 4.0%
Rancho	Santa	Margarita 563,700$					 5.1% 343$											 7.4% 2,453$								 2,518$									 66$														 4.2%
San	Clemente 837,300$					 7.1% 433$											 9.8% 2,622$								 3,701$									 1,079$								 3.0%
San	Juan	Capistrano 719,600$					 3.7% 351$											 1.6% 2,756$								 3,183$									 427$												 3.7%
Santa	Ana 416,600$					 8.6% 325$											 5.9% 1,999$								 1,862$									 (137)$										 4.6%
Tustin 560,200$					 6.3% 375$											 6.5% 2,456$								 2,506$									 51$														 4.2%
Westminster 556,500$					 7.8% 372$											 -3.4% 2,482$								 2,491$									 9$																 4.3%
Yorba	Linda 726,200$					 4.0% 352$											 1.1% 3,069$								 3,230$									 161$												 4.1%
Market	Performance	and	Trends:	Orange	County	and	Major	Cities	and	Zips
OC	Housing	News
info@ochousingnews.com
28	of	58
January	2016
Shevy	Akason
877-409-8515
Median Resale	% Rent	% Median Cost	of Ownership
City Resale	$ Change	YoY Resale	$/SF Change	YoY Rent	$ Ownership Prem./Disc. Cap	Rate
Anaheim		92801 426,200$					 5.2% 320$											 4.8% 2,033$								 1,909$									 (123)$										 4.6%
Anaheim		92802 457,500$					 4.1% 316$											 3.7% 2,081$								 2,051$									 (30)$												 4.4%
Anaheim		92804 482,800$					 9.6% 318$											 8.1% 2,032$								 2,146$									 115$												 4.0%
Anaheim		92805 450,600$					 8.0% 331$											 2.4% 2,238$								 1,991$									 (246)$										 4.8%
Anaheim		92806 525,200$					 6.2% 302$											 5.0% 2,357$								 2,318$									 (39)$												 4.3%
Anaheim		92807 514,000$					 5.4% 331$											 5.8% 1,693$								 2,279$									 587$												 3.2%
Fullerton		92831 558,000$					 7.1% 346$											 4.1% 2,481$								 2,442$									 (39)$												 4.3%
Fullerton		92832 436,100$					 7.4% 352$											 7.6% 2,287$								 1,960$									 (327)$										 5.0%
Fullerton		92833 515,000$					 4.4% 342$											 5.7% 2,450$								 2,257$									 (193)$										 4.6%
Fullerton		92835 606,000$					 5.0% 335$											 5.2% 3,103$								 2,728$									 (375)$										 4.9%
Garden	Grove		92840 453,200$					 2.7% 321$											 3.2% 1,852$								 2,009$									 157$												 3.9%
Garden	Grove		92841 520,600$					 8.6% 341$											 11.6% 2,231$								 2,309$									 78$														 4.1%
Huntington	Beach		92646 574,200$					 4.6% 404$											 3.3% 2,841$								 2,535$									 (307)$										 4.8%
Huntington	Beach		92647 640,000$					 5.3% 412$											 2.4% 2,650$								 2,857$									 207$												 4.0%
Huntington	Beach		92648 812,400$					 6.8% 462$											 6.1% 3,252$								 3,618$									 366$												 3.8%
Huntington	Beach		92649 709,000$					 6.7% 479$											 4.7% 2,465$								 3,143$									 679$												 3.3%
Newport	Beach		92660 1,552,200$	 6.6% 678$											 3.9% 3,611$								 6,899$									 3,288$								 2.2%
Newport	Beach		92663 1,348,500$	 5.2% 808$											 11.8% 3,574$								 5,943$									 2,368$								 2.5%
Orange		92867 551,400$					 4.5% 343$											 8.1% 2,249$								 2,527$									 279$												 3.9%
Orange		92869 579,800$					 5.5% 316$											 8.9% 2,397$								 2,548$									 151$												 4.0%
Market	Performance	and	Trends:	Orange	County	and	Major	Cities	and	Zips
OC	Housing	News
info@ochousingnews.com
29	of	58
January	2016
Shevy	Akason
877-409-8515
%	Over/Under Historic %	Over/Under
City Rating Median Rental	Parity Rental	Parity Premium Historic	Prem.
Aliso	Viejo 8 506,200$						 559,300$					 -9.6% -4.7% -4.9%
Anaheim 8 470,600$						 487,100$					 -3.5% 4.5% -8.0%
Anaheim	Hills 9 627,700$						 576,300$					 7.5% 22.2% -14.7%
Brea 7 625,300$						 571,300$					 9.5% 14.9% -5.4%
Buena	Park 8 475,900$						 513,700$					 -8.0% -1.5% -6.5%
Corona	Del	Mar 7 1,528,300$			 908,300$					 59.6% 82.6% -23.0%
Costa	Mesa 7 686,700$						 625,100$					 8.3% 13.8% -5.5%
Coto	De	Caza 10 1,019,200$			 799,600$					 27.3% 54.3% -27.0%
Cypress 7 543,600$						 565,100$					 -3.0% 17.6% -20.6%
Dana	Point 7 801,100$						 576,400$					 34.1% 26.8% 7.3%
Fountain	Valley 9 668,300$						 623,400$					 9.0% 21.0% -12.0%
Fullerton 8 524,400$						 562,100$					 -8.2% -4.4% -3.8%
Garden	Grove 8 490,200$						 447,400$					 8.9% 5.3% 3.6%
Huntington	Beach 8 678,500$						 606,400$					 10.7% 15.8% -5.1%
Irvine 8 712,800$						 670,500$					 6.7% 13.2% -6.5%
La	Habra 6 471,800$						 401,700$					 15.5% 5.5% 10.0%
La	Palma 7 615,200$						 586,400$					 5.6% 21.4% -15.8%
Ladera	Ranch 9 630,500$						 648,600$					 -4.7% 5.5% -10.2%
Laguna	Beach 3 1,671,100$			 796,700$					 107.3% 59.5% 47.8%
Laguna	Hills 10 600,500$						 566,400$					 1.1% 27.8% -26.7%
Laguna	Niguel 8 719,300$						 615,100$					 14.0% 18.7% -4.7%
Laguna	Woods 10 228,900$						 386,000$					 -40.9% -10.4% -30.5%
Lake	Forest 6 575,100$						 555,500$					 2.1% 8.8% -6.7%
Mission	Viejo 9 620,000$						 600,800$					 2.6% 11.6% -9.1%
Newport	Beach 6 1,513,600$			 785,800$					 88.3% 75.3% 13.0%
Newport	Coast 1 2,923,400$			 994,000$					 181.3% 105.3% 76.0%
North	Tustin 1 867,800$						 343,300$					 151.1% 46.4% 104.7%
Orange 6 581,700$						 577,300$					 -0.2% -9.6% 9.4%
Placentia 7 579,800$						 534,800$					 3.4% -1.3% 4.7%
Rancho	Santa	Margarita 7 563,700$						 547,200$					 0.0% 2.2% -2.1%
San	Clemente 5 837,300$						 585,000$					 40.6% 28.9% 11.7%
San	Juan	Capistrano 6 719,600$						 614,700$					 14.8% 22.7% -7.8%
Santa	Ana 7 416,600$						 445,900$					 -8.2% -1.4% -6.8%
Tustin 8 560,200$						 547,800$					 2.2% 6.3% -4.0%
Westminster 3 556,500$						 553,700$					 4.1% 5.8% -1.7%
Yorba	Linda 8 726,200$						 684,800$					 4.9% 23.6% -18.7%
Market	Timing	Rating	and	Valuations:	Orange	County	and	Major	Cities	and	Zips
OC	Housing	News
info@ochousingnews.com
30	of	58
January	2016
Shevy	Akason
877-409-8515
%	Over/Under Historic %	Over/Under
City Rating Median Rental	Parity Rental	Parity Premium Historic	Prem.
Anaheim		92801 7 426,200$						 453,400$					 -5.6% -16.5% 11.0%
Anaheim		92802 9 457,500$						 464,200$					 -2.4% 5.7% -8.1%
Anaheim		92804 5 482,800$						 453,200$					 2.8% -10.0% 12.8%
Anaheim		92805 6 450,600$						 455,700$					 -1.5% -12.7% 11.2%
Anaheim		92806 8 525,200$						 525,900$					 -1.5% 0.4% -1.9%
Anaheim		92807 3 514,000$						 377,600$					 34.6% -10.9% 45.6%
Fullerton		92831 7 558,000$						 544,700$					 4.1% -1.9% 6.0%
Fullerton		92832 6 436,100$						 510,200$					 -15.0% -12.7% -2.3%
Fullerton		92833 9 515,000$						 546,600$					 -8.3% 2.3% -10.6%
Fullerton		92835 10 606,000$						 692,300$					 -9.8% 47.3% -57.1%
Garden	Grove		92840 8 453,200$						 413,100$					 8.0% 9.6% -1.6%
Garden	Grove		92841 7 520,600$						 497,700$					 3.6% 18.2% -14.6%
Huntington	Beach		92646 10 574,200$						 633,900$					 -10.8% 10.2% -21.0%
Huntington	Beach		92647 8 640,000$						 591,200$					 7.8% 13.1% -5.3%
Huntington	Beach		92648 10 812,400$						 725,500$					 13.4% 56.1% -42.7%
Huntington	Beach		92649 8 709,000$						 549,800$					 27.9% 21.8% 6.1%
Newport	Beach		92660 8 1,552,200$			 805,600$					 90.6% 83.2% 7.4%
Newport	Beach		92663 3 1,348,500$			 797,300$					 68.6% 36.5% 32.1%
Orange		92867 6 551,400$						 501,700$					 9.3% 0.6% 8.7%
Orange		92869 7 579,800$						 534,800$					 3.4% -1.3% 4.7%
Market	Timing	Rating	and	Valuations:	Orange	County	and	Major	Cities	and	Zips
OC	Housing	News
info@ochousingnews.com
31	of	58
January	2016
Shevy	Akason
877-409-8515
Historically,	properties	in	this	market	sell	at	a	18.5%	discount.	Today's	discount	is	23.5%.	This	market	is	4.9%	undervalued.
Median	home	price	is	$306,900	with	a	rental	parity	value	of	$397,300.	This	market's	discount	is	$90,400.
Monthly	payment	affordability	has	been	improving	over	the	last	3	month(s).	Momentum	suggests	improving	affordability.
Resale	prices	on	a	$/SF	basis	increased	from	$172/SF	to	$173/SF.	Resale	prices	have	been	rising	for	2	month(s).
Over	the	last	12	months,	resale	prices	rose	4.9%	indicating	a	longer	term	upward	price	trend.
Median	rental	rates	declined	$4	last	month	from	$1,785	to	$1,781.	The	current	capitalization	rate	(rent/price)	is	5.6%.
Rents	have	been	rising	for	12	month(s).	Price	momentum	signals	rising	rents	over	the	next	three	months.
Market	rating	=	8
Median	Home	Price	and	Rental	Parity	trailing	twelve	months
Date Rating Median	 Rental	Parity Historic	Value
1/2015 7 289,600$			 389,100$				 316,987$			
2/2015 8 290,500$			 389,100$				 316,987$			
3/2015 8 292,300$			 386,200$				 314,625$			
4/2015 8 294,800$			 392,900$				 320,083$			
5/2015 8 298,100$			 388,600$				 316,580$			
6/2015 8 301,000$			 385,700$				 314,217$			
7/2015 8 305,100$			 388,000$				 316,091$			
8/2015 8 306,300$			 398,400$				 324,563$			
9/2015 8 306,500$			 401,800$				 327,333$			
10/2015 8 306,100$			 406,200$				 330,918$			
11/2015 8 307,400$			 399,300$				 325,297$			
12/2015 8 306,900$			 397,300$				 323,667$			
Resale	$/SF	and	year-over-year	percentage	change	trailing	twelve	months
Date ±	Typ.	Value $/SF %	Change
1/2015 -5.6% 165$											 7.4%
2/2015 -6.5% 164$											 5.4%
3/2015 -6.5% 166$											 4.7%
4/2015 -6.3% 168$											 4.2%
5/2015 -5.7% 169$											 3.9%
6/2015 -4.9% 170$											 3.6%
7/2015 -3.7% 171$											 3.6%
8/2015 -3.6% 172$											 3.4%
9/2015 -4.2% 172$											 3.9%
10/2015 -5.3% 172$											 4.3%
11/2015 -5.3% 172$											 4.7%
12/2015 -4.9% 173$											 4.9% -0.1853326
Rental	rate	and	year-over-year	percentage	change	trailing	twelve	months
Date %	Change Rent Own Historic	Cost	to	Own	Relative	to	Rent
1/2015 2.2% 1,692$							 1,287$									 1,378$								
2/2015 2.2% 1,692$							 1,270$									 1,378$								
3/2015 2.4% 1,692$							 1,267$									 1,378$								
4/2015 2.4% 1,700$							 1,273$									 1,385$								
5/2015 2.7% 1,717$							 1,291$									 1,399$								
6/2015 2.9% 1,733$							 1,315$									 1,412$								
7/2015 3.4% 1,758$							 1,351$									 1,432$								
8/2015 3.7% 1,775$							 1,366$									 1,446$								
9/2015 4.0% 1,786$							 1,370$									 1,455$								
10/2015 4.2% 1,786$							 1,357$									 1,455$								
11/2015 4.6% 1,786$							 1,361$									 1,455$								
12/2015 5.0% 1,781$							 1,365$									 1,451$								
Riverside	County	Housing	Market	News
	$-		
	$100,000		
	$200,000		
	$300,000		
	$400,000		
	$500,000		
1/2015	2/2015	3/2015	4/2015	5/2015	6/2015	7/2015	8/2015	9/2015	10/2015	11/2015	12/2015	
Median		 Rental	Parity	 Historic	Value	
	$165			$164		
	$166		
	$168		
	$169			$170			$171			$172			$172			$172			$172			$173		
$150	
$155	
$160	
$165	
$170	
$175	
1/2015	2/2015	3/2015	4/2015	5/2015	6/2015	7/2015	8/2015	9/2015	10/2015	11/2015	12/2015	
	$1,692		
	$1,692		
	$1,692		
	$1,700		
	$1,717		
	$1,733		
	$1,758		
	$1,775		
	$1,786		
	$1,786		
	$1,786		
	$1,781		
$1,000	
$1,200	
$1,400	
$1,600	
$1,800	
$2,000	
1/2015	2/2015	3/2015	4/2015	5/2015	6/2015	7/2015	8/2015	9/2015	10/2015	11/2015	12/2015	
Rent	 Own	 Historic	Cost	to	Own	Relagve	to	Rent
OC	Housing	News
info@ochousingnews.com
32	of	58
January	2016
Shevy	Akason
877-409-8515
Riverside	County	median	home	price	since	January	1988
Riverside	County	median	rent	and	monthly	cost	of	ownership	since	January	1988
$0	
$50,000	
$100,000	
$150,000	
$200,000	
$250,000	
$300,000	
$350,000	
$400,000	
$450,000	
1/1988	1/1989	1/1990	1/1991	1/1992	1/1993	1/1994	1/1995	1/1996	1/1997	1/1998	1/1999	1/2000	1/2001	1/2002	1/2003	1/2004	1/2005	1/2006	1/2007	1/2008	1/2009	1/2010	1/2011	1/2012	1/2013	1/2014	1/2015	1/2016	1/2017	
Median	Resale	 Rental	Parity	 Historic	Value	 Projecgon	
$0	
$500	
$1,000	
$1,500	
$2,000	
$2,500	
$3,000	
1/1989	1/1990	1/1991	1/1992	1/1993	1/1994	1/1995	1/1996	1/1997	1/1998	1/1999	1/2000	1/2001	1/2002	1/2003	1/2004	1/2005	1/2006	1/2007	1/2008	1/2009	1/2010	1/2011	1/2012	1/2013	1/2014	1/2015	1/2016	1/2017	
Median	Rent	 Cost	to	Own	 Historic	Cost	to	Own	Relagve	to	Rent
OC	Housing	News
info@ochousingnews.com
33	of	58
January	2016
Shevy	Akason
877-409-8515
Resale	$/SF	Year-over-Year	Percentage	Change:	Riverside	County	since	January	1989
Rental	$/SF	Year-over-Year	Percentage	Change:	Riverside	County	since	January	1989
-8%	
-6%	
-4%	
-2%	
0%	
2%	
4%	
6%	
8%	
10%	
12%	
14%	
16%	
18%	
1/1989	1/1990	1/1991	1/1992	1/1993	1/1994	1/1995	1/1996	1/1997	1/1998	1/1999	1/2000	1/2001	1/2002	1/2003	1/2004	1/2005	1/2006	1/2007	1/2008	1/2009	1/2010	1/2011	1/2012	1/2013	1/2014	1/2015	1/2016	1/2017	
Normal	and	sustainable	
Rental	rates	in	excess	of	7%	
are	not	sustainable.	Long	
periods	of	excessive	
appreciagon	lead	to	a	crash.	
Falling/Correcgng	
Weak	
-50%	
-45%	
-40%	
-35%	
-30%	
-25%	
-20%	
-15%	
-10%	
-5%	
0%	
5%	
10%	
15%	
20%	
25%	
30%	
35%	
40%	
45%	
50%	
1/1989	1/1990	1/1991	1/1992	1/1993	1/1994	1/1995	1/1996	1/1997	1/1998	1/1999	1/2000	1/2001	1/2002	1/2003	1/2004	1/2005	1/2006	1/2007	1/2008	1/2009	1/2010	1/2011	1/2012	1/2013	1/2014	1/2015	1/2016	1/2017	
Normal	and	sustainable	
Appreciagon	rates	in	excess	of	7%	are	
not	sustainable.	Long	periods	of	
excessive	appreciagon	lead	to	a	crash.	
Falling/Correcgng
OC	Housing	News
info@ochousingnews.com
34	of	58
January	2016
Shevy	Akason
877-409-8515
Historic	Median	Home	Price	Relative	to	Rental	Parity:	Riverside	County	since	January	1988
OCHN	Market	Timing	System	Rating:	Riverside	County	since	January	1988
-63.0%	
-56.0%	
-49.0%	
-42.0%	
-35.0%	
-28.0%	
-21.0%	
-14.0%	
-7.0%	
0.0%	
7.0%	
14.0%	
21.0%	
28.0%	
35.0%	
42.0%	
49.0%	
56.0%	
63.0%	
70.0%	
77.0%	
84.0%	
91.0%	
98.0%	
105.0%	
112.0%	
1/1989	1/1990	1/1991	1/1992	1/1993	1/1994	1/1995	1/1996	1/1997	1/1998	1/1999	1/2000	1/2001	1/2002	1/2003	1/2004	1/2005	1/2006	1/2007	1/2008	1/2009	1/2010	1/2011	1/2012	1/2013	1/2014	1/2015	1/2016	1/2017	
Discount	or	Premium	
Value	Relagve	to	Rental	Parity	 Historic	Norm	
Stable	period	between	
housing	bubbles	from	
1993-1999	establishes	
historic	norm.	
0	
1	
2	
3	
4	
5	
6	
7	
8	
9	
10	
1/1988	1/1989	1/1990	1/1991	1/1992	1/1993	1/1994	1/1995	1/1996	1/1997	1/1998	1/1999	1/2000	1/2001	1/2002	1/2003	1/2004	1/2005	1/2006	1/2007	1/2008	1/2009	1/2010	1/2011	1/2012	1/2013	1/2014	1/2015	1/2016	1/2017	
Values	7-10:	Undervalued	Market:	
Strong	Buy	Recommendagon	
Values	4-6:	Neutral	Market,		
Weak	Buy	Recommendagon	
Values	1-3:	Inflated	
or	Weak	Market:	
Consider	Selling.		
Do	not	Buy.
OC	Housing	News
info@ochousingnews.com
35	of	58
January	2016
Shevy	Akason
877-409-8515
Cash	Investor	Capitalization	Rate:	Riverside	County	since	January	1988
Financed	Investor	Cash-on-Cash	Return:	Riverside	County	since	January	1988
0.0%	
2.0%	
4.0%	
6.0%	
8.0%	
10.0%	
12.0%	
1/1988	1/1989	1/1990	1/1991	1/1992	1/1993	1/1994	1/1995	1/1996	1/1997	1/1998	1/1999	1/2000	1/2001	1/2002	1/2003	1/2004	1/2005	1/2006	1/2007	1/2008	1/2009	1/2010	1/2011	1/2012	1/2013	1/2014	1/2015	1/2016	1/2017	
Capitalizagon	Rate	 Mortgage	Interest	Rate	
-25.0%	
-20.0%	
-15.0%	
-10.0%	
-5.0%	
0.0%	
5.0%	
10.0%	
15.0%	
20.0%	
25.0%	
30.0%	
1/1988	1/1989	1/1990	1/1991	1/1992	1/1993	1/1994	1/1995	1/1996	1/1997	1/1998	1/1999	1/2000	1/2001	1/2002	1/2003	1/2004	1/2005	1/2006	1/2007	1/2008	1/2009	1/2010	1/2011	1/2012	1/2013	1/2014	1/2015	1/2016	1/2017
OC	Housing	News
info@ochousingnews.com
36	of	58
January	2016
Shevy	Akason
877-409-8515
Median Resale	% Rent	% Median Cost	of Ownership
City Resale	$ Change	YoY Resale	$/SF Change	YoY Rent	$ Ownership Prem./Disc. Cap	Rate
Banning 202,600$					 3.3% 138$											 6.7% 1,174$								 905$												 (270)$										 5.6%
Beaumont		 272,000$					 6.7% 138$											 0.3% 1,698$								 1,209$									 (489)$										 6.0%
Cathedral	City		 249,100$					 2.6% 150$											 1.4% 1,592$								 1,129$									 (464)$										 6.1%
Corona		 406,500$					 5.5% 217$											 4.4% 2,145$								 1,812$									 (333)$										 5.1%
Desert	Hot	Springs		 160,500$					 12.6% 104$											 8.1% 967$											 711$												 (256)$										 5.8%
Hemet		 194,100$					 6.2% 116$											 8.0% 1,204$								 870$												 (334)$										 6.0%
Indio		 271,100$					 6.1% 148$											 2.0% 1,615$								 1,201$									 (414)$										 5.7%
La	Quinta		 376,100$					 7.5% 212$											 2.8% 1,481$								 1,646$									 165$												 3.8%
Lake	Elsinore		 302,000$					 9.3% 154$											 7.2% 1,735$								 1,341$									 (394)$										 5.5%
Menifee		 306,500$					 7.3% 151$											 5.7% 1,606$								 1,365$									 (241)$										 5.0%
Moreno	Valley		 262,000$					 7.6% 156$											 3.6% 1,556$								 1,163$									 (393)$										 5.7%
Murrieta		 356,100$					 7.3% 166$											 5.2% 1,839$								 1,590$									 (249)$										 5.0%
Norco		 462,600$					 6.7% 248$											 -1.7% 2,195$								 2,047$									 (148)$										 4.6%
Palm	Desert		 308,500$					 5.5% 189$											 8.6% 1,557$								 1,378$									 (179)$										 4.8%
Palm	Springs		 323,100$					 2.8% 233$											 5.9% 1,375$								 1,405$									 30$														 4.1%
Perris		 246,300$					 7.4% 143$											 1.6% 1,443$								 1,085$									 (359)$										 5.6%
Rancho	Mirage		 394,100$					 -4.8% 198$											 -6.1% 2,013$								 1,776$									 (237)$										 4.9%
Riverside		 330,400$					 5.5% 200$											 2.1% 1,748$								 1,456$									 (292)$										 5.1%
San	Jacinto		 216,300$					 7.2% 116$											 5.7% 1,434$								 966$												 (467)$										 6.4%
Sun	City		 197,600$					 2.2% 141$											 0.1% 1,076$								 872$												 (205)$										 5.2%
Temecula		 403,700$					 5.0% 192$											 4.5% 2,003$								 1,789$									 (214)$										 4.8%
Wildomar		 308,200$					 10.9% 156$											 7.1% 1,785$								 1,380$									 (405)$										 5.6%
Banning		92220 202,600$					 3.3% 142$											 6.4% 1,174$								 905$												 (270)$										 5.6%
Beaumont		92223 271,900$					 6.4% 137$											 0.3% 1,698$								 1,208$									 (490)$										 6.0%
Canyon	Lake		92587 350,800$					 1.4% 185$											 2.3% 1,909$								 1,557$									 (352)$										 5.2%
Cathedral	City		92234 245,900$					 2.4% 150$											 1.5% 1,600$								 1,115$									 (486)$										 6.2%
Corona		92880 415,600$					 2.8% 207$											 11.8% 2,283$								 1,851$									 (433)$										 5.3%
Corona		92881 442,400$					 3.6% 218$											 2.6% 2,228$								 2,002$									 (226)$										 4.8%
Corona		92882 402,200$					 9.7% 237$											 2.4% 2,228$								 1,800$									 (428)$										 5.3%
Corona		92883 409,500$					 3.7% 198$											 2.6% 2,225$								 1,829$									 (396)$										 5.2%
Desert	Hot	Springs		92240 159,900$					 12.2% 103$											 10.6% 1,004$								 712$												 (292)$										 6.0%
Hemet		92544 201,000$					 7.0% 120$											 5.9% 1,214$								 898$												 (316)$										 5.8%
Hemet		92545 219,700$					 7.8% 119$											 7.2% 1,315$								 978$												 (336)$										 5.7%
Indio		92201 229,800$					 8.5% 145$											 -1.4% 1,433$								 1,048$									 (385)$										 6.0%
Indio		92203 289,300$					 2.8% 151$											 2.5% 1,759$								 1,283$									 (477)$										 5.8%
La	Quinta		92253 376,900$					 7.5% 212$											 2.8% 1,481$								 1,649$									 168$												 3.8%
Market	Performance	and	Trends:	Riverside	County,	Major	Cities,	and	Zips
OC	Housing	News
info@ochousingnews.com
37	of	58
January	2016
Shevy	Akason
877-409-8515
Median Resale	% Rent	% Median Cost	of Ownership
City
Resale	$ Change	YoY Resale	$/SF Change	YoY Rent	$ Ownership Prem./Disc. Cap	Rate
Lake	Elsinore		92530 279,600$					 8.2% 161$											 8.5% 1,393$								 1,233$									 (159)$										 4.8%
Menifee		92584 317,600$					 7.0% 151$											 2.9% 1,757$								 1,416$									 (341)$										 5.3%
Moreno	Valley		92551 250,800$					 7.2% 151$											 10.0% 1,388$								 1,115$									 (273)$										 5.3%
Moreno	Valley		92553 239,500$					 8.9% 167$											 5.7% 1,416$								 1,059$									 (357)$										 5.7%
Moreno	Valley		92555 301,800$					 2.3% 135$											 2.8% 1,700$								 1,336$									 (364)$										 5.4%
Moreno	Valley		92557 276,200$					 11.5% 165$											 0.6% 1,532$								 1,226$									 (306)$										 5.3%
Murrieta		92562 358,700$					 7.0% 179$											 4.5% 1,892$								 1,606$									 (285)$										 5.1%
Murrieta		92563 353,200$					 7.9% 155$											 6.3% 1,790$								 1,564$									 (226)$										 4.9%
Norco		92860 462,600$					 6.7% 248$											 -1.7% 2,195$								 2,047$									 (148)$										 4.6%
Palm	Desert		92211 307,400$					 4.5% 182$											 2.5% 1,659$								 1,381$									 (279)$										 5.2%
Palm	Desert		92260 307,700$					 6.9% 198$											 16.4% 1,475$								 1,382$									 (92)$												 4.6%
Palm	Springs		92262 330,500$					 1.8% 242$											 12.0% 1,618$								 1,444$									 (173)$										 4.7%
Palm	Springs		92264 315,900$					 3.4% 222$											 -2.2% 1,434$								 1,404$									 (29)$												 4.4%
Perris		92571 247,700$					 3.7% 142$											 2.5% 1,456$								 1,090$									 (366)$										 5.6%
Rancho	Mirage		92270 394,100$					 -4.9% 198$											 -6.0% 2,013$								 1,776$									 (237)$										 4.9%
Riverside		92503 330,900$					 5.8% 203$											 1.1% 1,731$								 1,448$									 (283)$										 5.0%
Riverside		92504 297,400$					 8.8% 205$											 8.6% 1,559$								 1,319$									 (240)$										 5.0%
Riverside		92506 361,800$					 7.2% 219$											 8.1% 1,629$								 1,620$									 (8)$														 4.3%
Riverside		92507 280,700$					 5.1% 195$											 3.6% 1,375$								 1,233$									 (142)$										 4.7%
Riverside		92508 414,800$					 3.6% 176$											 -3.7% 1,973$								 1,838$									 (135)$										 4.6%
San	Jacinto		92583 201,200$					 9.1% 122$											 5.7% 1,302$								 905$												 (397)$										 6.2%
Sun	City		92586 183,200$					 1.1% 139$											 5.2% 1,085$								 814$												 (270)$										 5.7%
Temecula		92592 403,600$					 5.5% 193$											 3.9% 1,993$								 1,789$									 (204)$										 4.7%
Wildomar		92595 309,300$					 11.2% 156$											 6.5% 1,740$								 1,384$									 (356)$										 5.4%
Market	Performance	and	Trends:	Riverside	County,	Major	Cities,	and	Zips
OC	Housing	News
info@ochousingnews.com
38	of	58
January	2016
Shevy	Akason
877-409-8515
%	Over/Under Historic %	Over/Under
City Rating Median Rental	Parity Rental	Parity Premium Historic	Prem.
Banning 9 202,600$						 397,300$					 -24.1% -14.6% -9.5%
Beaumont		 6 272,000$						 378,800$					 -28.7% -31.6% 2.9%
Cathedral	City		 7 249,100$						 355,200$					 -27.7% -18.0% -9.7%
Corona		 8 406,500$						 478,400$					 -15.7% -19.4% 3.7%
Desert	Hot	Springs		 6 160,500$						 215,600$					 -25.1% -26.9% 1.8%
Hemet		 7 194,100$						 268,500$					 -27.5% -20.2% -7.3%
Indio		 8 271,100$						 360,300$					 -24.6% -31.2% 6.6%
La	Quinta		 6 376,100$						 330,300$					 10.5% -3.5% 14.1%
Lake	Elsinore		 6 302,000$						 387,000$					 -23.7% -27.4% 3.7%
Menifee		 8 306,500$						 358,200$					 -15.1% -7.0% -8.1%
Moreno	Valley		 7 262,000$						 347,200$					 -25.2% -18.4% -6.8%
Murrieta		 8 356,100$						 410,200$					 -14.0% -3.9% -10.1%
Norco		 5 462,600$						 489,700$					 -5.1% -7.6% 2.5%
Palm	Desert		 10 308,500$						 347,400$					 -11.0% 14.9% -25.9%
Palm	Springs		 7 323,100$						 306,700$					 2.6% -11.1% 13.7%
Perris		 5 246,300$						 322,000$					 -25.2% -26.8% 1.6%
Rancho	Mirage		 6 394,100$						 449,000$					 -11.8% 21.3% -33.1%
Riverside		 8 330,400$						 390,000$					 -16.5% -20.4% 3.9%
San	Jacinto		 8 216,300$						 319,900$					 -31.8% -23.5% -8.2%
Sun	City		 7 197,600$						 240,100$					 -17.2% -4.0% -13.2%
Temecula		 8 403,700$						 446,800$					 -12.3% -9.2% -3.1%
Wildomar		 8 308,200$						 398,100$					 -23.0% -5.5% -17.5%
Banning		92220 9 202,600$						 262,000$					 -24.1% -13.9% -10.2%
Beaumont		92223 6 271,900$						 378,800$					 -28.7% -33.6% 4.9%
Canyon	Lake		92587 9 350,800$						 425,900$					 -18.7% 5.9% -24.5%
Cathedral	City		92234 7 245,900$						 357,000$					 -29.1% -20.1% -9.1%
Corona		92880 7 415,600$						 509,400$					 -18.5% -19.9% 1.4%
Corona		92881 8 442,400$						 497,000$					 -10.3% -10.2% -0.1%
Corona		92882 7 402,200$						 496,900$					 -17.3% -10.2% -7.1%
Corona		92883 8 409,500$						 496,400$					 -17.8% -22.0% 4.2%
Desert	Hot	Springs		92240 7 159,900$						 224,000$					 -30.5% -19.1% -11.3%
Hemet		92544 10 201,000$						 270,800$					 -24.5% -1.9% -22.7%
Hemet		92545 6 219,700$						 293,300$					 -25.6% -20.5% -5.1%
Indio		92201 4 229,800$						 319,600$					 -27.2% -30.5% 3.3%
Indio		92203 10 289,300$						 392,500$					 -27.1% -4.1% -23.0%
La	Quinta		92253 5 376,900$						 330,300$					 10.7% -8.2% 18.9%
Market	Timing	Rating	and	Valuations:	Riverside	County,	Major	Cities,	and	Zips
OC	Housing	News
info@ochousingnews.com
39	of	58
January	2016
Shevy	Akason
877-409-8515
%	Over/Under Historic %	Over/Under
City Rating Median Rental	Parity Rental	Parity Premium Historic	Prem.
Lake	Elsinore		92530 6 279,600$						 310,600$					 -15.9% -18.2% 2.3%
Menifee		92584 8 317,600$						 391,900$					 -18.9% -10.1% -8.8%
Moreno	Valley		92551 6 250,800$						 309,500$					 -20.6% -14.6% -6.0%
Moreno	Valley		92553 7 239,500$						 315,800$					 -25.9% -22.3% -3.6%
Moreno	Valley		92555 9 301,800$						 379,200$					 -20.6% -5.7% -14.9%
Moreno	Valley		92557 6 276,200$						 341,800$					 -19.8% -11.0% -8.8%
Murrieta		92562 9 358,700$						 422,000$					 -15.1% 0.3% -15.3%
Murrieta		92563 7 353,200$						 399,200$					 -13.3% -6.3% -7.1%
Norco		92860 5 462,600$						 489,700$					 -5.1% -7.6% 2.5%
Palm	Desert		92211 10 307,400$						 370,200$					 -16.4% 22.5% -38.9%
Palm	Desert		92260 8 307,700$						 328,900$					 -4.4% 9.8% -14.3%
Palm	Springs		92262 4 330,500$						 360,800$					 -8.7% -17.9% 9.2%
Palm	Springs		92264 4 315,900$						 319,800$					 -4.2% -1.7% -2.4%
Perris		92571 8 247,700$						 324,800$					 -25.5% -29.5% 4.0%
Rancho	Mirage		92270 4 394,100$						 449,000$					 -11.8% 8.0% -19.8%
Riverside		92503 6 330,900$						 386,000$					 -17.3% -23.0% 5.7%
Riverside		92504 5 297,400$						 347,700$					 -14.5% -24.5% 10.0%
Riverside		92506 6 361,800$						 363,300$					 -2.1% 0.0% -2.2%
Riverside		92507 8 280,700$						 306,700$					 -11.2% -18.5% 7.3%
Riverside		92508 3 414,800$						 440,100$					 -6.3% -16.9% 10.5%
San	Jacinto		92583 8 201,200$						 290,500$					 -31.1% -17.7% -13.5%
Sun	City		92586 8 183,200$						 242,000$					 -23.3% -4.1% -19.1%
Temecula		92592 8 403,600$						 444,700$					 -10.5% -10.4% -0.1%
Wildomar		92595 9 309,300$						 388,200$					 -21.6% -5.5% -16.1%
Market	Timing	Rating	and	Valuations:	Riverside	County,	Major	Cities,	and	Zips
OC	Housing	News
info@ochousingnews.com
40	of	58
January	2016
Shevy	Akason
877-409-8515
Historically,	properties	in	this	market	sell	at	a	25.7%	discount.	Today's	discount	is	32.2%.	This	market	is	6.6%	undervalued.
Median	home	price	is	$280,200	with	a	rental	parity	value	of	$406,600.	This	market's	discount	is	$126,400.
Monthly	payment	affordability	has	been	worsening	over	the	last	1	month(s).	Momentum	suggests	unchanging	affordability.
Resale	prices	on	a	$/SF	basis	increased	from	$184/SF	to	$184/SF.	Resale	prices	have	been	rising	for	1	month(s).
Over	the	last	12	months,	resale	prices	rose	7.0%	indicating	a	longer	term	upward	price	trend.
Median	rental	rates	declined	$23	last	month	from	$1,845	to	$1,822.	The	current	capitalization	rate	(rent/price)	is	6.2%.
Rents	have	been	rising	for	12	month(s).	Price	momentum	signals	rising	rents	over	the	next	three	months.
Market	rating	=	8
Median	Home	Price	and	Rental	Parity	trailing	twelve	months
Date Rating Median	 Rental	Parity Historic	Value
1/2015 9 258,700$			 400,900$				 297,987$			
2/2015 9 258,200$			 402,800$				 299,399$			
3/2015 9 261,100$			 400,100$				 297,392$			
4/2015 9 263,500$			 407,700$				 303,041$			
5/2015 9 267,300$			 407,200$				 302,670$			
6/2015 9 268,800$			 406,900$				 302,447$			
7/2015 8 274,600$			 407,100$				 302,595$			
8/2015 7 278,000$			 417,600$				 310,400$			
9/2015 8 278,800$			 418,700$				 311,218$			
10/2015 7 281,000$			 422,300$				 313,893$			
11/2015 8 280,100$			 412,800$				 306,832$			
12/2015 8 280,200$			 406,600$				 302,224$			
Resale	$/SF	and	year-over-year	percentage	change	trailing	twelve	months
Date ±	Typ.	Value $/SF %	Change
1/2015 -8.7% 171$											 5.8%
2/2015 -9.5% 171$											 4.5%
3/2015 -9.7% 172$											 4.6%
4/2015 -9.7% 173$											 4.4%
5/2015 -9.2% 174$											 3.9%
6/2015 -8.9% 176$											 3.8%
7/2015 -7.9% 179$											 6.3%
8/2015 -7.6% 181$											 7.0%
9/2015 -7.5% 183$											 6.9%
10/2015 -7.8% 184$											 7.1%
11/2015 -7.3% 184$											 6.6%
12/2015 -6.6% 184$											 7.0% -0.2567051
Rental	rate	and	year-over-year	percentage	change	trailing	twelve	months
Date %	Change Rent Own Historic	Cost	to	Own	Relative	to	Rent
1/2015 4.5% 1,743$							 1,148$									 1,296$								
2/2015 4.7% 1,752$							 1,134$									 1,302$								
3/2015 4.7% 1,752$							 1,130$									 1,303$								
4/2015 4.8% 1,764$							 1,135$									 1,311$								
5/2015 5.1% 1,799$							 1,155$									 1,337$								
6/2015 5.0% 1,828$							 1,176$									 1,359$								
7/2015 5.0% 1,845$							 1,211$									 1,371$								
8/2015 4.8% 1,861$							 1,230$									 1,383$								
9/2015 4.8% 1,861$							 1,241$									 1,383$								
10/2015 4.5% 1,857$							 1,238$									 1,380$								
11/2015 4.1% 1,846$							 1,242$									 1,372$								
12/2015 4.0% 1,823$							 1,248$									 1,355$								
San	Bernardino	County	Housing	Market	News
	$-		
	$100,000		
	$200,000		
	$300,000		
	$400,000		
	$500,000		
1/2015	2/2015	3/2015	4/2015	5/2015	6/2015	7/2015	8/2015	9/2015	10/2015	11/2015	12/2015	
Median		 Rental	Parity	 Historic	Value	
	$171			$171			$172			$173		
	$174		
	$176		
	$179		
	$181		
	$183			$184			$184			$184		
$160	
$165	
$170	
$175	
$180	
$185	
$190	
1/2015	2/2015	3/2015	4/2015	5/2015	6/2015	7/2015	8/2015	9/2015	10/2015	11/2015	12/2015	
	$1,743		
	$1,752		
	$1,752		
	$1,764		
	$1,799		
	$1,828		
	$1,845		
	$1,861		
	$1,861		
	$1,857		
	$1,846		
	$1,823		
$800	
$1,000	
$1,200	
$1,400	
$1,600	
$1,800	
$2,000	
1/2015	2/2015	3/2015	4/2015	5/2015	6/2015	7/2015	8/2015	9/2015	10/2015	11/2015	12/2015	
Rent	 Own	 Historic	Cost	to	Own	Relagve	to	Rent
OC	Housing	News
info@ochousingnews.com
41	of	58
January	2016
Shevy	Akason
877-409-8515
San	Bernardino	County	median	home	price	since	January	1988
San	Bernardino	County	median	rent	and	monthly	cost	of	ownership	since	January	1988
$0	
$50,000	
$100,000	
$150,000	
$200,000	
$250,000	
$300,000	
$350,000	
$400,000	
$450,000	
1/1988	1/1989	1/1990	1/1991	1/1992	1/1993	1/1994	1/1995	1/1996	1/1997	1/1998	1/1999	1/2000	1/2001	1/2002	1/2003	1/2004	1/2005	1/2006	1/2007	1/2008	1/2009	1/2010	1/2011	1/2012	1/2013	1/2014	1/2015	1/2016	1/2017	
Median	Resale	 Rental	Parity	 Historic	Value	 Projecgon	
$0	
$500	
$1,000	
$1,500	
$2,000	
$2,500	
Date	
12/1988	
12/1989	
12/1990	
12/1991	
12/1992	
12/1993	
12/1994	
12/1995	
12/1996	
12/1997	
12/1998	
12/1999	
12/2000	
12/2001	
12/2002	
12/2003	
12/2004	
12/2005	
12/2006	
12/2007	
12/2008	
12/2009	
12/2010	
12/2011	
12/2012	
12/2013	
12/2014	
12/2015	
12/2016	
Median	Rent	 Cost	to	Own	 Historic	Cost	to	Own	Relagve	to	Rent
OC	Housing	News
info@ochousingnews.com
42	of	58
January	2016
Shevy	Akason
877-409-8515
Resale	$/SF	Year-over-Year	Percentage	Change:	San	Bernardino	County	since	January	1989
Rental	$/SF	Year-over-Year	Percentage	Change:	San	Bernardino	County	since	January	1989
-8%	
-6%	
-4%	
-2%	
0%	
2%	
4%	
6%	
8%	
10%	
12%	
14%	
16%	
18%	
1/1989	1/1990	1/1991	1/1992	1/1993	1/1994	1/1995	1/1996	1/1997	1/1998	1/1999	1/2000	1/2001	1/2002	1/2003	1/2004	1/2005	1/2006	1/2007	1/2008	1/2009	1/2010	1/2011	1/2012	1/2013	1/2014	1/2015	
Normal	and	sustainable	
Rental	rates	in	excess	of	7%	
are	not	sustainable.	Long	
periods	of	excessive	
appreciagon	lead	to	a	crash.	
Falling/Correcgng	
Weak	
-50%	
-45%	
-40%	
-35%	
-30%	
-25%	
-20%	
-15%	
-10%	
-5%	
0%	
5%	
10%	
15%	
20%	
25%	
30%	
35%	
40%	
45%	
50%	
1/1989	1/1990	1/1991	1/1992	1/1993	1/1994	1/1995	1/1996	1/1997	1/1998	1/1999	1/2000	1/2001	1/2002	1/2003	1/2004	1/2005	1/2006	1/2007	1/2008	1/2009	1/2010	1/2011	1/2012	1/2013	1/2014	1/2015	
Normal	and	sustainable	
Appreciagon	rates	in	excess	of	7%	are	
not	sustainable.	Long	periods	of	
excessive	appreciagon	lead	to	a	crash.	
Falling/Correcgng
OC	Housing	News
info@ochousingnews.com
43	of	58
January	2016
Shevy	Akason
877-409-8515
Historic	Median	Home	Price	Relative	to	Rental	Parity:	San	Bernardino	County	since	January	1988
OCHN	Market	Timing	System	Rating:	San	Bernardino	County	since	January	1988
-70.0%	
-63.0%	
-56.0%	
-49.0%	
-42.0%	
-35.0%	
-28.0%	
-21.0%	
-14.0%	
-7.0%	
0.0%	
7.0%	
14.0%	
21.0%	
28.0%	
35.0%	
42.0%	
49.0%	
56.0%	
63.0%	
70.0%	
77.0%	
84.0%	
1/1989	1/1990	1/1991	1/1992	1/1993	1/1994	1/1995	1/1996	1/1997	1/1998	1/1999	1/2000	1/2001	1/2002	1/2003	1/2004	1/2005	1/2006	1/2007	1/2008	1/2009	1/2010	1/2011	1/2012	1/2013	1/2014	1/2015	1/2016	1/2017	
Discount	or	Premium	
Value	Relagve	to	Rental	Parity	 Historic	Norm	
Stable	period	between	
housing	bubbles	from	
1993-1999	establishes	
historic	norm.	
0	
1	
2	
3	
4	
5	
6	
7	
8	
9	
10	
1/1988	1/1989	1/1990	1/1991	1/1992	1/1993	1/1994	1/1995	1/1996	1/1997	1/1998	1/1999	1/2000	1/2001	1/2002	1/2003	1/2004	1/2005	1/2006	1/2007	1/2008	1/2009	1/2010	1/2011	1/2012	1/2013	1/2014	1/2015	1/2016	
Values	7-10:	Undervalued	Market:	
Strong	Buy	Recommendagon	
Values	4-6:	Neutral	Market,		
Weak	Buy	Recommendagon	
Values	1-3:	Inflated	or	
Weak	Market:	
Consider	Selling.		
Do	not	Buy.
OC	Housing	News
info@ochousingnews.com
44	of	58
January	2016
Shevy	Akason
877-409-8515
Cash	Investor	Capitalization	Rate:	San	Bernardino	County	since	January	1988
Financed	Investor	Cash-on-Cash	Return:	San	Bernardino	County	since	January	1988
0.0%	
2.0%	
4.0%	
6.0%	
8.0%	
10.0%	
12.0%	
14.0%	
1/1988	1/1989	1/1990	1/1991	1/1992	1/1993	1/1994	1/1995	1/1996	1/1997	1/1998	1/1999	1/2000	1/2001	1/2002	1/2003	1/2004	1/2005	1/2006	1/2007	1/2008	1/2009	1/2010	1/2011	1/2012	1/2013	1/2014	1/2015	1/2016	1/2017	
Capitalizagon	Rate	 Mortgage	Interest	Rate	
-30.0%	
-20.0%	
-10.0%	
0.0%	
10.0%	
20.0%	
30.0%	
40.0%	
50.0%	
1/1988	1/1989	1/1990	1/1991	1/1992	1/1993	1/1994	1/1995	1/1996	1/1997	1/1998	1/1999	1/2000	1/2001	1/2002	1/2003	1/2004	1/2005	1/2006	1/2007	1/2008	1/2009	1/2010	1/2011	1/2012	1/2013	1/2014	1/2015	1/2016	1/2017
OC	Housing	News
info@ochousingnews.com
45	of	58
January	2016
Shevy	Akason
877-409-8515
Median Resale	% Rent	% Median Cost	of Ownership
City Resale	$ Change	YoY Resale	$/SF Change	YoY Rent	$ Ownership Prem./Disc. Cap	Rate
Adelanto		 155,800$					 6.7% 98$													 11.7% 1,056$								 695$												 (361)$										 6.5%
Apple	Valley		 193,200$					 1.7% 110$											 3.5% 968$											 860$												 (107)$										 4.8%
Chino		 417,100$					 5.6% 238$											 5.3% 2,106$								 1,832$									 (274)$										 4.8%
Chino	Hills		 533,000$					 6.0% 308$											 -0.2% 2,289$								 2,397$									 108$												 4.1%
Colton		 222,600$					 8.6% 173$											 3.2% 1,242$								 981$												 (261)$										 5.4%
Fontana		 331,600$					 6.9% 195$											 0.6% 2,041$								 1,477$									 (564)$										 5.9%
Hesperia		 214,300$					 4.6% 116$											 3.4% 1,240$								 953$												 (287)$										 5.6%
Highland		 274,900$					 12.7% 167$											 -0.4% 1,670$								 1,196$									 (475)$										 5.8%
Joshua	Tree		 121,300$					 6.9% 95$													 -5.9% 824$											 531$												 (294)$										 6.5%
Loma	Linda		 332,500$					 0.0% 153$											 -0.1% 1,620$								 1,479$									 (141)$										 4.7%
Montclair		 345,800$					 8.1% 244$											 0.1% 1,656$								 1,535$									 (121)$										 4.6%
Ontario		 341,500$					 10.0% 245$											 0.6% 1,803$								 1,509$									 (293)$										 5.1%
Rancho	Cucamonga		 420,700$					 5.0% 248$											 0.8% 2,108$								 1,864$									 (245)$										 4.8%
Redlands		 330,800$					 8.3% 210$											 4.9% 1,711$								 1,482$									 (229)$										 5.0%
Rialto		 280,800$					 8.2% 180$											 5.7% 1,536$								 1,245$									 (291)$										 5.3%
San	Bernardino	(City)		 214,100$					 10.2% 159$											 2.1% 1,366$								 943$												 (423)$										 6.1%
Twentynine	Palms		 71,200$							 -7.4% 68$													 -13.3% 828$											 319$												 (509)$										 11.2%
Upland		 466,600$					 4.6% 262$											 10.2% 2,040$								 2,119$									 78$														 4.2%
Victorville		 195,100$					 7.1% 106$											 3.7% 1,274$								 873$												 (402)$										 6.3%
Yucaipa		 310,000$					 7.2% 177$											 8.8% 1,337$								 1,371$									 34$														 4.1%
Market	Performance	and	Trends:	San	Bernardino	County,	Major	Cities,	and	Zips
OC	Housing	News
info@ochousingnews.com
46	of	58
January	2016
Shevy	Akason
877-409-8515
Median Resale	% Rent	% Median Cost	of Ownership
City
Resale	$ Change	YoY Resale	$/SF Change	YoY Rent	$ Ownership Prem./Disc. Cap	Rate
Chino		91710 420,400$					 6.0% 246$											 6.7% 2,047$								 1,843$									 (205)$										 4.7%
Fontana		92336 388,300$					 5.4% 190$											 0.8% 2,172$								 1,723$									 (449)$										 5.4%
Fontana		92337 316,800$					 2.9% 195$											 -2.0% 1,740$								 1,416$									 (324)$										 5.3%
Grand	Terrace		92313 286,200$					 11.7% 187$											 6.4% 1,520$								 1,284$									 (235)$										 5.1%
Hesperia		92344 225,900$					 1.7% 106$											 4.1% 1,290$								 1,014$									 (276)$										 5.5%
Mentone		92359 321,200$					 6.6% 156$											 1.0% 1,195$								 1,409$									 214$												 3.6%
Ontario		91762 340,600$					 10.3% 244$											 -3.8% 1,471$								 1,501$									 30$														 4.1%
Rancho	Cucamonga		91701 437,800$					 5.0% 252$											 1.3% 2,036$								 1,957$									 (79)$												 4.5%
Rancho	Cucamonga		91730 353,800$					 7.2% 247$											 2.5% 1,890$								 1,585$									 (306)$										 5.1%
Rancho	Cucamonga		91737 467,500$					 -0.6% 252$											 3.1% 2,116$								 2,094$									 (21)$												 4.3%
Rancho	Cucamonga		91739 570,100$					 4.2% 246$											 -2.6% 2,626$								 2,510$									 (116)$										 4.4%
Redlands		92373 384,600$					 12.5% 235$											 2.1% 1,929$								 1,743$									 (187)$										 4.8%
Rialto		92376 263,300$					 7.7% 177$											 3.7% 1,478$								 1,174$									 (304)$										 5.4%
Rialto		92377 336,100$					 10.2% 190$											 14.2% 1,822$								 1,479$									 (343)$										 5.2%
San	Bernardino	(City)		92405 200,100$					 13.6% 159$											 10.9% 1,221$								 890$												 (331)$										 5.9%
San	Bernardino	(City)		92410 161,900$					 5.0% 149$											 6.4% 1,010$								 707$												 (302)$										 6.0%
Upland		91784 579,900$					 4.7% 258$											 7.4% 2,344$								 2,602$									 257$												 3.9%
Upland		91786 390,500$					 5.6% 267$											 10.4% 1,824$								 1,766$									 (58)$												 4.5%
Victorville		92392 199,200$					 9.0% 105$											 4.5% 1,246$								 893$												 (354)$										 6.0%
Victorville		92394 187,300$					 2.0% 101$											 1.6% 1,268$								 840$												 (428)$										 6.5%
Victorville		92395 191,000$					 9.4% 113$											 4.0% 1,205$								 846$												 (359)$										 6.1%
Market	Performance	and	Trends:	San	Bernardino	County,	Major	Cities,	and	Zips
OC	Housing	News
info@ochousingnews.com
47	of	58
January	2016
Shevy	Akason
877-409-8515
%	Over/Under Historic %	Over/Under
City Rating Median Rental	Parity Rental	Parity Premium Historic	Prem.
Adelanto		 10 155,800$						 235,600$					 -33.6% -3.8% -29.8%
Apple	Valley		 8 193,200$						 215,900$					 -11.0% 9.7% -20.7%
Chino		 8 417,100$						 469,700$					 -13.3% -9.0% -4.3%
Chino	Hills		 5 533,000$						 510,600$					 4.5% 6.6% -2.1%
Colton		 8 222,600$						 277,000$					 -21.2% -10.7% -10.5%
Fontana		 6 331,600$						 455,300$					 -28.0% -33.7% 5.7%
Hesperia		 8 214,300$						 276,700$					 -24.0% -21.2% -2.8%
Highland		 6 274,900$						 372,600$					 -28.6% -11.9% -16.7%
Joshua	Tree		 5 121,300$						 183,900$					 -35.4% -20.0% -15.4%
Loma	Linda		 8 332,500$						 361,400$					 -8.7% 34.8% -43.5%
Montclair		 5 345,800$						 369,500$					 -5.6% -6.0% 0.4%
Ontario		 6 341,500$						 402,100$					 -15.5% -3.9% -11.6%
Rancho	Cucamonga		 6 420,700$						 470,300$					 -12.1% -7.6% -4.4%
Redlands		 8 330,800$						 381,700$					 -12.0% -0.2% -11.8%
Rialto		 7 280,800$						 342,700$					 -19.8% -22.8% 3.0%
San	Bernardino	(City)		 7 214,100$						 304,700$					 -28.8% -28.5% -0.3%
Twentynine	Palms		 4 71,200$								 184,700$					 -60.6% -28.7% -31.9%
Upland		 7 466,600$						 455,200$					 2.7% 6.9% -4.1%
Victorville		 10 195,100$						 284,200$					 -30.8% -6.4% -24.4%
Yucaipa		 5 310,000$						 298,200$					 0.2% -9.2% 9.4%
Market	Timing	Rating	and	Valuations:	San	Bernardino	County,	Major	Cities,	and	Zips
OC	Housing	News
info@ochousingnews.com
48	of	58
January	2016
Shevy	Akason
877-409-8515
%	Over/Under Historic %	Over/Under
City Rating Median Rental	Parity Rental	Parity Premium Historic	Prem.
Chino		91710 8 420,400$						 456,700$					 -10.9% -7.4% -3.4%
Fontana		92336 5 388,300$						 484,600$					 -20.6% -33.2% 12.6%
Fontana		92337 5 316,800$						 388,200$					 -18.8% -20.6% 1.8%
Grand	Terrace		92313 8 286,200$						 339,000$					 -17.0% -7.2% -9.8%
Hesperia		92344 7 225,900$						 287,700$					 -21.5% -13.1% -8.4%
Mentone		92359 7 321,200$						 266,600$					 15.6% 28.1% -12.4%
Ontario		91762 3 340,600$						 328,200$					 2.0% 8.6% -6.7%
Rancho	Cucamonga		91701 6 437,800$						 454,200$					 -2.7% 3.1% -5.8%
Rancho	Cucamonga		91730 7 353,800$						 421,700$					 -17.3% -14.6% -2.7%
Rancho	Cucamonga		91737 9 467,500$						 472,000$					 -0.7% 23.9% -24.6%
Rancho	Cucamonga		91739 3 570,100$						 585,800$					 -4.4% -17.3% 12.9%
Redlands		92373 10 384,600$						 430,400$					 -5.2% 20.5% -25.7%
Rialto		92376 7 263,300$						 329,800$					 -21.9% -22.1% 0.3%
Rialto		92377 7 336,100$						 406,400$					 -19.0% -8.2% -10.8%
San	Bernardino	(City)		92405 6 200,100$						 272,300$					 -26.2% -18.6% -7.7%
San	Bernardino	(City)		92410 10 161,900$						 225,200$					 -28.5% -1.5% -27.0%
Upland		91784 7 579,900$						 523,000$					 8.7% 10.9% -2.2%
Upland		91786 8 390,500$						 406,900$					 -3.4% 8.5% -11.9%
Victorville		92392 10 199,200$						 278,000$					 -28.8% 3.8% -32.6%
Victorville		92394 8 187,300$						 282,900$					 -32.9% -14.4% -18.5%
Victorville		92395 9 191,000$						 268,700$					 -30.0% -9.8% -20.2%
Market	Timing	Rating	and	Valuations:	San	Bernardino	County,	Major	Cities,	and	Zips
OC	Housing	News
info@ochousingnews.com
49	of	58
January	2016
Shevy	Akason
877-409-8515
Historically,	properties	in	this	market	sell	at	a	15.8%	premium.	Today's	discount	is	12.2%.	This	market	is	28.0%	undervalued.
Median	home	price	is	$518,300	with	a	rental	parity	value	of	$583,000.	This	market's	discount	is	$64,700.
Monthly	payment	affordability	has	been	improving	over	the	last	9	month(s).	Momentum	suggests	improving	affordability.
Resale	prices	on	a	$/SF	basis	increased	from	$320/SF	to	$322/SF.	Resale	prices	have	been	rising	for	1	month(s).
Over	the	last	12	months,	resale	prices	rose	8.9%	indicating	a	longer	term	upward	price	trend.
Median	rental	rates	declined	$32	last	month	from	$2,645	to	$2,613.	The	current	capitalization	rate	(rent/price)	is	4.8%.
Rents	have	been	rising	for	12	month(s).	Price	momentum	signals	rising	rents	over	the	next	three	months.
Market	rating	=	10
Median	Home	Price	and	Rental	Parity	trailing	twelve	months
Date Rating Median	 Rental	Parity Historic	Value
1/2015 10 501,900$			 558,500$				 646,955$			
2/2015 10 506,100$			 557,900$				 646,260$			
3/2015 10 507,900$			 557,600$				 645,913$			
4/2015 10 513,800$			 572,200$				 662,825$			
5/2015 10 515,900$			 577,200$				 668,617$			
6/2015 10 522,600$			 588,800$				 682,054$			
7/2015 10 523,400$			 583,900$				 676,378$			
8/2015 10 523,400$			 597,600$				 692,248$			
9/2015 10 523,100$			 591,500$				 685,182$			
10/2015 10 521,900$			 601,800$				 697,113$			
11/2015 10 519,400$			 591,600$				 685,297$			
12/2015 10 518,300$			 583,000$				 675,335$			
Resale	$/SF	and	year-over-year	percentage	change	trailing	twelve	months
Date ±	Typ.	Value $/SF %	Change
1/2015 -26.0% 296$											 2.3%
2/2015 -25.8% 297$											 2.3%
3/2015 -25.3% 302$											 3.8%
4/2015 -25.3% 307$											 4.9%
5/2015 -25.8% 312$											 6.0%
6/2015 -26.5% 317$											 6.9%
7/2015 -26.6% 319$											 6.5%
8/2015 -27.2% 320$											 6.7%
9/2015 -27.3% 321$											 7.0%
10/2015 -28.3% 321$											 7.1%
11/2015 -28.2% 320$											 7.3%
12/2015 -28.0% 322$											 8.9% 1/0/00
Rental	rate	and	year-over-year	percentage	change	trailing	twelve	months
Date %	Change Rent Own Historic	Cost	to	Own	Relative	to	Rent
1/2015 8.2% 2,428$							 2,215$									 2,813$								
2/2015 6.9% 2,426$							 2,199$									 2,810$								
3/2015 7.0% 2,443$							 2,202$									 2,829$								
4/2015 6.8% 2,476$							 2,216$									 2,868$								
5/2015 6.8% 2,550$							 2,242$									 2,954$								
6/2015 7.1% 2,646$							 2,283$									 3,065$								
7/2015 7.3% 2,646$							 2,333$									 3,065$								
8/2015 6.8% 2,663$							 2,350$									 3,084$								
9/2015 4.9% 2,629$							 2,343$									 3,045$								
10/2015 4.7% 2,646$							 2,317$									 3,064$								
11/2015 4.0% 2,646$							 2,314$									 3,064$								
12/2015 3.8% 2,613$							 2,313$									 3,027$								
Ventura	County	Housing	Market	News
	$-		
	$200,000		
	$400,000		
	$600,000		
	$800,000		
1/2015	2/2015	3/2015	4/2015	5/2015	6/2015	7/2015	8/2015	9/2015	10/2015	11/2015	12/2015	
Median		 Rental	Parity	 Historic	Value	
	$296			$297		
	$302		
	$307		
	$312		
	$317			$319		
	$320			$321			$321			$320			$322		
$290	
$295	
$300	
$305	
$310	
$315	
$320	
$325	
1/2015	2/2015	3/2015	4/2015	5/2015	6/2015	7/2015	8/2015	9/2015	10/2015	11/2015	12/2015	
	$2,428		
	$2,426		
	$2,443		
	$2,476		
	$2,550		
	$2,646		
	$2,646		
	$2,663		
	$2,629		
	$2,646		
	$2,646		
	$2,613		
$1,400	
$1,900	
$2,400	
$2,900	
$3,400	
1/2015	2/2015	3/2015	4/2015	5/2015	6/2015	7/2015	8/2015	9/2015	10/2015	11/2015	12/2015	
Rent	 Own	 Historic	Cost	to	Own	Relagve	to	Rent
OC	Housing	News
info@ochousingnews.com
50	of	58
January	2016
Shevy	Akason
877-409-8515
Ventura	County	median	home	price	since	January	1988
Ventura	County	median	rent	and	monthly	cost	of	ownership	since	January	1988
$0	
$100,000	
$200,000	
$300,000	
$400,000	
$500,000	
$600,000	
$700,000	
$800,000	
1/1988	1/1989	1/1990	1/1991	1/1992	1/1993	1/1994	1/1995	1/1996	1/1997	1/1998	1/1999	1/2000	1/2001	1/2002	1/2003	1/2004	1/2005	1/2006	1/2007	1/2008	1/2009	1/2010	1/2011	1/2012	1/2013	1/2014	1/2015	1/2016	1/2017	
Median	Resale	 Rental	Parity	 Historic	Value	 Projecgon	
$0	
$500	
$1,000	
$1,500	
$2,000	
$2,500	
$3,000	
$3,500	
$4,000	
1/1988	1/1989	1/1990	1/1991	1/1992	1/1993	1/1994	1/1995	1/1996	1/1997	1/1998	1/1999	1/2000	1/2001	1/2002	1/2003	1/2004	1/2005	1/2006	1/2007	1/2008	1/2009	1/2010	1/2011	1/2012	1/2013	1/2014	1/2015	1/2016	1/2017	
Median	Rent	 Cost	to	Own	 Historic	Cost	to	Own	Relagve	to	Rent
OC	Housing	News
info@ochousingnews.com
51	of	58
January	2016
Shevy	Akason
877-409-8515
Resale	$/SF	Year-over-Year	Percentage	Change:	Ventura	County	since	January	1989
Rental	$/SF	Year-over-Year	Percentage	Change:	Ventura	County	since	January	1989
-8%	
-6%	
-4%	
-2%	
0%	
2%	
4%	
6%	
8%	
10%	
12%	
14%	
16%	
18%	
1/1989	1/1990	1/1991	1/1992	1/1993	1/1994	1/1995	1/1996	1/1997	1/1998	1/1999	1/2000	1/2001	1/2002	1/2003	1/2004	1/2005	1/2006	1/2007	1/2008	1/2009	1/2010	1/2011	1/2012	1/2013	1/2014	1/2015	
Normal	and	
sustainable	
Rental	rates	in	excess	of	7%	
are	not	sustainable.	Long	
periods	of	excessive	
appreciagon	lead	to	a	crash.	
Falling/Correcgng	
Weak	
-50%	
-45%	
-40%	
-35%	
-30%	
-25%	
-20%	
-15%	
-10%	
-5%	
0%	
5%	
10%	
15%	
20%	
25%	
30%	
35%	
40%	
45%	
50%	
1/1989	1/1990	1/1991	1/1992	1/1993	1/1994	1/1995	1/1996	1/1997	1/1998	1/1999	1/2000	1/2001	1/2002	1/2003	1/2004	1/2005	1/2006	1/2007	1/2008	1/2009	1/2010	1/2011	1/2012	1/2013	1/2014	1/2015	
Normal	and	sustainable	
Appreciagon	rates	in	excess	of	7%	are	
not	sustainable.	Long	periods	of	
excessive	appreciagon	lead	to	a	crash.	
Falling/Correcgng
OC	Housing	News
info@ochousingnews.com
52	of	58
January	2016
Shevy	Akason
877-409-8515
Historic	Median	Home	Price	Relative	to	Rental	Parity:	Ventura	County	since	January	1988
OCHN	Market	Timing	System	Rating:	Ventura	County	since	January	1988
-42.0%	
-35.0%	
-28.0%	
-21.0%	
-14.0%	
-7.0%	
0.0%	
7.0%	
14.0%	
21.0%	
28.0%	
35.0%	
42.0%	
49.0%	
56.0%	
63.0%	
70.0%	
77.0%	
84.0%	
91.0%	
98.0%	
105.0%	
112.0%	
119.0%	
126.0%	
1/1988	1/1989	1/1990	1/1991	1/1992	1/1993	1/1994	1/1995	1/1996	1/1997	1/1998	1/1999	1/2000	1/2001	1/2002	1/2003	1/2004	1/2005	1/2006	1/2007	1/2008	1/2009	1/2010	1/2011	1/2012	1/2013	1/2014	1/2015	1/2016	1/2017	
Discount	or	Premium	
Value	Relagve	to	Rental	Parity	 Historic	Norm	
Stable	period	between	
housing	bubbles	from	
1993-1999	establishes	
historic	norm.	
0	
1	
2	
3	
4	
5	
6	
7	
8	
9	
10	
1/1988	
1/1989	
1/1990	
1/1991	
1/1992	
1/1993	
1/1994	
1/1995	
1/1996	
1/1997	
1/1998	
1/1999	
1/2000	
1/2001	
1/2002	
1/2003	
1/2004	
1/2005	
1/2006	
1/2007	
1/2008	
1/2009	
1/2010	
1/2011	
1/2012	
1/2013	
1/2014	
1/2015	
1/2016	
1/2017	
Values	7-10:	Undervalued	Market:	
Strong	Buy	Recommendagon	
Values	4-6:	Neutral	Market,		
Weak	Buy	Recommendagon	
Values	1-3:	Inflated	or	
Weak	Market:	
Consider	Selling.		
Do	not	Buy.
OC	Housing	News
info@ochousingnews.com
53	of	58
January	2016
Shevy	Akason
877-409-8515
Cash	Investor	Capitalization	Rate:	Ventura	County	since	January	1988
Financed	Investor	Cash-on-Cash	Return:	Ventura	County	since	January	1988
0.0%	
2.0%	
4.0%	
6.0%	
8.0%	
10.0%	
12.0%	
1/1988	1/1989	1/1990	1/1991	1/1992	1/1993	1/1994	1/1995	1/1996	1/1997	1/1998	1/1999	1/2000	1/2001	1/2002	1/2003	1/2004	1/2005	1/2006	1/2007	1/2008	1/2009	1/2010	1/2011	1/2012	1/2013	1/2014	1/2015	1/2016	1/2017	
Capitalizagon	Rate	 Mortgage	Interest	Rate	
-35.0%	
-30.0%	
-25.0%	
-20.0%	
-15.0%	
-10.0%	
-5.0%	
0.0%	
5.0%	
10.0%	
15.0%	
1/1988	1/1989	1/1990	1/1991	1/1992	1/1993	1/1994	1/1995	1/1996	1/1997	1/1998	1/1999	1/2000	1/2001	1/2002	1/2003	1/2004	1/2005	1/2006	1/2007	1/2008	1/2009	1/2010	1/2011	1/2012	1/2013	1/2014	1/2015	1/2016	1/2017
OC	Housing	News
info@ochousingnews.com
54	of	58
January	2016
Shevy	Akason
877-409-8515
Median Resale	% Rent	% Median Cost	of Ownership
City Resale	$ Change	YoY Resale	$/SF Change	YoY Rent	$ Ownership Prem./Disc. Cap	Rate
Camarillo		 530,000$					 8.5% 311$											 2.6% 2,517$								 2,363$									 (154)$										 4.6%
Moorpark		 607,800$					 8.7% 284$											 1.6% 2,495$								 2,688$									 193$												 3.9%
Newbury	Park		 635,300$					 4.5% 321$											 2.7% 2,784$								 2,837$									 52$														 4.2%
Oak	Park		 616,100$					 4.0% 366$											 7.1% 2,529$								 2,778$									 249$												 3.9%
Oxnard		 421,700$					 13.0% 299$											 18.0% 2,139$								 1,891$									 (248)$										 4.9%
Port	Hueneme		 339,300$					 -3.4% 262$											 6.1% 1,531$								 1,492$									 (39)$												 4.3%
Simi	Valley		 496,900$					 10.0% 296$											 1.0% 2,358$								 2,218$									 (140)$										 4.6%
Thousand	Oaks		 621,000$					 1.8% 343$											 7.2% 2,675$								 2,772$									 97$														 4.1%
Ventura		 500,300$					 11.5% 356$											 0.3% 2,003$								 2,203$									 200$												 3.8%
Westlake	Village		 780,200$					 13.8% 395$											 9.1% 2,678$								 3,524$									 847$												 3.3%
Camarillo		93010 524,500$					 5.4% 310$											 7.7% 2,340$								 2,360$									 20$														 4.3%
Newbury	Park		91320 634,200$					 4.6% 322$											 3.1% 2,784$								 2,832$									 48$														 4.2%
Oxnard		93033 367,300$					 15.7% 398$											 -8.3% 1,916$								 1,599$									 (318)$										 5.0%
Oxnard		93035 537,800$					 12.5% 221$											 16.7% 2,237$								 2,415$									 178$												 4.0%
Port	Hueneme		93041 329,500$					 -3.5% 262$											 6.0% 1,531$								 1,456$									 (75)$												 4.5%
Simi	Valley		93063 491,700$					 10.0% 293$											 0.9% 2,621$								 2,197$									 (423)$										 5.1%
Simi	Valley		93065 500,300$					 9.2% 298$											 7.3% 2,290$								 2,241$									 (49)$												 4.4%
Thousand	Oaks		91360 592,100$					 -1.8% 333$											 6.4% 2,530$								 2,640$									 110$												 4.1%
Thousand	Oaks		91362 670,300$					 9.0% 349$											 6.1% 2,895$								 3,008$									 113$												 4.1%
Ventura		93004 501,800$					 20.8% 297$											 7.3% 2,391$								 2,223$									 (168)$										 4.6%
Westlake	Village		91361 781,700$					 9.9% 412$											 12.7% 2,913$								 3,469$									 556$												 3.6%
Market	Performance	and	Trends:	Ventura	County,	Major	Cities,	and	Zips
OC	Housing	News
info@ochousingnews.com
55	of	58
January	2016
Shevy	Akason
877-409-8515
%	Over/Under Historic %	Over/Under
City Rating Median Rental	Parity Rental	Parity Premium Historic	Prem.
Camarillo		 10 530,000$						 561,500$					 -6.2% 26.7% -32.9%
Moorpark		 6 607,800$						 556,500$					 4.8% 17.6% -12.9%
Newbury	Park		 9 635,300$						 621,100$					 -0.4% 14.3% -14.8%
Oak	Park		 10 616,100$						 564,300$					 6.6% 37.8% -31.2%
Oxnard		 9 421,700$						 477,100$					 -12.8% 12.2% -24.9%
Port	Hueneme		 9 339,300$						 341,500$					 -1.3% 28.7% -29.9%
Simi	Valley		 6 496,900$						 526,100$					 -9.1% 3.1% -12.1%
Thousand	Oaks		 8 621,000$						 596,800$					 1.3% 26.5% -25.2%
Ventura		 7 500,300$						 446,800$					 12.4% 33.5% -21.1%
Westlake	Village		 8 780,200$						 597,400$					 36.3% 58.7% -22.5%
Camarillo		93010 10 524,500$						 522,100$					 1.4% 29.5% -28.1%
Newbury	Park		91320 9 634,200$						 621,100$					 -0.6% 14.3% -14.9%
Oxnard		93033 8 367,300$						 427,500$					 -16.4% 27.3% -43.7%
Oxnard		93035 9 537,800$						 499,000$					 5.1% 34.5% -29.4%
Port	Hueneme		93041 10 329,500$						 341,500$					 -3.7% 28.6% -32.3%
Simi	Valley		93063 7 491,700$						 584,600$					 -16.2% 7.4% -23.6%
Simi	Valley		93065 6 500,300$						 510,900$					 -2.6% 1.9% -4.4%
Thousand	Oaks		91360 8 592,100$						 564,400$					 1.3% 19.8% -18.6%
Thousand	Oaks		91362 10 670,300$						 645,800$					 1.1% 45.4% -44.3%
Ventura		93004 10 501,800$						 533,400$					 -7.1% 32.2% -39.3%
Westlake	Village		91361 10 781,700$						 649,800$					 15.0% 66.5% -51.5%
Market	Timing	Rating	and	Valuations:	Ventura	County,	Major	Cities,	and	Zips
OC	Housing	News
info@ochousingnews.com
56	of	58
January	2016
Shevy	Akason
877-409-8515
OC	Housing	News	Monthly	Market	Report	
	
OC	Housing	News	monthly	market	report	and	newsleler	provides	a	clear	picture	of	the	health	of	the	housing	market.	Both	buyers	and	sellers	find	the	
informagon	on	locagon,	valuagon,	and	price	trends,	gmely	and	relevant	to	their	decision	to	buy	or	sell	a	home.	The	OC	Housing	News	report	answers	the	
most	important	quesgons	to	buyers	and	sellers:	(1)	Where	should	I	look	for	bargains,	(2)	Are	current	prices	over	or	under	valued	in	my	area,	and	(3)	what	
direcgon	are	prices	headed,	up	or	down	in	my	area?	Armed	with	beler	informagon,	people	make	beler	decisions.	
	
There	is	too	much	informagon	about	housing	floagng	around	the	Internet,	and	most	of	it	is	bad.	It	is	easy	to	take	data	and	create	prely	charts	and	graphs	
that	don't	provide	any	useful	informagon	someone	might	use	to	make	a	good	decision.	The	OC	Housing	News	has	eliminated	the	useless	informagon	and	
disglled	the	market	down	to	three	key	pieces	of	informagon:	(1)	resale	value	relagve	to	rent,	(2)	yearly	change	in	resale	prices,	and	(3)	yearly	changes	in	
rents.	
	
Using	the	OCHN	Monthly	Report	
	
When	most	people	are	considering	rengng	or	buying	a	home,	they	already	have	narrowed	their	choices	for	locagon.	Most	want	to	be	near	work,	but	they	
may	also	want	to	be	near	family,	friends,	or	a	pargcular	school	district.	The	table	of	contents	on	the	front	page	of	the	OCHN	monthly	report	organizes	the	
reports	by	county	so	people	can	narrow	their	search	to	the	area	they	are	most	interested	in.	I	suggest	searchers	start	with	the	overview	of	the	county	as	this	
provides	important	data	on	the	broader	real	estate	market.	
	
InterpreJng	an	OCHN	Monthly	Market	Report	
	
The	first	page	of	a	county	report	breaks	down	into	four	parts:	The	news	overview,	Median	Home	Price	and	Rental	Parity	trailing	twelve	months,	Resale	$/SF	
and	year-over-year	percentage	change	trailing	twelve	months,	Rental	rate	and	year-over-year	percentage	change	trailing	twelve	months.		
	
NEWS	OVERVIEW	
		
The	news	overview	provides		
concise	descripgons	of	the	facts		
and	condigons	in	the	market.	It		
states	whether	the	market	trades		
at	a	premium	or	a	discount	to		
rental	parity	and	provides	a		
measure	of	it.	A	market	trading	at		
a	premium	to	rental	parity	is	more		
desirable,	so	buyers	are	willing	to		
pay	more	than	rental	parity	to	live		
there.	A	market	trading	at	a		
discount	is	less	desirable,	and		
people	must	be	mogvated	to	live	there	by	saving	versus	rengng.	The	news	overview	measures	the	current	premium	or	discount,	compares	it	to	the	historic	
premium	or	discount,	and	states	whether	the	market	is	currently	overvalued	or	undervalued.	This	is	an	important	measure	of	future	financial	performance.	
	
MEDIAN	HOME	PRICE	AND	RENTAL	PARITY	TRAILING	TWELVE	MONTHS	
	
For	those	who	want	the	bolom	line	without	all	the	analysis	and	detail,	the	market	ragng	is	the	first	row	of	the	first	secgon	of	data.	The	ragng	encapsulates	
all	the	condigons	of	the	market	into	one	figure.	Suffice	to	say	that	a	ragng	of	10	is	good	and	a	ragng	of	1	is	bad.	Buyers	can	rest	assured	that	a	highly	rated	
property	or	market	is	a	good	financial	buy.	
		
The	chart	displays	three	lines	that	reveal		
much	about	the	market.	The	first	two	lines		
to	note	are	the	parallel	green	and	orange		
lines,	rental	parity	(green)	and	historic	value		
(orange).	As	mengoned	previously,	some		
markets	trade	at	a	discount	and	some	at	a		
premium	to	rental	parity.	If	the	orange	line		
(historic	value)	is	above	the	green	line		
(rental	parity),	the	market	is	a	premium		
market.	If	the	orange	line	(historic	value)	is		
below	the	green	line	(rental	parity),	the		
market	is	a	discount	market.	The	larger	the		
gap,	the	greater	the	premium	or	discount	is.	
	
The	third	line	ploled	against	these	two	parallel	lines	is	the	median	resale	price	for	the	area.	This	line	reveals	whether	the	market	is	currently	trading	at	a	
premium	or	discount	to	rental	parity	and	historic	value.	The	more	important	of	these	relagonships	is	between	median	resale	price	and	historic	value.	Over	
gme,	the	market	has	shown	a	tendency	toward	trading	at	historic	value.	If	it	trades	above	for	a	while,	over	gme	it	will	revert	back	to	this	value.	That	may	
happen	either	by	an	extended	period	of	lille	or	no	appreciagon	or	an	outright	decline	in	prices.	If	the	market	trades	below	its	historic	value,	it’s	likely	to	see	
a	rebound	back	to	this	value	in	the	future.	The	best	markets	are	those	trading	at	a	steep	discount	to	its	historic	value.
OC	Housing	News
info@ochousingnews.com
57	of	58
January	2016
Shevy	Akason
877-409-8515
RESALE	$/SF	AND	YEAR-OVER-YEAR	PERCENTAGE	CHANGE	TRAILING	TWELVE	MONTHS	
	
Since	the	historic	value	is	so	important,	the	first	column	in	next	secgon	displays	the	premium	or	discount	from	historic	value	over	the	last	year.	The	second	
column	and	the	chart	shows	the	dollars-per-square-foot	resale	price	in	the	market.	The	line	on	the	chart	visually	shows	the	general	direcgon	of	prices,	and	
the	third	column	shows	the	actual	percentage	change.		
	
It’s	important	to	note	that	the	percentage		
change	in	resale	prices	can	be	misleading.		
Most	buyers	foolishly	extrapolate	short-term		
movements	in	market	prices	will	congnue		
forever,	mogvagng	them	to	buy	at	what	is		
oren	the	worst	possible	gme.	In	reality,		
buying	in	a	declining	market	when	valuagons		
are	low	is	generally	the	best	gme	to	buy		
because	sellers	are	mogvated	and	supply	is		
abundant.	Buying	in	an	appreciagng	market		
may	not	be	wise,	pargcularly	if	valuagon		
signals	a	bubble.	In	short,	valuagon	is	much		
more	important	that	price	movement.	
 	
RENTAL	RATE	AND	YEAR-OVER-YEAR	PERCENTAGE	CHANGE	TRAILING	TWELVE	MONTHS	
	
The	final	table	and	chart	on	the	page	is	similar	to	the	first	grouping;	it	displays	three	lines,	two	of	which	are	parallel	and	show	current	rent	and	the	historic	
cost	of	ownership	relagve	to	rent,	and	the	third	line	is	the	current	cost	of	ownership.	The	relagonships	are	similar,	the	charts	will	look	similar,	and	the	
interpretagons	are	the	same.	
	
This	method	of	looking	at	the	data	is	more		
revealing	to	those	who	like	to	focus	on		
monthly	costs	rather	than	purchase	price.	It		
reveals	how	affordable	properges	are	relagve		
to	monthly	rent,	which	is	what	rental	parity		
analysis	is	all	about.	The	first	column	of	data		
shows	the	rate	of	rent	growth	over	the	last		
year,	and	the	next	two	columns	show	the		
cost	of	rengng	and	the	cost	of	owning	during		
the	same	period.	
 	
HISTORIC	MARKET	DATA	CHARTS	
	
The	next	page	of	the	report	shows	two	charts:		
County	median	home	price	since	January	1988,	
and	County	median	rent	and	monthly	cost	of		
ownership	since	January	1988.	These	charts		
are	designed	to	put	current	circumstances	in		
historic	context.	They	answer	quesgons	like,		
“How	volagle	are	prices?”	and	“How	does		
today’s	pricing	compare	to	the	fluctuagons	of		
the	past?”	and	“How	much	danger	is	there	in		
buying	today?”	
	
The	chart	above	displays	LA	County	through		
early	2014,	but	the	palern	is	similar	across		
California.	With	the	green	line	for	rental	parity		
and	the	orange	line	for	historic	value,	it’s	easy		
to	tell	when	the	market	is	fairly	valued,	over		
valued,	or	under	valued.	
	
HISTORIC	VALUATION	
	
The	next	page	in	the	report	shows	two	charts:		
Historic	Median	Home	Price	Relagve	to	Rental		
Parity:	County	since	January	1988,	and	OCHN		
Market	Timing	System	Ragng:	Los	Angeles	County	since	January	1988.	
		
The	chart	on	historic	valuagon	shows,	at	a	glance,	how	close	the	market	trades	to	its	historic	norm.	The	benchmark	period	is	shown	in	green,	and	the	degree	
of	market	volaglity	can	be	inferred	from	the	scale	to	the	ler.	For	example,	LA	County	traded	for	as	much	as	42%	below	rental	parity	and	84%	above	it	during	
the	26-year	period	shown.	Needless	to	say,	that	is	very	volagle,	and	people	who	bought	during	the	overvalued	periods	endured	painful	price	correcgons	
when	their	houses	were	worth	far	less	than	they	paid.
OC	Housing	News
info@ochousingnews.com
58	of	58
January	2016
Shevy	Akason
877-409-8515
OCHN	RATING	SYSTEM	CHART	
		
The	market	gming	ragng	system		
mechanically	idengfies	both	good	and	buy		
dimes	to	buy	based	on	valuagon,	resale	price		
change,	and	rental	rate	change.	Since	1988,		
in	LA	County,	it	was	wrong	in	its		
recommendagon	in	only	a	single	two-year		
period	from	late	1999	to	mid	2001	as	the		
local	economy	gpped	into	a	recession.	The		
system	correctly	idengfied	the	housing		
bubbles	from	the	late	80s	and	the	mid	00s		
as	well	as	the	buying	opportuniges	in	the		
mid	90s	and	early	10s.	
	
MARKET	PERFORMANCE	AND		
TRENDS	TABLE	
	
The	market	performance	trends	table	provides		
a	tabular	summary	of	the	current	market		
condigons	by	city	and	zip	within	the	county.	It		
displays	the	same	performance	metrics		
detailed	in	previous	secgons	including:	median		
resale	price,	resale	percentage	change		
year-over-year,	resale	dollars-per-square-foot,	rent	percentage	change	year-over-year,	median	rent,	monthly	cost	of	ownership,	the	ownership	premium	or	
discount	based	on	rent,	and	the	capitalizagon	rate.	For	how	to	interpret	these	numbers	see	previous	secgons	for	more	detail.	
	
To	use	these	tables	effecgvely,	users	should		
have	a	short	list	of	potengal	ciges	they		
would	consider	living	in.	These	tables	allow		
the	user	to	search	alphabegcally	for	city		
data.	It’s	suggested	to	consult	both	the	city		
data	and	the	zip	code	data	that	oren		
provides	more	detail,	pargcularly	in	larger		
ciges	that	may	have	significant		
neighborhood	variability.	For	example,	in		
Canyon	Country,	the	two	zip	codes		
demonstrate	that	91387	is	more	desirable		
than	91351	because	the	former	costs	more		
to	own	than	to	rent	whereas	the	later	costs		
more	to	rent	than	to	own.	
	
By	compiling	and	comparing	data	from	the	various	ciges	in	a	users	search	area,	they	can	determine	how	much	they	would	have	to	spend	to	either	own	or	
rent	in	each	area,	suggesgng	how	desirable	and	affordable	each	area	is.	This	will	also	allow	users	to	eliminate	areas	they	may	not	be	able	to	afford.	
	
MARKET	TIMING	RATING	AND	VALUATIONS	TABLE	
	
The	next	table	shows	the	ragngs	and		
valuagons	for	each	city	and	zip	within	the		
county.	This	informagon	is	most	valuable	for		
those	hungng	for	bargain	properges	or	fearful		
of	overpaying	in	an	overvalued	market.	
	
In	the	example	above	Artesia	is	a	prime	market		
for	buying	a	home.	The	market	usually	trades		
at	a	12.9%	premium	to	rental	parity,	but	at	the		
gme	of	this	report,	it	was	trading	at	a	16.9%		
discount,	making	it	29.6%	undervalued!	A		
buyer	in	this	market	should	experience	above		
average	appreciagon	as	the	market	rebounds		
to	its	historic	norm.	This	table	helps	buyers		
spot	those	markets	where	the	best	deals	are		
to	be	found.	Helping	buyers	target	their		
search	to	where	deals	are	best	is	the	primary		
value	of	this	report.

Oc housing news