1) T-regulatory cells (Tregs), which help suppress inflammation, were significantly lower in omental adipose tissue compared to subcutaneous adipose tissue in adults with obesity. 2) Lower levels of Tregs in omental adipose tissue were associated with higher fasting glucose levels and lower beta-cell function. 3) The study assessed immune cell populations like Tregs, macrophages, and T effector cells in different adipose tissue depots and their relationship to markers of type 2 diabetes risk.

![humans is limited (9-13). Therefore, the aim of this study was to
use live cell sorting to determine the relative quantity of Foxp31
Treg cells, CD41 Teffector cells, and macrophage populations
(anti-inflammatory CD45 1
CD14 1
CD1631
-M2 and proinflamma-
tory CD451
CD141
CD1632
-M1), paired with immunohistochemis-
try quantification of macrophages (crown-like structures, CLS),
across multiple adipose depots, including the omentum. Our objec-
tives were threefold: (1) characterize the immune cell repertoire of
multiple AT depots in patients who have excess weight or who have
obesity, (2) examine relationships between immune cells in circula-
tion and AT with fasting markers of type 2 diabetes risk, and (3)
test whether these associations differed by race/ethnicity. We
hypothesized increased AT inflammation in the omental relative to
subcutaneous (subQ) depot and that lower levels of omental Tregs
would be related to increased diabetes risk. We further hypothesized
that omental Tregs would be lowest in African Americans with obe-
sity followed by Hispanics and white patients, potentially contribut-
ing to observed health disparities in these racial/ethnic groups.
Methods
This study was conducted at the University of Southern California
(USC) Health Sciences Campus, Keck Hospital of USC and Los
Angeles County 1 USC Medical Center. Forty-four patients (body
mass index (BMI) 25 kg/m2
) who underwent elective abdominal
surgery (bariatric, cholecystectomy, or hernia repair) were recruited
for this study, and a subset 37 has complete flow cytometry data.
These male and female participants were between 20 and 56 years
of age, without type 1 or type 2 diabetes, and did not use related
medications. Patients with inflammatory disease or uncontrolled sys-
temic disease were excluded. Prior to sample collection, informed
written consent was obtained from the participant. The USC Institu-
tional Review Board approved this study.
Participant characteristics
Anthropometry, including height, weight and BMI, and medical his-
tory were collected from patient medical records. Participants self-
identified their race/ethnicity upon consent to study.
Sample collection
Prior to onset of surgery, 12 mL of blood was collected (8 mL for
flow cytometry and 4 mL for fasting blood sample). During the sur-
gery, 2 g of AT were collected from each abdominal depot: subQ
just adjacent to the skin, DsubQ superficial to the rectus abdominus
fascia (14), and intra-abdominally from the omental depot. AT was
rinsed three times with cold sterile saline, 100 mg was immediately
fixed in zinc-formalin for histology and the remaining sample
(1.5 g) was placed in ice cold PBS for flow cytometry.
AT histology
AT samples were placed in zinc-formalin for 24 h, rinsed, and trans-
ferred to 70% ethanol for immunohistochemistry. Four consecutive, 5
l sections of AT were stained with hematoxylin-eosin and CD68 anti-
body (Leica Biosystems, Newcastle, UK). For each depot, four inde-
pendent fields at 203 magnification were captured from the first
mounted section on each slide for cell sizing. Adipose cell size (lm2
)
was obtained using Fiji quantitative microscopy software (15), and the
mean value for adipose cell size was obtained per depot. Similar to
our previous study (16), all sections were examined by a single
blinded technician for the presence or absence of macrophage CLS.
Flow cytometry: AT and blood
Fresh AT samples were weighed and digested with 200 U/mL Type-
IV-collagenase (Worthington Biochemical Corporation, Lakewood,
NJ) at 378C for 1 h. Ficoll density centrifugation was used to collect
plasma and mononuclear cells from the whole blood sample. Cells
from the stromal vascular fraction of the AT and blood sample were
stained with the following antibody surface markers: CD45, CD4,
CD14, CD25, CD163 (ebioscience, San Diego, CA). Thereafter, cells
were fixed, permeabilized, and stained for the intracellular FOXP3
expression (ebioscience, San Diego, CA). Macrophage/monocytes and
T-cell subsets were then isolated using the eight-color BD FACS Aria
III cell sorter and data were acquired using BD FACS Diva (BD Bio-
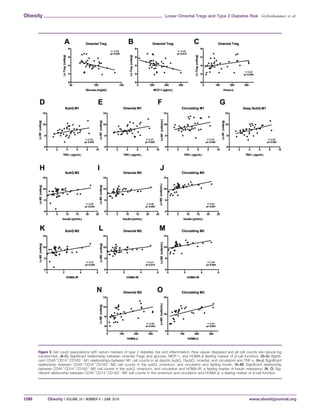
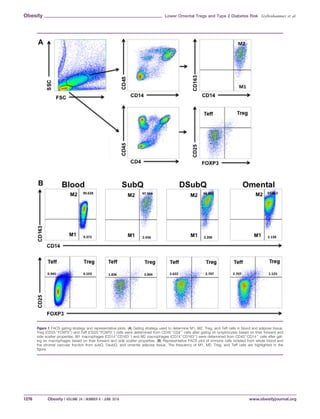
science, San Jose, CA). The following gating strategies were used to
isolate the immune cells of interest: CD451
CD141
CD1632
cells
were used to isolate M1 macrophages, CD451
CD141
CD1631
were
used to isolate M2 macrophages, CD451
CD41
CD251
FOXP31
were used to isolate regulatory T cells, and CD451
CD41
CD251
FOXP32
were used to isolate T effector cells (Figure 1). Flowjo X
software (Ashland, OR) was used to quantify the number of CD451
CD141
CD1632
-M1, CD451
CD141
CD1631
-M2, Treg, and Teff
subsets, which were back calculated to the total cell count and normal-
ized to the AT weight or mL blood as previously described (17). We
selected cells/g or cells/mL as our normalization strategy since it
could be compared across all cell types and since % cell can be altered
by the presence of other cell types (18,19).
Assays and metabolic measures
Glucose was assayed on a Yellow Springs Instrument 2710 Analyzer
(Yellow Springs, OH) using the glucose oxidase method, and insulin
was assayed using a specific human ELISA kit from EMD Millipore (St.
Charles, MO). Adipocytokines [including IL-6, MCP-1, tumor necrosis
factor (TNF)-a] and leptin were assayed using the magnetic bead-based
multiplex ELISA (#HADK2MAG-61K-08, EMD-Millipore) on a Lumi-
nex MAGPIX (intra-assay and inter-assay variability of 10%). C-
reactive protein (CRP) was assayed using a human ELISA kit from
Millipore (St. Charles, MO). Homeostasis model assessment-insulin
resistance (HOMA-IR) and a marker of b-cell function (HOMA-b) was
calculated according to the following formula: HOMA-IR 5 fasting
insulin [lU/mL] 3 fasting glucose [mg/dL]/405, while HOMA-b 5 360
3 fasting insulin [lU/mL]/fasting glucose [mg/dL]2 63. Patients were
labeled as prediabetic if their fasting glucose 100 mg/dL or identified
as prediabetic in their medical charts.
Statistical analysis
Linear mixed effects regression models, using repeated measures,
were used to analyze the ethnic and depot differences in immune
cell counts, average adipocyte size, and CLS status (1/2); depot
difference by ethnicity status was examined by the interaction term
(ethnicity 3 depot). These models accounted for the correlation
between repeated adipose measurements within participants using
the conditional correlation structure (selected for best fit by lowest
IC values). Within each depot, associations between cell counts, cell
size BMI, serum markers of type 2 diabetes risk (insulin, glucose,
HOMA-IR, HOMA-b), circulating cytokines (CRP, IL-6, TNF-a,
Original Article Obesity
OBESITY BIOLOGY AND INTEGRATED PHYSIOLOGY
www.obesityjournal.org Obesity | VOLUME 24 | NUMBER 6 | JUNE 2016 1275](https://image.slidesharecdn.com/d33182f1-ea2c-48d9-9c15-ce46f78ff0e4-160625213428/85/oby21507-2-320.jpg)
![MCP-1) and leptin were assessed through correlations and adjusted
partial correlations, and the association with CLS status (1/2) were
tested by ANCOVA. All relationships were tested for the confound-
ing effects of age, gender, BMI, surgery type, and ethnicity; raw
correlations reported unless covariate adjustment altered findings
and are described.
Statistical significance was set a P 0.05, and data are reported as
mean 6 SEM, unless otherwise noted. Variables were natural log
transformed (Ln) if necessary to achieve a normal distribution. Data
were analyzed with SAS 9.3.
Results
As shown in Table 1, a total of 44 nondiabetic participants who have
excess weight or who have obesity were included in this study. The
study population was of mixed ethnicity/race (10 African American, 21
Hispanic, 9 white, and 3 other) and had an average BMI of 37.2 6
1.2 kg/m2
and age of 41.56 1.6 years. Ninety-one percent of partici-
pants had obesity, 70% were female, and each had complete histology,
anthropometrics, and fasting blood measures. Out of 44 participants,
flow cytometry data was available for 37 patients. There was no statisti-
cal difference in characteristics between two groups (data not shown).
Basic AT histology
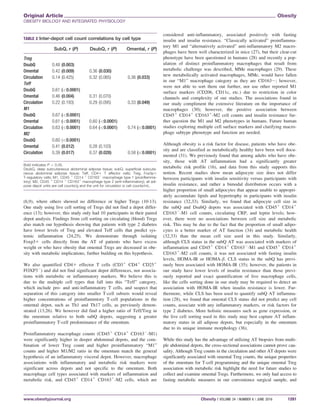
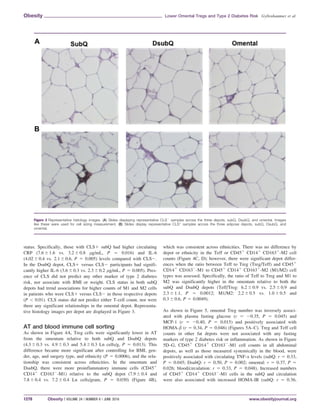
As shown in Figure 2A, the average adipocyte cell size was signifi-
cantly higher in the subQ relative to the DsubQ and omental depot
(4,527 6 169 l2
vs. 4,022 6 179 and 3,827 6 169 l2
, P 5 0.001).
The subQ was the most hypertrophied depot and had significant
positive relationships with circulating CRP (r 5 0.39, P 5 0.01)
and leptin (r 5 0.46, P 5 0.002), but after controlling for BMI, age,
sex, ethnicity, and surgery type, there was only a significant rela-
tionship with circulating leptin (r 5 0.40, P 5 0.02) and newly with
IL-6 (r 5 0.38, P 5 0.03). SubQ and DsubQ cell size also signifi-
cantly associated with subQ M1 and DsubQ M1 cell counts (r 5
0.40, P 5 0.028; r 5 0.45, P 5 0.011, respectively) and DsubQ cell
size associated with subQ M1, DsubQ M1, and omental M1 cell
counts (r 5 0.041, P 5 0.023; r 5 0.36, P 5 0.48; r 5 0.38, P 5
0.037, respectively). There were no other significant cell size and
cell count relationships, nor did cell size significantly associate with
any fasting diabetes marker.
Presence of CLS (CLS1) was significantly lower in the omental
depot relative to the subQ and DsubQ (29% CLS1 vs. 71% and
65% CLS1; P 5 0.010) (Figure 2B). The difference in frequency
was consistent across ethnicities. The presence of CLS significantly
predicted circulating markers of inflammation in the subQ and
DsubQ depot, but there were no relationships with omental CLS1
TABLE 1 Participant characteristics (n 5 44)
Variable
Frequency or
mean 6 SEM
Ethnicity (AA/Hispanic/white/other) (11/21/9/3)
Sex (male/female) (13/31)
Obesity status (overweight/obese) (4/40)
Surgery type (bariatric/hernia/chole) (20/8/16)
Pre-DM (yes/no) (14/30)
Age (years) 41.5 6 1.55
Height (inches) 65.0 6 0.63
Weight (lb) 221.4 6 8.58
BMI (kg/m2
) 37.2 6 1.20
Fasting glucose (mg/dL) 94.3 6 4.80
Fasting insulin (lU/mL) 6.47 6 0.66
HOMA-IR 1.49 6 0.16
HOMA-b 107.4 6 13.0
Leptin (pg/mL) 30,103 6 3,458
CRP (lg/mL) 6.42 6 1.20
IL-6 (pg/mL) 3.49 6 0.51
TNF-a (pg/mL) 4.48 6 0.25
MCP-1 (pg/mL) 269.9 6 16.9
AA, African American; BMI, body mass index; chole, cholecystectomy; CRP, C-
reactive protein; HOMA-IR, homeostasis model assessment-insulin resistance; IL-6,
interleukin-6; MCP-1, monocyte chemotactic protein type 1 [aka chemokine (C-C
motif) ligand 2 (CCL2)]; pre-DM, pre-type 2 diabetic; TNF-a, tumor necrosis factor-
a.
Figure 2 Histology characteristics by depot and ethnicity and raw values. (A) The
average adipocyte cell size (lm2
) is significantly larger in the subQ depot relative to
the DsubQ and omental depots (4,527 6 169 l2
vs. 4,022 6 179 and 3,827 6 169
l2
; P 5 0.001), and this relationship was consistent across ethnicities and inde-
pendent of age, BMI, gender, and surgery type. (B) Additionally, the proportion of
CLS1 samples was significantly lower in the omental depot relative to the subQ
and DsubQ (29% CLS1 vs. 71% and 65% CLS1; P 5 0.010). The proportion of
CLS1 samples by depot was also consistent across ethnicities, and the lower
CLS1% was independent of age, BMI, gender, and surgery type.
Original Article Obesity
OBESITY BIOLOGY AND INTEGRATED PHYSIOLOGY
www.obesityjournal.org Obesity | VOLUME 24 | NUMBER 6 | JUNE 2016 1277](https://image.slidesharecdn.com/d33182f1-ea2c-48d9-9c15-ce46f78ff0e4-160625213428/85/oby21507-4-320.jpg)
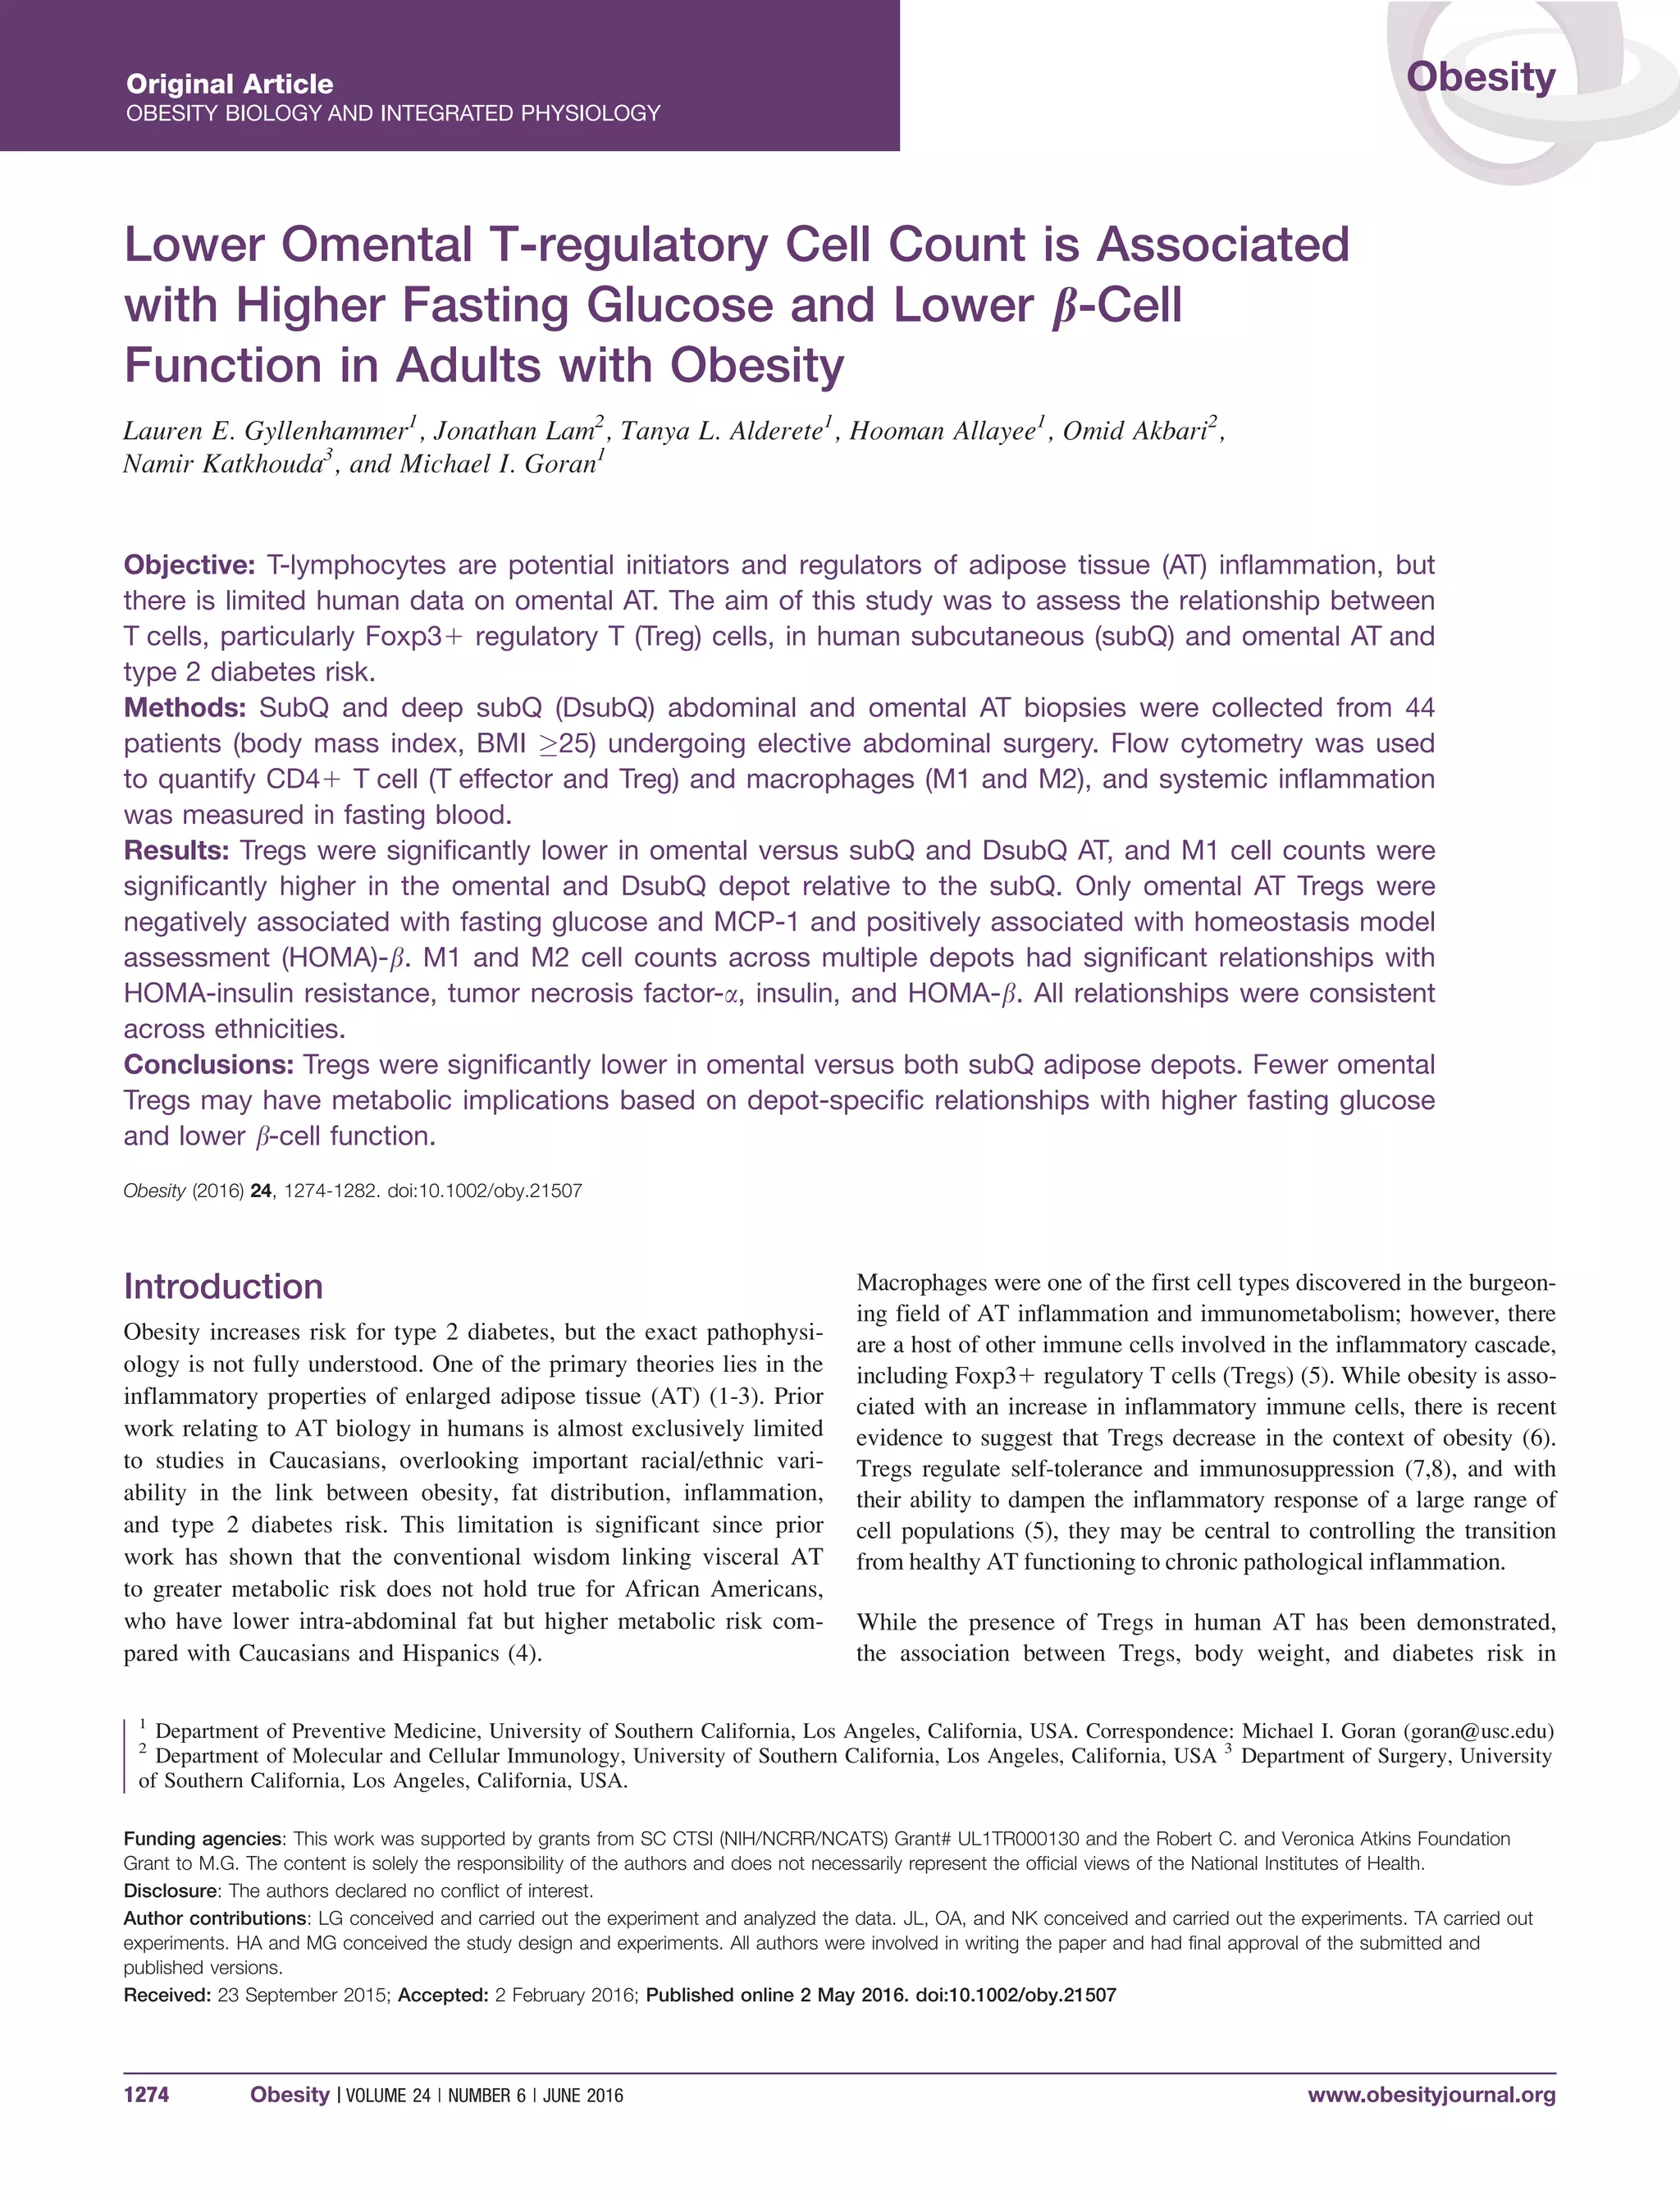
![P 5 0.032; circulation: r 5 0.38, P 5 0.026) (figure not shown),
but both associations became a trend after controlling for covari-
ates (P 0.1). Increased anti-inflammatory cells (CD451
CD141
CD1631
-M2) in each fat depot were associated with higher fasting
insulin levels and indicators of insulin resistance and b-cell func-
tion. Specifically, CD451
CD141
CD1631
-M2 counts in the subQ,
omentum, and circulation were associated with higher fasting insu-
lin and increased insulin resistance [fasting insulin 5 subQ: r 5
0.35, P 5 0.034; omental: r 5 0.46, P 5 0.005; blood/circulation:
r 5 0.54, P 5 0.001 (Figure 5H–J); HOMA-IR 5 subQ: r 5 0.37,
P 5 0.029; omental: r 5 0.41, P 5 0.014; blood/circulation: r 5
0.49, P 5 0.004 (Figure 5K–M)], with no significant relationship
in DsubQ counts. As shown in Figure 5N–O, increased CD451
CD141
CD1631
-M2 cell counts in the omental AT and in circula-
tion were associated with increased HOMA-b (omental: r 5 0.48,
P 5 0.003; blood/circulation: r 5 0.61, P 0.001). CD451
CD141
CD1632
-M1 or CD451
CD141
CD1631
-M2 cell counts
by depot did not significantly associate with any other fasting
marker.
Table 2 summarizes the inter-depot correlations for the various
cell types. Overall, cell counts positively and significantly corre-
lated with each other across depots; however, within T-cell subsets,
only omental cell counts significantly associated with circulating
cell counts (Treg: r 5 0.36, P 5 0.033; Teff: r 5 0.33 P 5
0.049).
Discussion
This is one of the first studies using human fat biopsies to couple
traditional histological measures of AT inflammation with live cell
sorting to characterize immune cells in various AT depots. The
main findings indicate that Treg cell counts are lower in the omental
AT relative to the subQ abdominal depots in nondiabetic adults who
have excess weight or who have obesity irrespective of race/ethnic-
ity. Additionally, the lower omental Treg counts were associated
with higher fasting glucose, higher MCP-1, and lower b-cell func-
tion. These results demonstrate distinct depot effects of Tregs on
diabetes risk factors that are specific to omental but not subQ AT
depots or Tregs in circulation, with a similar effect by race/ethnicity.
Based on this and the loss of omental Tregs in obese animals (6),
we propose that increased omental fat could lead to loss of immune
modulatory functioning and increased risk for type 2 diabetes.
As part of the intra-abdominal visceral depot, the omentum has sig-
nificant immune properties (20,21), and contains lymphoreticular
aggregations (milky spots) which distinguish it from other visceral
AT (22). The omentum is the center of peritoneal cavity lymphocyte
trafficking and activation (22) and an important site of T-cell accu-
mulation (23). These unique immune properties may partially
account for the depot-specific findings observed in this study. Previ-
ous human studies in which Tregs were quantified, primarily used
gene expression from frozen AT; however, associations with obesity
varied, and some studies showed lower omental Tregs in obesity
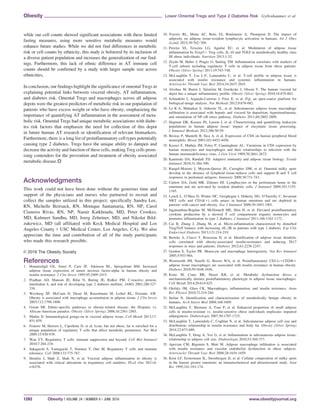
Figure 4 Cell counts by depot and ethnicity. Raw natural log values shown (mean 6 SEM). (A) Treg cell counts are significantly lower in the
omentum versus both subcutaneous depots, DsubQ and subQ (P 5 0.013), and this relationship is consistent across ethnicities and inde-
pendent of BMI, gender, age, and surgery type. (B) No significant difference in Teff cell count by depot or ethnicity. (C)
CD451
CD141
CD1632
-M1 cell counts are significantly higher in the omentum and DsubQ relative to the subQ depot (P 5 0.03), and this
relationship is consistent across ethnicities and independent of BMI, gender, age, and surgery type. (D) No significant difference in
CD451
CD141
CD1631
-M2 cell count by depot or ethnicity.
Original Article Obesity
OBESITY BIOLOGY AND INTEGRATED PHYSIOLOGY
www.obesityjournal.org Obesity | VOLUME 24 | NUMBER 6 | JUNE 2016 1279](https://image.slidesharecdn.com/d33182f1-ea2c-48d9-9c15-ce46f78ff0e4-160625213428/85/oby21507-6-320.jpg)