Download as PDF, PPTX


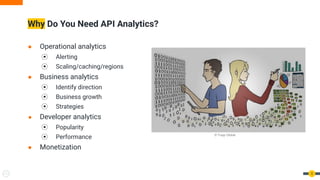


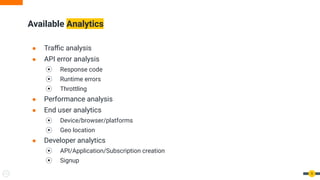


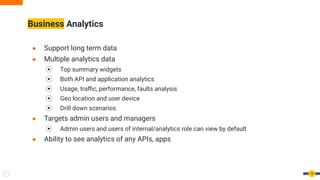
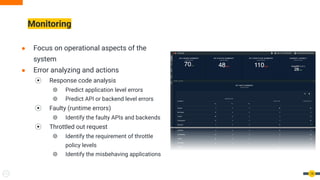
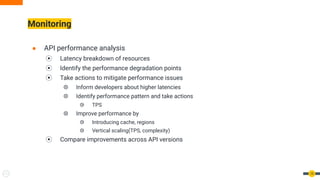
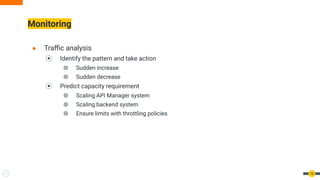

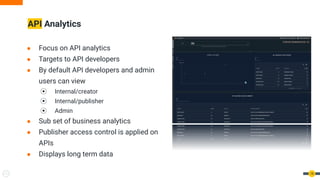

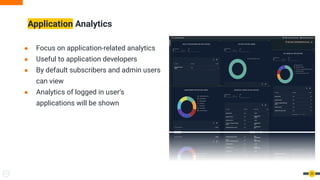
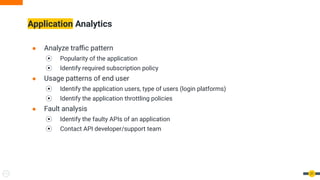


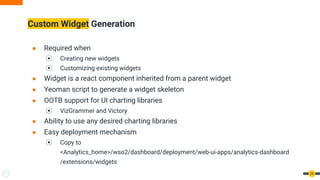


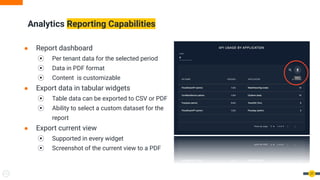


The document discusses API analytics, highlighting its importance for various stakeholders such as managers and developers, and detailing the architecture and operational capabilities of analytics dashboards. It covers aspects like traffic analysis, performance monitoring, and custom widget generation, emphasizing the need for effective reporting and business insights. The presentation aims to guide users in leveraging API analytics for operational improvements and strategic planning.

![[WSO2 Summit EMEA 2020] Fintech Ecosystems & Consumer Experiences: The Next G...](https://cdn.slidesharecdn.com/ss_thumbnails/wso2summitemea2020fintechecosystemsconsumerexperiencesthenextgenerationofbanking-200924114436-thumbnail.jpg?width=640&height=640&fit=bounds)


![[WSO2 Summit EMEA 2020] Experiencing the Benefits of API Driven Open Banking](https://cdn.slidesharecdn.com/ss_thumbnails/wso2summitemea2020experiencingthebenefitsofapidrivenopenbanking-200925080713-thumbnail.jpg?width=640&height=640&fit=bounds)
![[APIdays NY] Managing the usage of Asynchronous APIs: What does it take?](https://cdn.slidesharecdn.com/ss_thumbnails/apidays-2021-async-210809082511-thumbnail.jpg?width=640&height=640&fit=bounds)


![[WSO2 Summit Chicago 2018] Welcome Address: Integration Agility](https://cdn.slidesharecdn.com/ss_thumbnails/1-tyler-9-180914140149-thumbnail.jpg?width=640&height=640&fit=bounds)
![[WSO2 Summit EMEA 2020] Building an Interactive API Marketplace](https://cdn.slidesharecdn.com/ss_thumbnails/wso2emea2020buildinganinteractiveapimarketplace-200924112140-thumbnail.jpg?width=640&height=640&fit=bounds)

![[WSO2 Summit EMEA 2020] Unified Endpoint Management APIs for Enterprise Devices](https://cdn.slidesharecdn.com/ss_thumbnails/wso2summitemea2020unifiedendpointmanagementapisforenterprisedevices-200924072424-thumbnail.jpg?width=640&height=640&fit=bounds)

![[WSO2 Summit Americas 2020] Creating Smart Endpoints Using Integration Micros...](https://cdn.slidesharecdn.com/ss_thumbnails/wso2summitamericas2020creatingsmartendpointsusingintegrationmicroservices-200826201750-thumbnail.jpg?width=640&height=640&fit=bounds)

![[WSO2 Summit EMEA 2020] Accelerate and Secure Services Integration with WSO2 ...](https://cdn.slidesharecdn.com/ss_thumbnails/wso2summitemea2020accelerateandsecureservicesintegrationwithwso2apimanager-200924073027-thumbnail.jpg?width=640&height=640&fit=bounds)
![[Webinar] WSO2 Enterprise Integrator 7.1.0 Release](https://cdn.slidesharecdn.com/ss_thumbnails/wso2enterpriseintegrator7-200813070253-thumbnail.jpg?width=640&height=640&fit=bounds)


![[WSO2 Summit Americas 2020] Automating an Integrated API Supply Chain Using a...](https://cdn.slidesharecdn.com/ss_thumbnails/wso2summitamericas2020automatinganintegratedapisupplychainusingacloud-nativearchitecture-200827181948-thumbnail.jpg?width=640&height=640&fit=bounds)
![[WSO2 Meetup] Tools and Techniques for Building and Maintaining Streaming-bas...](https://cdn.slidesharecdn.com/ss_thumbnails/streamingintegrator-meetup-200810061540-thumbnail.jpg?width=640&height=640&fit=bounds)


![[WSO2 API Day Toronto 2019] Cloud-native Integration for the Enterprise](https://cdn.slidesharecdn.com/ss_thumbnails/wso2apidaytoronto2019cloud-nativeintegrationfortheenterprise-191113063107-thumbnail.jpg?width=640&height=640&fit=bounds)


![[Roundtable] Choreo - The AI-Native Internal Developer Platform as a Service](https://cdn.slidesharecdn.com/ss_thumbnails/choreo-deck-250328074645-511dded7-thumbnail.jpg?width=640&height=640&fit=bounds)


