![Summing the Values in an Array
In[1]: import numpy as np
In[2]: np.random.random(100)
sum(L)
Out[2]:
55.61209116604941
In[4]: big_array = np.random.rand(1000000)
%timeit sum(big_array)
%timeit np.sum(big_array)
Out[4]:
443 ms ± 3.54 ms per loop (mean ± std. dev. of 7 runs, 1 loop
each)
2.97 ms ± 19.2 µs per loop (mean ± std. dev. of 7 runs, 100 loops
each)](data:image/gif;base64,R0lGODlhAQABAIAAAAAAAP///yH5BAEAAAAALAAAAAABAAEAAAIBRAA7)
Recommended
Recommended
More Related Content
Similar to NumPy_Aggregations - Python for Data Science.pptx
Similar to NumPy_Aggregations - Python for Data Science.pptx (20)
More from JohnWilliam111370
Recently uploaded
Recently uploaded (20)
NumPy_Aggregations - Python for Data Science.pptx
- 1. Computation on NumPy Arrays: Aggregations
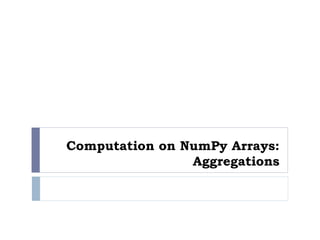
- 2. Summing the Values in an Array In[1]: import numpy as np In[2]: np.random.random(100) sum(L) Out[2]: 55.61209116604941 In[4]: big_array = np.random.rand(1000000) %timeit sum(big_array) %timeit np.sum(big_array) Out[4]: 443 ms ± 3.54 ms per loop (mean ± std. dev. of 7 runs, 1 loop each) 2.97 ms ± 19.2 µs per loop (mean ± std. dev. of 7 runs, 100 loops each)
- 3. Minimum and Maximum In[5]: min(big_array), max(big_array) Out[5]: (1.1717128136634614e-06, 0.9999976784968716) In[6]: np.min(big_array), np.max(big_array) Out[6]: (1.1717128136634614e-06, 0.9999976784968716) In[7]: %timeit min(big_array) %timeit np.min(big_array) Out[7]: 251 ms ± 4.14 ms per loop (mean ± std. dev. of 7 runs, 1 loop each) 1.68 ms ± 15.7 µs per loop (mean ± std. dev. of 7 runs, 1000 loops each) In[8]: print(big_array.min(), big_array.max(), big_array.sum()) Out[8]: 1.17171281366e-06 0.999997678497 499911.628197
- 4. Multi dimensional aggregates In[9]: M = np.random.random((3, 4)) print(M) Out[9]: [[ 0.8967576 0.03783739 0.75952519 0.06682827] [ 0.8354065 0.99196818 0.19544769 0.43447084] [ 0.66859307 0.15038721 0.37911423 0.6687194 ]] In[10]: M.sum() Out[10]: 6.0850555667307118 In[11]: M.min(axis=0) # Print the minimum value for axis = 0 Out[11]: array([ 0.66859307, 0.03783739, 0.19544769, 0.06682827]) In[12]: M.max(axis=1) # Print the maximum value for axis = 1 Out[12]: array([ 0.8967576 , 0.99196818, 0.6687194 ])
- 5. Example: What is the Average Height of US Presidents?
- 6. Example: What is the Average Height of US Presidents? In[13]: !head -4 president_heights.csv order,name,height(cm) 1,George Washington,189 2, John Adams,170 3, Thomas Jefferson,189 In[14]: import pandas as pd data = pd.read_csv('president_heights.csv') heights = np.array(data['height(cm)']) print(heights) Out[14]: [189 170 189 163 183 171 185 168 173 183 173 173 175 178 183 193 178 173 174 183 183 168 170 178 182 180 183 178 182 188 175 179 183 193 182 183 177 185 188 188 182 185]
- 7. Example: What is the Average Height of US Presidents? In[15]: print("Mean height: ", heights.mean()) print("Standard deviation:", heights.std()) print("Minimum height: ", heights.min()) print("Maximum height: ", heights.max()) Out[15]: Mean height: 179.738095238 Standard deviation: 6.93184344275 Minimum height: 163 Maximum height: 193
- 8. Example: What is the Average Height of US Presidents? In[16]: print("25th percentile: ", np.percentile(heights, 25)) print("Median: ", np.median(heights)) print("75th percentile: ", np.percentile(heights, 75)) Out[16]: 25th percentile: 174.25 Median: 182.0 75th percentile: 183.0 percentile()function used to compute the nth percentile of the given data (array elements) along the specified axis