1. IT Financial Analytics
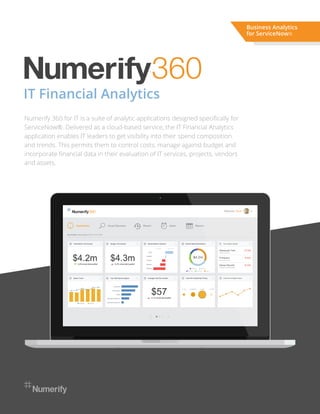
Numerify 360 for IT is a suite of analytic applications designed specifically for
ServiceNow®. Delivered as a cloud-based service, the IT Financial Analytics
application enables IT leaders to get visibility into their spend composition
and trends. This permits them to control costs, manage against budget and
incorporate financial data in their evaluation of IT services, projects, vendors
and assets.
Business Analytics
for ServiceNow®
2. This Month’s Performance
Spend Breakdown
Nov
0
Total Opex Capex
$500k
$1m
Dec Jan ‘15 Feb Mar Apr May
opex
capex
budget
forcast
$812k
8.2% since last month
EXPLORE
Spend
$750k
3.4% since last month
EXPLORE
Budget
$798k
3.6% since last month
EXPLORE
Forecast
As an operational application, ServiceNow produces rich data that reflects IT business
processes. Embedded operational reports address the “here and now” questions such as “What
were my total costs for this month for a business service?”. But, Managers need to know the “why”
behind the “what”. For example, they would want to quickly pinpoint the one vendor that is
responsible for the highest increase in total service costs and how to control it. To get those
answers they need to slice and dice the data in multiple dimensions by any metric and without
having to wait for a lengthy technical setup.
Numerify360 mines the rich data in ServiceNow and converts it into actionable insights using
analytics. It delivers financial intelligence in visually intuitive ways and arms managers with the
knowledge to take strategic decisions using hard numbers.
Business Analytics for ServiceNow®
For an effective IT business, it is important to create a financially responsible culture, but without
spending hundreds of hours creating manual reports. Numerify’s pre-built applications can accelerate
the time to insights across a broad range of IT financial areas.
By tracking IT spend, managers can drive cost savings through multiple areas, such as controlling usage
of variable cost items. In addition, they can proactively curtail variances against budgets and course
correct or adjust their forecast well in advance.
Numerify IT Financial Analytics
The core module helps IT analyze their fixed
and variable costs at department level. For
example, managers can figure out where they
spend money across multiple dimensions
such as labor, software, hardware etc. as well
as across vendors and locations. They can also
track actuals against budget and identify key
drivers of variance.
Core IT Financial
IT Spend Overview
3. IT Spend this month IT Spend by Top Departments
6.8% since last month
$1.4m
Total Opex Capex Marketing
Engineering
Sales
IT
Finance
IT Weekly Spend Trend
Spend by Location Cost Per Incident
May 1
$100k
$200k
$300k
May 8 May 15 May 22
Spend Breakdown Business ServiceCost Category
Business Service
Overview
+$34k
overall since last month
Electronic Messaging
most positive change
I.T. Services
most negative change
Electronic Messaging
$24k
Client Services
$34k
Outlook Web Access
$5k
SAP Payroll
$6k
Peoplesoft CRM
$8k
I.T. Services
$15k
Blackberry
$2k
$109k
For companies that have implemented
ServiceNow® ITBM product, Numerify can load the
allocated cost numbers into our cloud based data
warehouse to enable comprehensive analytics. The
combination of an allocated model and powerful
analytics provides IT leaders an advanced business
tool that slices and dices data across departments,
business and IT services as well as projects and key
initiatives.
Allocated Cost
IT Service forms more than 7% of an IT
organization’s spend, but accounts for more than
50% of customer perception. By combining data
from ITSM and Financials, service leaders can
ensure that their limited dollars are being put to
best use for their most critical systems and
identify systems that are draining their resources.
For example, they can identify areas to increase
self-service or evaluate their offshore and
outsourced vendors.
IT Service Financial
Fully integrated with ServiceNow
Pre-built mapping for financial information so that you
don’t need to know database structure or SQL.
Self service reporting
Point and click access to asset dashboards and reports.
Quick sharing with PDFs and live reports.
Pre-built role-based dashboards
Expertly designed dashboards provide pixel perfect views
for everyone from the CIO to business partners.
Visual discovery
Simple drag and drop tools let you slice and dice data to
build new financial reporting in minutes.
Unique capabilities enable deep insights
Spend Analysis by Cost Category
Incident Cost Analysis
Cost Breakdown by Priority SAPApplication
4 - Low 3- Moderate 2 - High
Bubble Size: Cost
0 volume 800
1 - Critical
2 - High
$147k
total cost
490
ticket volume
$302
cost per ticket
4. ABOUT NUMERIFY
Numerify is a leading provider of IT business analytics
applications aimed at bringing comprehensive
business insights to IT Leaders. The company is
funded by Sequoia Capital and LightSpeed Venture
Partners and a host of cloud industry business and
technology leaders.
GET STARTED TODAY
For more information, visit www.numerify.com,
subscribe to Numerify’s newsletter or visit our
Insights Showcase.
Contact Numerify Sales at sales@numerify.com
or call us at (408) 663-5158
The benefits of a powerful platform
Cloud-based Data Warehouse
Fast time to value with a cloud-based data
store, optimized for real-time queries without
impacting operational tool performance.
Incorporate External Data
Load additional data from HR, vendor
management or contract system to get a 360°
view of your IT business.
Advanced Analytics
A true data warehouse stores historical data
for time-series analysis combined with
statistical functions and text analytics.
Secure Storage
Our data store is managed with SOC II
compliant operations to ensure security.
Role-based access limits who can view reports.