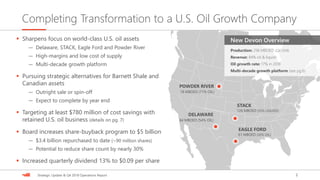
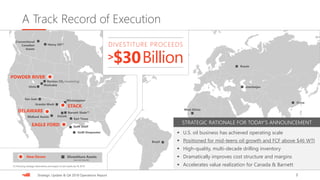
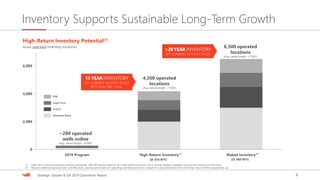
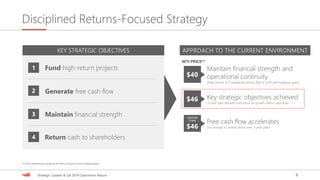
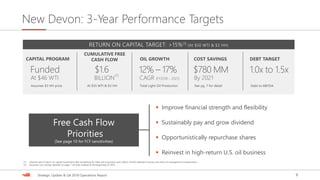
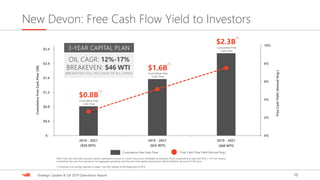
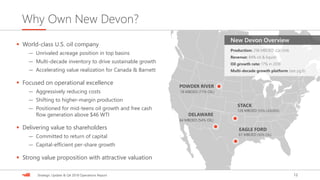
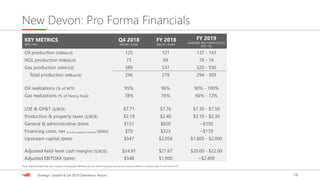
- Devon Energy is completing its transformation into a U.S. oil growth company by focusing on its core U.S. oil assets and pursuing strategic alternatives for its Canadian and Barnett Shale assets.
- It is targeting $780 million in annual cost savings by 2021 from operational efficiencies and restructuring, and has an increased $5 billion share repurchase program.
- The company expects to deliver 12-17% annual oil production growth through 2021 and generate over $1.6 billion in cumulative free cash flow at $55 WTI oil prices, while maintaining its strong financial position.
Devon Energy is completing its transformation into a U.S. oil growth company by focusing on its world-class oil assets in the Delaware Basin, STACK, Eagle Ford, and Powder River. It is pursuing strategic alternatives for its Barnett Shale and Canadian assets. Devon is targeting $780 million in cost savings and increasing its share buyback program to $5 billion to reduce shares outstanding by nearly 30%. It is increasing its quarterly dividend by 13% and has a multi-decade inventory of high-return locations supporting long-term growth.
Devon Energy is completing its transformation into a U.S. oil growth company by focusing on its world-class oil assets in the Delaware Basin, STACK, Eagle Ford, and Powder River Basin. It is pursuing strategic alternatives for its Barnett Shale and Canadian assets to be completed by the end of 2019. Devon is targeting $780 million in cost savings from its retained U.S. oil business and has increased its share buyback program to $5 billion.
This document provides an investor presentation for Devon Energy from August 2019. It summarizes Devon's strategy of focusing on its high-quality U.S. oil portfolio, improving cost structure and capital efficiency, generating free cash flow, and delivering value to shareholders through returning capital. Key highlights include raising 2019 oil growth guidance, lowering capital spending outlook, aggressively improving costs, and advancing its divestiture program to further strengthen its balance sheet.
Total adjusted EBITDA increased by over $32 million, or 20%, in Q2-19 vs. Q2-18. Teekay LNG's adjusted EBITDA and earnings per unit increased significantly in Q2-19 compared to Q2-18 as its newbuilding program nears completion. Teekay Tankers' adjusted EBITDA also increased in Q2-19 due to stronger tanker market rates, though its adjusted net loss decreased less due to lower spot tanker rates and more scheduled drydockings. Teekay Parent refinanced $498 million of bonds and reduced gross debt, though its adjusted EBITDA decreased as two of its FPSO units will undergo planned maintenance in Q
Teekay Corporation held an earnings presentation on August 13, 2020 to discuss their Q2 2020 results. Some key highlights included:
- Teekay achieved its third consecutive quarter of adjusted profits and saw a 61% increase in total adjusted EBITDA compared to Q2 2019. It also eliminated all remaining debt guarantees for TNK.
- Teekay LNG saw record adjusted net income and total adjusted EBITDA for Q2 2020, up 19% and 82% respectively from Q2 2019. Its LNG fleet is nearly 100% fixed for the rest of 2020.
- Teekay Tankers had its third consecutive quarter of strong earnings and cash flows, with adjusted net income of $
Teekay Corporation reported its Q4 2018 earnings. Consolidated adjusted net loss decreased from $11.4 million in Q3 2018 to $2.0 million in Q4 2018. Teekay LNG contributed to the improved results through higher revenues from new charter contracts and spot rates. Teekay Tankers also saw higher revenues due to improved spot rates. Teekay Parent's results were impacted by unplanned shutdowns on two FPSO units, lowering revenues, but it benefited from a settlement with Petrobras recognized by Teekay Offshore.
Sunoco LP provided an investor presentation that included the following key points:
1. The presentation included forward-looking statements and non-GAAP financial measures with required reconciliations.
2. Sunoco executed a business transformation that divested retail sites and refinanced debt to improve its financial profile and leverage targets.
3. Going forward, Sunoco expects a lean cost structure from its fuel distribution business with stable income streams from fuel sales and rental income. It aims to grow through organic expansion and acquisitions while maintaining disciplined financial policies.
This document provides contact information for Devon Energy's investor relations team. It also includes standard legal disclaimers about forward-looking statements, non-GAAP financial measures, and SEC definitions. The rest of the document summarizes Devon's asset portfolio and operating strategy, highlights successful well results and cost savings, and discusses two of Devon's key resource plays, STACK and the Meramec, in more detail.
This document provides contact information for Devon Energy's investor relations team. It also contains standard legal disclaimers about forward-looking statements and the use of non-GAAP financial measures in company presentations. The rest of the document summarizes Devon's operations and financial position, highlighting its high-quality asset portfolio including top positions in the STACK and Delaware Basin plays, significant financial strength following asset sales, and a focus on capital discipline and returns.
- Petrobras held its annual investor day in 2018 to discuss the company's performance and future plans
- The CEO highlighted improvements in safety, debt reduction, cash generation, governance, and exploration successes in recent years
- Executives provided details on ongoing debt management initiatives, production increases, cost savings, and new deepwater project startups
- The company aims to further strengthen its financial position while preparing for a low-carbon future through technology investments and portfolio optimization
Newfield Exploration Company is an independent oil and gas exploration company focused on properties in the Anadarko Basin region. The analysis team gives Newfield a "Market Perform" rating and estimates the 12-month target price will be $43.92 per share, a 33% increase from the current price of $38.16. This is based on an expected recovery in oil and gas prices in 2015 and Newfield's focus on high-return areas like the Anadarko Basin through acquisitions and cost reductions. However, volatility in commodity prices remains a risk.
1) UGI reported third quarter 2016 adjusted earnings per share of $0.23, up from $0.07 in the prior year period. Weather was colder than the prior year across UGI's service territories.
2) AmeriGas achieved strong results due to solid margin management, expense control, and colder weather. Adjusted EBITDA increased 30% year-over-year.
3) UGI International benefited from the acquisition of Finagaz and strong unit margin management, partially offset by integration expenses. Weather was significantly colder than the prior year.
Teekay LNG Partners reported financial results for Q2-2019 with Total Adjusted EBITDA of $162.1 million, up from $140.8 million in Q1-2019. Adjusted net income was $34.4 million compared to $30.4 million last quarter. For 2019, the partnership maintained guidance ranges of $1.85 to $2.20 per unit for Adjusted net income and $665 to $690 million for Total Adjusted EBITDA. The partnership continues deleveraging with consolidated leverage decreasing from 9.0x to 6.7x over the past year and expects $900 million in total debt amortization to build equity value.
Constellation Energy Partners LLC reported financial and operational results for the fourth quarter and full year of 2013. Key highlights included:
- Oil accounted for 51% of sales revenue in 2013, with average daily oil production up 84% year-over-year.
- Operating costs were $24.69 per BOE for 2013, down 4% from 2012.
- Capital spending of $15.7 million in 2013 resulted in 79 net wells and recompletions.
- The company forecast $20-22 million in capital spending and 1,346-1,552 MBOE of production for 2014, with adjusted EBITDA of $26.7-29.9 million.
- Carrizo Oil and Gas significantly reduced its 2015 capital expenditures in response to lower oil prices. It will focus on developing its low-cost Eagle Ford assets and slow production in the Niobrara, Utica, and Marcellus plays under current economic conditions.
- The company has good oil price hedges and financial flexibility through 2015 as it aims to maintain production levels and weather the economic downturn through developing existing reserves efficiently. Its Eagle Ford assets in particular allow for low-cost production growth.
PVA is an E&P company that has transitioned from primarily natural gas to oil and liquids production through its Eagle Ford Shale position. It has 23,000 net acres in the Eagle Ford with 190 well locations identified. PVA's strategy has increased revenues and cash flows as oil and liquids prices have risen relative to natural gas prices. PVA believes its valuation is low relative to peers given its oil and liquids focus, production growth, and hedging program. It plans to continue developing its Eagle Ford acreage and adding other oil projects while maintaining its gas assets for potential future price recovery.
ConocoPhillips (COP) today provided an update on its operating plan for Alaska, focusing on the company’s long history of creating value in the state and an ongoing commitment to invest in low cost of supply opportunities. Over the past few years, the company’s Alaska business has undergone a significant transformation, driven by a more competitive fiscal framework, cost reductions, technological advancements and an exploration renaissance.
PVA is an E&P company focused on transitioning to oil and liquids production. It has built up a position in the Eagle Ford shale through drilling and leasing, with over 25,000 net acres and up to 250 well locations. PVA has successfully grown its oil and NGL production in recent years while retaining substantial gas assets. The company is taking steps to improve liquidity and focus on further expanding its oil reserves and drilling inventory through continued activity in the Eagle Ford and testing a new Viola Lime oil prospect. PVA's strategy is aimed at continuing its transition to oil and liquids in order to grow production and cash flows in the current environment of higher oil prices relative to natural gas prices.
This investor presentation provides an overview of Penn Virginia Corporation (PVA):
1) PVA has transitioned to focus on oil and liquids-rich plays like the Eagle Ford Shale, growing oil production over 250% since 2010.
2) The company is executing a strategy of continued drilling in the Eagle Ford with an inventory of up to 250 well locations, while maintaining gas assets for potential future price recovery.
3) Challenges include the capital intensity of the industry and building financial liquidity, which PVA is addressing through asset sales and reducing spending and dividends.
Teekay Corporation reported its Q2-2018 earnings. Some key highlights:
- Consolidated cash flow from vessel operations was $164.2 million. Adjusted net loss was $21.6 million.
- Teekay Parent secured a one-year charter extension for the Banff FPSO to August 2019. Cash flow from its three directly-owned FPSOs provides upside exposure to rising oil prices.
- Teekay LNG continues executing its portfolio of growth projects delivering through 2020, which are expected to increase annual cash flow by $240 million.
- Teekay Tankers signed term sheets for $110 million in additional liquidity to improve its financial position as tanker rates are expected
- The document presents an investment opportunity in Advanced Emissions Solutions, which provides emissions control technologies and services for coal power plants.
- It owns a 42.5% stake in Tinuum Group, a leading developer of Refined Coal facilities that produce cleaner burning coal eligible for tax credits.
- Tinuum Group has existing Refined Coal facilities that are projected to generate $45-90 million annually in free cash flow through 2021 if additional facilities are invested in, providing a significant cash engine.
- Teekay Corporation presented its Q3 2020 earnings results, which showed improved financial performance over Q3 2019. Total adjusted EBITDA increased to $227 million from $193 million, while consolidated adjusted net income was $15 million compared to a loss of $24 million in Q3 2019.
- The presentation highlighted that Teekay has significantly strengthened its financial position over the past year, reducing consolidated net debt by $941 million. Total consolidated liquidity was also increased to over $1 billion.
- Looking ahead, Teekay expects to further reduce costs associated with the decommissioning of the Banff oil field and sees opportunities to create long-term shareholder value from its interests in Teekay
Chesapeake Energy reported earnings for the fourth quarter of 2019. The presentation includes forward-looking statements and discusses key risks and uncertainties. It outlines Chesapeake's business strategy of financial discipline, profitable growth, and exploration. Key 2019 accomplishments included reducing capex by 30% year-over-year, reducing costs, growing oil production by 30%, and increasing adjusted EBITDAX. Priorities for 2020 include further reducing costs and targeting free cash flow. The presentation provides details on Chesapeake's asset portfolio and 2020 plans across its core regions.
Petrobras is a fully integrated Brazilian energy company operating across the hydrocarbon chain from exploration and production to distribution. It has significant oil and gas reserves, production, refining capacity, and market share in Brazil. Petrobras' 2013-2017 business plan focuses on capital discipline and performance improvement to maintain an investment grade rating. The plan allocates over $200 billion to upstream projects in Brazil and segments like downstream and gas and power, with the aim of generating $32 billion in savings by 2016 through cost optimization programs.
This document contains the summary of a fourth quarter 2008 conference call for DPS. It discusses the challenging macroeconomic conditions, but notes DPS's committed to its long term strategy focused on building brands. It provides an overview of Q4 and full year 2008 financial performance. Guidance for 2009 indicates net sales growth of 2-4% and EPS growth excluding items of $1.59 to $1.67. DPS will continue to generate strong cash flows and pay down $400 million in debt in 2009.
Trecora Resources is a specialty chemical company with two operating segments: South Hampton Resources and Trecora Chemical. South Hampton produces high-purity petrochemical hydrocarbons and has seen increasing revenues and adjusted EBITDA in recent years. Trecora Chemical produces polyethylene waxes and also has expanding revenues and profits. Trecora aims to maximize capacity utilization, improve margins, integrate the two segments, and pursue future growth opportunities through expansion projects and potential acquisitions. The company also owns a 35% stake in a zinc and copper mine in Saudi Arabia that is expected to IPO in late 2016.
- CorEnergy Infrastructure Trust held an investor conference call to discuss its fiscal year 2016 results
- Key developments included declaring a $0.75 dividend for Q4 2016, bringing the annual dividend to $3.00 per share, and providing continued dividend guidance of $3.00 per share
- The presentation reviewed CorEnergy's asset portfolio and tenants, capital structure, recent financing activities, and outlook for 2017 including a focus on acquisitions of $50-250 million and continued stable dividend payments.
This investor presentation summarizes Devon Energy's strategy and operations. It highlights Devon's high-quality U.S. oil portfolio, with multi-decade growth potential from key basins like the Delaware Basin, STACK, and Powder River. Devon plans to aggressively improve its cost structure, generate free cash flow above $46 WTI, and return capital to shareholders through stock buybacks and dividend increases. In the Delaware Basin, Devon is focusing on Bone Spring and Wolfcamp projects and achieving record well productivity, with average cumulative oil per well reaching over 300,000 barrels.
Bank of America Merrill Lynch 2015 Transportation ConferenceDelta_Airlines
- Delta has delivered strong financial performance through industry-leading operations, strategic growth initiatives, and cost productivity measures.
- It has significantly improved earnings, margins, returns on capital, and cash generation over the last few years and is on track for record results in 2015.
- Delta maintains a balanced capital allocation strategy of reinvesting in its business, strengthening its balance sheet by reducing debt, and returning cash to shareholders through dividends and stock repurchases.
This document provides an investor update from Devon Energy (DVN). It summarizes DVN's asset portfolio, financial strength following asset divestments, and operating strategy. Key points include DVN focusing its capital investments within cash flow on top-tier oil and gas plays like the STACK and Delaware Basin, achieving significant cost savings, and maintaining a disciplined capital allocation approach.
This document provides an investor update from Devon Energy (DVN) regarding its business and operations. It lists investor relations contacts and provides forward-looking statements and non-GAAP information disclosures. The main points are that Devon has a premier asset portfolio focused on top North American resource plays, significant financial strength following asset divestitures raising $3.2 billion, and is delivering top-tier results while disciplinedly allocating capital. Key areas discussed include the STACK play in Oklahoma where Devon has a large position and is accelerating activity, and the Meramec formation within STACK which is emerging as one of the best oil resource plays in North America.
This document provides contact information for Devon Energy's investor relations team. It also contains forward-looking statements and cautions readers that certain terms used such as "resource potential" are more speculative than proved reserves estimates. The document discusses Devon's asset portfolio, financial strength following divestitures, and operating strategy to maximize production and reduce costs. It highlights top-performing areas including the STACK play in Oklahoma and Delaware Basin in New Mexico, and provides details on well results and significant inventory in these core resource plays.
This document provides contact information for Devon Energy's investor relations team. It also contains standard legal disclaimers about forward-looking statements and the use of non-GAAP financial measures in company presentations. The rest of the document summarizes Devon's operations, highlighting its high-quality asset portfolio, strong financial position, and focus on capital discipline and returns. It provides details on key growth opportunities in the STACK and Delaware Basin plays.
This document provides contact information for Devon Energy's investor relations team. It also contains standard legal disclaimers about forward-looking statements and the use of non-GAAP financial measures in company presentations. The rest of the document summarizes Devon's operations and financial position, highlighting its high-quality asset portfolio including top positions in the STACK and Delaware Basin plays, significant financial strength following asset sales, and a focus on capital discipline and returns.
This document provides contact information for Devon Energy's investor relations team. It also contains standard legal disclaimers about forward-looking statements and the use of non-GAAP financial measures in company presentations. The rest of the document summarizes Devon's operations and financial position, highlighting its high-quality asset portfolio, significant financial strength, and track record of strong well results and cost reductions. It focuses on Devon's leading positions in the STACK and Delaware Basin plays and provides details on recent well performance and significant resource potential across the company's key areas.
Stifel 2015 Transportation and Logistics ConferenceDelta_Airlines
- Delta generated over $4.5 billion in pre-tax income in 2014 and expects improvements in 2015 from lower fuel prices and initiatives.
- The company aims to reduce debt, return capital to shareholders, and invest for growth while maintaining margins of 11-14% and annual EPS growth of 10-15%.
- Delta will balance reinvesting approximately 50% of operating cash flow in the business with strengthening its balance sheet and returning cash to shareholders.
Our growth strategy is on track.
"The fundamental strength of our business, which is underpinned by contracted revenues and geographical diversity, together with the proven industry experience of our management team and the expertise and commitment of our staff, have ensured that once again we have delivered a solid performance, despite the challenging conditions that we continue to experience in our European market. This illustrates the resilience of our business model.
Our growth strategy is on track. Organic growth will continue apace through the expansion of services and geographies and we have a clearly defined path to continue our acquisitive growth in a highly fragmented global business aviation services sector. Our strategic goal is to double the scale of the business over the next two years."
Marwan Khalek, Chief Executive.
- Digital Realty reported 4Q15 Core FFO per share of $1.38, above the high end of its forecasted range, driven by lower than expected G&A expenses and synergies from the Telx acquisition.
- The company is on track to meet its 2016 financial targets from the Telx acquisition, with 4Q15 actual Core EBITDA and expense synergies exceeding expectations.
- Digital Realty's backlog of signed but not yet commenced leases provides a solid foundation for 2016, with front-end loaded annualized GAAP base rent of $84 million.
Deutsche Bank Industrials & Basic Materials ConferenceDelta_Airlines
Delta has significantly improved its financial performance and cash generation over the past decade through consolidation, restructuring, and innovation. It is now one of the leading airlines in the world with industry-leading operational reliability and customer satisfaction. Delta expects to produce record earnings and cash flow in 2015 through continued strategic growth, cost productivity, and lower fuel prices. The company has a balanced capital deployment strategy of reinvesting in the business, strengthening its balance sheet by reducing debt, and returning cash to shareholders. This strategy has driven significant value creation for shareholders.
Invacare Corporation Fourth Quarter & Full year 2019 resultsrperezfont
- The document outlines Invacare Corporation's 4th quarter and full year 2019 financial performance and 2020 focus areas.
- For 2019, operating loss improved 43.1% due to lower SG&A expenses and actions to streamline operations and expand gross profit margins. Adjusted EBITDA improved $22.1 million.
- For 2020, Invacare will focus on sales growth through new products, cost optimization, and process improvements to drive further profitable growth.
Delta reported record profitability in 2014 with $4.5 billion in pre-tax income, almost $1.9 billion higher than 2013. Free cash flow was $3.7 billion. Delta aims to continue expanding margins through disciplined capacity growth, pricing improvements, and cost productivity initiatives while maintaining a balanced approach to capital deployment. This includes reinvesting approximately 50% of operating cash flow back into the business, continuing to strengthen Delta's balance sheet by paying down debt, and returning cash to shareholders.
This document provides contact information for Devon Energy's investor relations team. It also includes standard legal disclaimers about the use of forward-looking statements and non-GAAP financial measures in company presentations. The document provides contact details for Devon's vice president of investor relations and investor relations supervisor for any investor inquiries.
Capital return-announcement-with-non-gaapsDelta_Airlines
Delta provided projections for its future financial performance from 2015-2017. It expects to significantly improve its operating margin to between 14-16% through cost productivity and capacity discipline. Delta plans to generate $7-8 billion in annual operating cash flow and $4-5 billion in free cash flow, which it will use to continue strengthening its balance sheet and increase returns to shareholders. By maintaining its disciplined capital investment of $2.5-3 billion annually and implementing its financial framework, Delta believes it can achieve 15%+ annual EPS growth and a ROIC of 20-25% over the next three years.
12 15-14 december investor presentation finalAES_BigSky
The document discusses AES Corporation's forward-looking statements and contains assumptions about future performance. It provides an executive summary of AES' strategy to decrease costs, reduce complexity, leverage existing platforms, and bring in partners. AES has a diversified portfolio of generation and utilities assets, with 80% under long-term contracts. The company is executing projects that yield returns over 15% and developing new capacity. It has invested cash in shareholder returns, debt paydown, and growth projects.
Aug 1 2018 q earnings 073118 w waldo compressedmolsoncoorsir
- Molson Coors reported a 1.9% increase in Q2 revenue but a 2.6% decline in financial volume. Underlying EBITDA declined 2.4% to $774 million due to challenges in the US and Canada markets.
- The company is focused on premiumization and growing its above premium and craft brands. It aims to accelerate top-line growth through commercial excellence initiatives while continuing its cost savings program.
- Molson Coors reaffirmed its 2018 guidance and is committed to debt paydown and maximizing cash flow to strengthen its balance sheet. It plans to reward shareholders with capital returns once leverage targets are achieved.
PVA has established a premier position in the Eagle Ford shale, an emerging oil and liquids-rich play, with over 31,800 net acres across Gonzales and Lavaca Counties in Texas. PVA has seen significant success drilling 60 wells to date in the play, with average initial production rates of over 1,000 BOEPD. PVA plans to continue aggressive development of the Eagle Ford with up to 35-40 wells planned in 2013, exploiting over 280 remaining drilling locations, as it works to expand its oil and liquids production and cash flow.
This document is Devon Energy's January 2019 investor presentation which provides an overview of the company. It summarizes Devon's key assets including its Delaware Basin, STACK, and Rockies positions. It highlights Devon's disciplined growth strategy of focusing investment on its top U.S. oil plays, maintaining financial strength through debt reduction and hedging, and returning cash to shareholders. The presentation also reviews Devon's operational excellence, strong ESG performance, and secured supply chain positioning the company for continued success.
Devon Energy is an oil and gas exploration and production company with operations focused on North America. In a December 2018 investor presentation, Devon outlines its disciplined growth strategy, strong financial position, and high-return capital program focused on its top U.S. assets including the Delaware Basin and STACK play. Devon expects to deliver oil production growth of 15-19% in 2019 with a capital budget of $2.4-2.7 billion, maintaining financial strength and returning cash to shareholders.
Devon Energy presented at the Bank of America Merrill Lynch Global Energy Conference on November 14, 2018. Devon is an oil and gas exploration and production company with a market capitalization of around $20 billion and Q3 production of 522 thousand barrels of oil equivalent per day, of which 67% was liquids. Devon outlined its disciplined growth strategy, key accomplishments in 2018 including US oil growth ahead of plan and debt reduction of over 40%, and strategic objectives including funding high-return projects and returning cash to shareholders.
Devon Energy held an investor presentation in October 2018 to highlight its strategic focus on capital efficiency, portfolio simplification, and improving financial strength. The company expects to exceed its $5 billion divestiture target by the end of 2018. Devon also outlined its $4 billion share repurchase program and plans to increase its quarterly dividend. The presentation emphasized Devon's commitment to optimizing returns and delivering capital-efficient cash flow growth through 2020.
The document is Devon Energy's September 2018 investor presentation. It highlights Devon's $4 billion share repurchase program, the largest ever by an E&P company. It also discusses Devon's 2020 vision of enhancing returns through disciplined capital investment and portfolio simplification efforts. Devon expects to exceed its $5 billion divestiture target by the end of 2018. The presentation provides operational and financial updates, including Devon's outlook for significant cash flow growth driven by its high-margin U.S. oil portfolio.
The document is Devon Energy's August 2018 investor presentation. It highlights Devon's focus on its Delaware and STACK assets which have over 30,000 potential locations combined, allowing for multi-decade production growth. Devon has initiatives underway to optimize returns including a $4 billion share repurchase program, a 33% increase to its dividend, and a plan to reduce debt and exceed its $5 billion divestiture target. The presentation also provides operational and financial updates showing Devon is on track to deliver 16% growth in US oil production in 2018.
The document is Devon Energy's August 2018 investor presentation. It highlights Devon's focus on its Delaware and STACK assets which have over 30,000 potential locations combined, providing a multi-decade growth platform. Devon's 2020 vision is to enhance returns through disciplined capital investment, simplify its portfolio through divestitures exceeding $5 billion, improve its financial strength, and return cash to shareholders. Key initiatives include a $4 billion share repurchase program and increasing its quarterly dividend by 33%.
- Devon Energy is focused on its Delaware and STACK assets which have over 30,000 potential drilling locations and provide a multi-decade growth platform.
- Devon's 2020 vision is to enhance returns through disciplined capital investment, improve its financial strength with a net debt to EBITDA target of 1.0-1.5x, and return cash to shareholders including a $4 billion share repurchase program.
- Devon has raised its 2018 U.S. oil production guidance by 200 basis points to 145-150 thousand barrels of oil per day, representing 16% growth over 2017, driven by efficiencies and well productivity gains in its Delaware and STACK assets.
This document is Devon Energy's presentation at the J.P. Morgan Energy Conference on June 18, 2018. It discusses Devon's 2020 vision of enhancing returns through disciplined capital investment and portfolio simplification. Devon aims to achieve net debt to EBITDA of 1.0-1.5x, complete $5 billion in asset divestitures, and return $4 billion to shareholders via stock buybacks. The presentation outlines Devon's operational excellence strategy and updated 2018 outlook with 16% growth in US oil production.
Devon Energy held an investor presentation in June 2018 to outline its strategic vision through 2020. The presentation highlighted Devon's focus on its Delaware and STACK assets, with potential locations exceeding 30,000. Devon aims to drive significant cash flow growth through 2020 by concentrating activity in these core areas and improving capital efficiency with a goal of reducing costs by 15%. Devon also outlined initiatives to further strengthen its financial position, including portfolio simplification through $5 billion in asset divestitures and $4 billion in share repurchases.
- Devon Energy presented at the UBS Global Oil and Gas Conference on May 23, 2018.
- Devon outlined its 2020 vision which includes growing higher-value oil production in the Delaware and STACK areas, improving financial strength, and returning cash to shareholders.
- Key initiatives include a $1 billion share repurchase program, raising the dividend by 33%, and a $1 billion debt reduction plan.
- Devon Energy is focused on its Delaware and STACK assets which have over 30,000 potential drilling locations and represent a multi-decade growth platform.
- Devon's 2020 vision is to enhance returns through disciplined capital investment, improve its financial strength with a net debt to EBITDA target of 1.0-1.5x, and return cash to shareholders including a $1 billion share repurchase program.
- Devon is pursuing portfolio simplification with the potential for over $5 billion in asset divestitures to further focus on its core Delaware Basin and STACK assets.
- Devon Energy is focused on its Delaware and STACK assets which have over 30,000 potential drilling locations and represent a multi-decade growth platform.
- Devon's 2020 vision is to enhance returns through disciplined capital investment, improve its financial strength with a net debt to EBITDA target of 1.0-1.5x, and return cash to shareholders including a $1 billion share repurchase program.
- Portfolio simplification efforts include the potential for over $5 billion in asset divestitures to further focus on its core Delaware and STACK assets.
This document provides an investor presentation for Devon Energy from April 2018. It summarizes Devon's investment thesis of having a multi-decade growth platform focused on its Delaware and STACK assets with over 30,000 potential locations. It outlines Devon's 2020 vision to deliver over 25% annual oil production growth from these areas while improving its financial strength and returning cash to shareholders. The presentation provides details on Devon's 2018 capital plan, operational excellence initiatives across its assets, and significant opportunities for continued production and cash flow growth through 2020 and beyond.
This document provides an investor presentation for Devon Energy Corporation (DVN). It includes information on DVN's leadership team and contact information, forward-looking statements, use of non-GAAP measures, and cautionary notes for investors. The presentation outlines DVN's investment thesis of being a multi-decade growth platform focused on its Delaware and STACK assets with over 30,000 potential locations combined. It provides details on DVN's 2020 strategic vision and targets for production growth, cost reductions, asset sales, financial improvements, and returning cash to shareholders.
This investor presentation provides an overview of Devon Energy Corporation and its growth strategy focused on the STACK and Delaware Basin assets. Devon has over 30,000 potential locations across the STACK and Delaware Basin that represent a multi-decade growth opportunity. The company plans to advance development in these core areas while divesting less competitive assets to strengthen its balance sheet. Devon is also focused on operational excellence initiatives to improve capital efficiency and financial returns.
This document provides an investor presentation for Devon Energy from December 2017. It summarizes Devon's competitive advantages as having a multi-decade growth platform focused on its STACK and Delaware assets, with top-tier operating results from over 30,000 potential locations across the two areas. It outlines Devon's 2020 vision to further high-grade its asset portfolio, expand per-unit margins, improve balance sheet strength, and focus on financial returns through continued development of these core assets.
This document provides an investor presentation for Devon Energy from December 2017. It summarizes Devon's competitive advantages as having a multi-decade growth platform focused on its STACK and Delaware assets, with top-tier operating results and over 30,000 potential locations across the two areas. It outlines Devon's 2020 vision to further high-grade its asset portfolio, expand per-unit margins, improve balance sheet strength, and focus on financial returns through continued development of STACK and Delaware and potential multi-billion dollar divestitures of less competitive assets.
Devon Energy presented at the Bank of America Merrill Lynch Global Energy Conference on November 16, 2017. Devon highlighted its STACK and Delaware Basin assets as multi-decade growth platforms with over 30,000 potential locations combined. Devon outlined its 2020 vision of further high-grading its asset portfolio, expanding per-unit margins, improving its balance sheet strength, and focusing on financial returns through continued development of these core areas. Devon also provided a preliminary outlook for 2018 of over 30% production growth in STACK and Delaware, a $2-2.5 billion capital program funded within cash flows, and $1 billion targeted for debt reduction.
This document provides an investor presentation for Devon Energy. It summarizes Devon's competitive advantages in the STACK and Delaware Basin areas, with over 30,000 potential locations. Devon's 2020 vision is to further high-grade its asset portfolio, expand per-unit margins, improve its balance sheet strength, and focus on financial returns. Key projects highlighted include the Showboat and Anaconda developments in the STACK and Delaware Basin, aimed at co-developing multiple zones to increase efficiencies.
2. 2Strategic Update & Q4 2018 Operations Report
Completing Transformation to a U.S. Oil Growth Company
▪ Sharpens focus on world-class U.S. oil assets
— Delaware, STACK, Eagle Ford and Powder River
— High-margins and low cost of supply
— Multi-decade growth platform
▪ Pursuing strategic alternatives for Barnett Shale and
Canadian assets
— Outright sale or spin-off
— Expect to complete by year end
▪ Targeting at least $780 million of cost savings with
retained U.S. oil business (details on pg. 7)
▪ Board increases share-buyback program to $5 billion
— $3.4 billion repurchased to date (~90 million shares)
— Potential to reduce share count by nearly 30%
▪ Increased quarterly dividend 13% to $0.09 per share
18 MBOED (71% OIL)
STACK
126 MBOED (55% LIQUIDS)
POWDER RIVER
EAGLE FORD
61 MBOED (50% OIL)
84 MBOED (54% OIL)
DELAWARE
Production: 296 MBOED (Q4 2018)
Revenue: 84% oil & liquids
Oil growth rate: 17% in 2018
Multi-decade growth platform (see pg.6)
New Devon Overview
3. 3Strategic Update & Q4 2018 Operations Report
A Track Record of Execution
Divestiture AssetsNew Devon
Brazil
Azerbaijan
China
Russia
GoM Shelf
GoM Deepwater
San Juan
East Texas
Mississippian
Granite Wash
Uinta
Washakie
Conventional
Canadian
Assets
Midland Assets
DIVESTITURE PROCEEDS
EnLink
West Africa
$30Billion>
Heavy Oil(1)
Barnett Shale(1)
(1) Pursuing strategic alternatives and expect to exit assets by YE 2019
▪ U.S. oil business has achieved operating scale
▪ Positioned for mid-teens oil growth and FCF above $46 WTI
▪ High-quality, multi-decade drilling inventory
▪ Dramatically improves cost structure and margins
▪ Accelerates value realization for Canada & Barnett
STRATEGIC RATIONALE FOR TODAY’S ANNOUNCEMENT
STACK
POWDER RIVER
EAGLE FORD
DELAWARE
(over last decade)
Rockies CO2 (marketing)
4. 4Strategic Update & Q4 2018 Operations Report
$0
$10
$20
$30
$40
$50
$60
$70
$80
$90
New Devon’s World-Class Oil Assets Visualized
Portfolio positioned in top oil basins
Well level breakeven (PV-10, WTI to HH @ 20:1) ($/bbl)
Net
Acres
40,000
Net
Acres
280,000
Net
Acres
280,000
Net
Acres
330,000
DOMINANT
POSITION IN 4
TOP
OIL
PLAYS
Source: RS Energy Group, December 2018.
Breakeven($/bbl@20:1WTI:HH)
Note: acreage denoted represents core acreage positions
5. 5Strategic Update & Q4 2018 Operations Report
Unleashing Potential of World-Class Oil Assets
2018 Oil Growth 2018 Oil Realizations
150
300
450
600
750
900
U.S. well productivity showcases asset quality
Source: IHS/Devon. All wells drilled since 2015 and includes operators with more than 100 wells.
Superior oil growth and pricing
+17%
(vs. 2017)
+1%
(vs. 2017)
Reported New Devon
DECLINE
20%
(FY 2018)
Improved per-unit costs
2018 LOE & transportation expense ($/BOE)
Higher field-level margins
2018 field-level cash margins ($/BOE)
$17.68
$27.67
Reported New Devon
INCREASE
56%
(FY 2018)
$9.66
Avg.90-DayIPsBOED,20:1
PEER AVG.
96%
(of WTI)
65%
(of WTI)
Reported
New Devon
Top 40 U.S. Producers
$7.76
SUPERIOR
WELL
RESULTS
+40%VS. PEER AVG.
6. 6Strategic Update & Q4 2018 Operations Report
0
2,000
4,000
6,000
2019 Program High-Return Inventory Risked Inventory
(@ $50 WTI) (@ $60 WTI)
(2)
Inventory Supports Sustainable Long-Term Growth
STACK
Delaware Basin
Eagle Ford
PRB
4,200 operated
locations
(Avg. lateral length: ~7,500’)
~280 operated
wells online
(Avg. lateral length: ~8,000’)
15 YEAR INVENTORY
(AT CURRENT ACTIVITY PACE)
WTD AVG. IRR: >50%
6,500 operated
locations
(Avg. lateral length: <7,500’)
(1)
High-Return Inventory Potential(1)
Gross operated inventory locations
(1) High-return inventory represents locations generating >20% IRR. Returns based on all-in E&P capital investment, which includes drilling, completion and well-site facilities and flow back.
(2) Requires additional appraisal work, cost efficiencies, spacing optimization and operating cost improvements to compete for capital allocation with current high-return inventory opportunity set.
>20 YEAR INVENTORY
(AT CURRENT ACTIVITY PACE)
7. 7Strategic Update & Q4 2018 Operations Report
Next Steps to Optimize New Devon Cost Structure
Aggressively pursuing improved cost structure
New Devon expected cost savings by area vs. 2018 results ($MM)
$780
ANNUAL COST
SAVINGS BY 2021
MILLION
$-
$200
$400
$600
$800
YE 2019 YE 2020 YE 2021
Timing of annual cost savings
Cumulative estimated annual cost savings ($MM)
Interest
G&A
D&C(1)
LOE
G&A
$300 MM
Interest
$130 MM
Per-Unit
Recurring LOE
$50 MM
D&C
Efficiencies
$300 MM
▪ Restructuring to unlock potential of New Devon
— One functional focus across entire organization
— Reduced complexity provides for further focus on
competitive advantages in U.S.
— Refocused and streamlined leadership structure
— Realigning personnel with go-forward business
▪ Cost savings designed to be front-end weighted
— ~70% of targeted savings achieved by year-end 2019
— Targeted G&A level: ~$2.50 per Boe
— Structural D&C efficiencies reflected in 2019 outlook
— PV10 of cost savings plan: ~$4.5 billion (over next 10 years)
COMMITTED TO OPTIMIZING CAPITAL EFFICIENCY AND OPERATIONAL EXCELLENCE
(1) D&C costs assume flat service cost environment versus 2018
(1)
8. 8Strategic Update & Q4 2018 Operations Report
Disciplined Returns-Focused Strategy
KEY STRATEGIC OBJECTIVES
Fund high-return projects
Maintain financial strength
Return cash to shareholders
Generate free cash flow
1
2
3
4
(1) Price sensitivity also assumes $3 Henry Hub and current hedge position.
$40
Free cash flow accelerates
(no change to activity levels over 3-year plan)
Key strategic objectives achieved
(3-year plan delivers mid-teens oil growth within cash flow)
Maintain financial strength and
operational continuity
(New Devon FCF breakeven below $40 in 2019 with hedging gains)
WTI PRICE(1)
$46
$46
GREATER
THAN
APPROACH TO THE CURRENT ENVIRONMENT
9. 9Strategic Update & Q4 2018 Operations Report
New Devon: 3-Year Performance Targets
CUMULATIVE FREE
CASH FLOW OIL GROWTH COST SAVINGS DEBT TARGETCAPITAL PROGRAM
RETURN ON CAPITAL TARGET: >15%(1) (At $50 WTI & $3 HH)
$1.6
At $55 WTI & $3 HH
12% – 17%
CAGR (FY2018 – 2021)
Total Light-Oil Production
$780 MM
By 2021
See pg. 7 for detail
1.0x to 1.5x
Debt to EBITDA
Funded
Assumes $3 HH price
At $46 WTI
▪ Improve financial strength and flexibility
▪ Sustainably pay and grow dividend
▪ Opportunistically repurchase shares
▪ Reinvest in high-return U.S. oil business
Free Cash Flow
Priorities
(See page 10 for FCF sensitivities)
(1) Internal rate of return on capital investment after burdening for G&A and corporate costs. Metric further detailed in proxy and driver of management compensation.
(2) Assumes cost savings detailed on page 7 are fully realized at the beginning of 2019.
BILLION
(2)
10. 10Strategic Update & Q4 2018 Operations Report
0%
2%
4%
6%
8%
10%
2019 - 2021 2019 - 2021 2019 - 2021
$-
$0.4
$0.8
$1.2
$1.6
$2.0
$2.4
($60 WTI)
New Devon: Free Cash Flow Yield to Investors
($50 WTI) ($55 WTI)
Cumulative Free
Cash Flow
$2.3B
CumulativeFreeCashFlow($B)
Cumulative Free
Cash Flow
$1.6B
FreeCashYield(AnnualAvg.)
Cumulative Free
Cash Flow
$0.8B
Note: Free cash flow yield assumes market capitalization based on current share price multiplied by expected shares outstanding at year-end 2019 (~375 mm shares).
Cumulative free cash flow represents the aggregate operating cash flow less total capital requirements before dividend. Assumes $3 HH price.
Cumulative Free Cash Flow Free Cash Flow Yield (Annual Avg.)
(1) Assumes cost savings detailed on page 7 are fully realized at the beginning of 2019.
OIL CAGR: 12%-17%
BREAKEVEN: $46 WTI
(BREAKEVEN CALC INCLUSIVE OF ALL CAPEX)
3-YEAR CAPITAL PLAN
(1)
(1)
(1)
11. 11Strategic Update & Q4 2018 Operations Report
Attractive Entry Point for World-Class Oil Business
$-
$6
$12
$18
$24
New Devon
2019e EBITDAX
New Devon
Implied EV
Asset Sale Upside Current EV
New Devon: trading at significant discount
$ in Billions
$15.7
$2.5
$16.8
Peer trading multiples
2019e EV/EBITDAX(1)
2.0x
3.0x
4.0x
5.0x
6.0x
7.0x
8.0x
9.0x
10.0x
CXO EOG OXY PXD COP FANG CLR WPX
Peer average 6.8x
(1) Estimates were sourced from Credit Suisse and assumes $54 WTI and $3.05 HH. “EV” stands for enterprise value. (2) 2019e Adjusted EBITDAX assumes cost savings discussed on page 7 are realized at the first of the year and assumes Credit Suisse
price deck of $54 WTI and $3.05 HH. (3) Represents estimated 2019 Adjusted EBITDAX multiplied by peer average multiple of 6.8x. (4)
Assumes share count, debt and cash at 12/31/18 and current share price.
(2) (3)
(4)
Discounted
valuation
with asset
sale upside
Note: Adjusted EBITDAX is non-GAAP measure and is reconciled to GAAP on a historic basis in our Form 10-K.
Valuation
Gap(6.8x * $2.5B)
Peer Multiple * New DVN EBITDAX
12. 12Strategic Update & Q4 2018 Operations Report
Why Own New Devon?
▪ World-class U.S. oil company
— Unrivaled acreage position in top basins
— Multi-decade inventory to drive sustainable growth
— Accelerating value realization for Canada & Barnett
▪ Focused on operational excellence
— Aggressively reducing costs
— Shifting to higher-margin production
— Positioned for mid-teens oil growth and free cash
flow generation above $46 WTI
▪ Delivering value to shareholders
— Committed to return of capital
— Capital-efficient per-share growth
▪ Strong value proposition with attractive valuation
18 MBOED (71% OIL)
STACK
126 MBOED (55% LIQUIDS)
POWDER RIVER
EAGLE FORD
61 MBOED (50% OIL)
84 MBOED (54% OIL)
DELAWARE
Production: 296 MBOED (Q4 2018)
Revenue: 84% oil & liquids
Oil growth rate: 17% in 2018
Multi-decade growth platform (see pg.6)
New Devon Overview
13. 13Strategic Update & Q4 2018 Operations Report
Investor Contacts & Notices
Investor Relations Contacts
Scott Coody Chris Carr
VP, Investor Relations Manager, Investor Relations
405-552-4735 405-228-2496
Email: investor.relations@dvn.com
Forward-Looking Statements
This presentation includes “forward-looking statements” as defined
by the Securities and Exchange Commission (the “SEC”). Such
statements include those concerning strategic plans, our
expectations and objectives for future operations, as well as other
future events or conditions, and are often identified by use of the
words and phrases “expects,” “believes,” “will,” “would,” “could,”
“continue,” “may,” “aims,” “likely to be,” “intends,” “forecasts,”
“projections,” “estimates,” “plans,” “expectations,” “targets,”
“opportunities,” “potential,” “anticipates,” “outlook” and other similar
terminology. All statements, other than statements of historical facts,
included in this presentation that address activities, events or
developments that Devon expects, believes or anticipates will or may
occur in the future are forward-looking statements. Such statements
are subject to a number of assumptions, risks and uncertainties,
many of which are beyond our control. Consequently, actual future
results could differ materially from our expectations due to a number
of factors, including, but not limited to: the volatility of oil, gas and
NGL prices; uncertainties inherent in estimating oil, gas and NGL
Investor Notices
reserves; the extent to which we are successful in acquiring and discovering additional reserves; the uncertainties, costs and risks involved
in oil and gas operations; regulatory restrictions, compliance costs and other risks relating to governmental regulation, including with
respect to environmental matters; risks related to regulatory, social and market efforts to address climate change; risks related to our
hedging activities; counterparty credit risks; risks relating to our indebtedness; cyberattack risks; our limited control over third parties who
operate some of our oil and gas properties; midstream capacity constraints and potential interruptions in production; the extent to which
insurance covers any losses we may experience; competition for assets, materials, people and capital; our ability to successfully complete
mergers, acquisitions and divestitures; and any of the other risks and uncertainties discussed in our Form 10-K and other filings with the
SEC. Investors are cautioned that any such statements are not guarantees of future performance and that actual results or developments
may differ materially from those projected in the forward-looking statements. The forward-looking statements in this presentation are
made as of the date of this presentation, even if subsequently made available by Devon on its website or otherwise. Devon does not
undertake any obligation to update the forward-looking statements as a result of new information, future events or otherwise.
Use of Non-GAAP Information
This presentation may include non-GAAP financial measures. Such non-GAAP measures are not alternatives to GAAP measures, and you
should not consider these non-GAAP measures in isolation or as a substitute for analysis of our results as reported under GAAP. For
additional disclosure regarding such non-GAAP measures, including reconciliations to their most directly comparable GAAP measure,
please refer to Devon’s fourth-quarter 2018 earnings release at www.devonenergy.com.
Cautionary Note to Investors
The SEC permits oil and gas companies, in their filings with the SEC, to disclose only proved, probable and possible reserves that meet
the SEC's definitions for such terms, and price and cost sensitivities for such reserves, and prohibits disclosure of resources that do not
constitute such reserves. This presentation may contain certain terms, such as high-return inventory, potential locations, risked and
unrisked locations, estimated ultimate recovery (EUR), exploration target size and other similar terms. These estimates are by their nature
more speculative than estimates of proved, probable and possible reserves and accordingly are subject to substantially greater risk of
being actually realized. The SEC guidelines strictly prohibit us from including these estimates in filings with the SEC. Investors are urged to
consider closely the disclosure in our Form 10-K, available at www.devonenergy.com. You can also obtain this form from the SEC by
calling 1-800-SEC-0330 or from the SEC’s website at www.sec.gov.