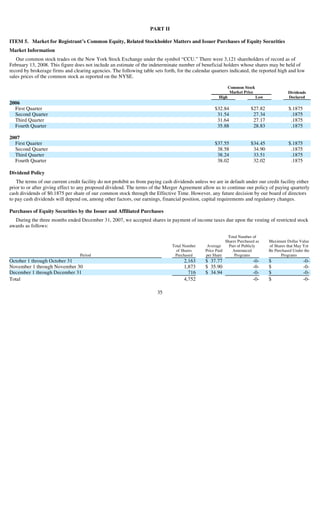
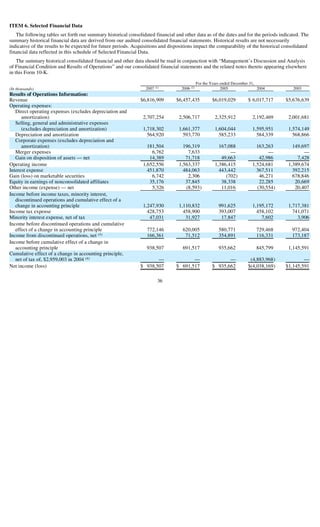
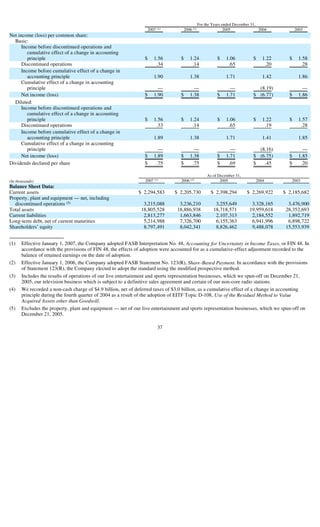
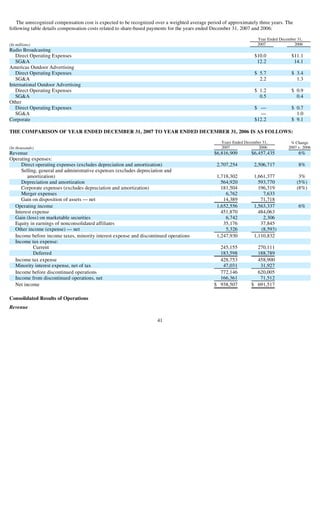
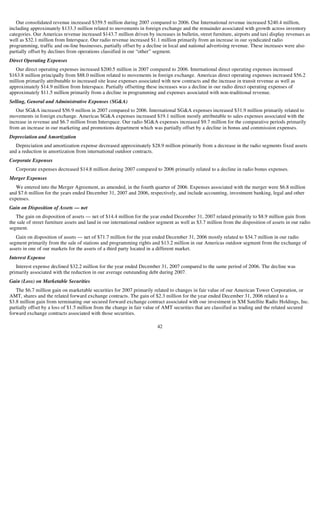
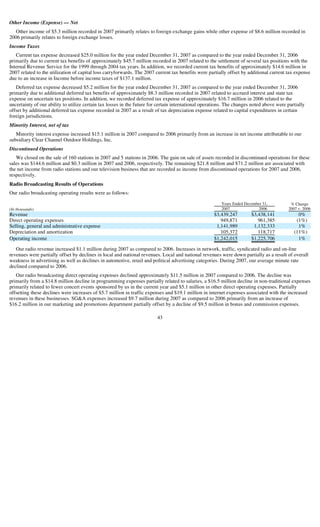
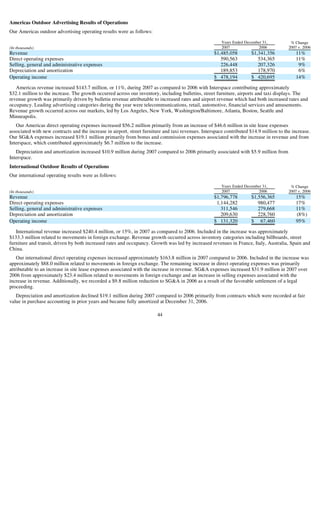
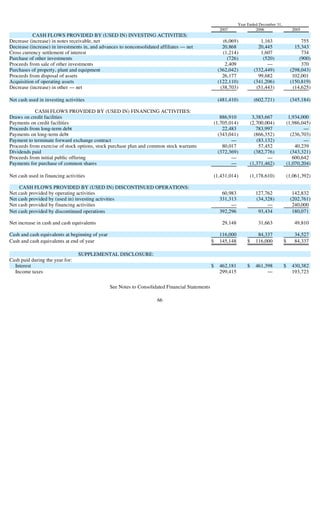
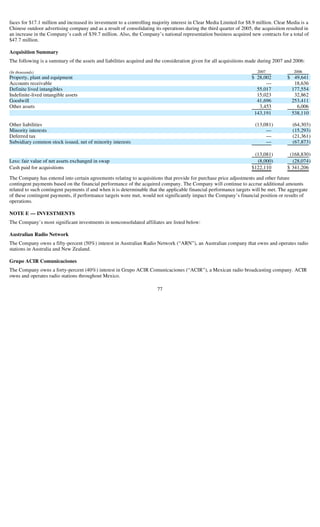
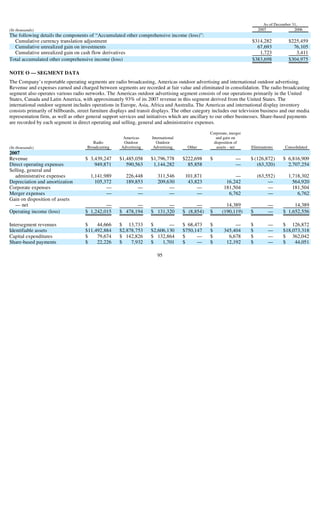
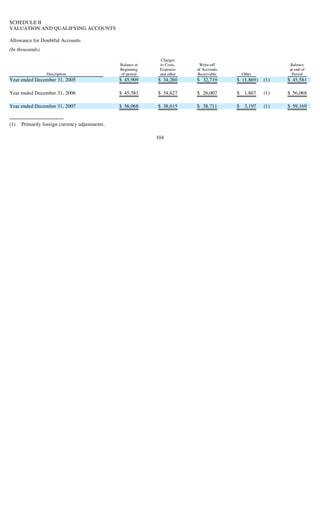
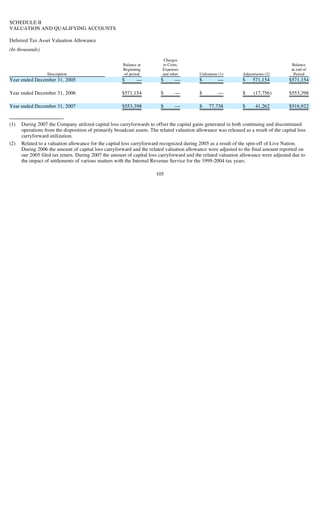
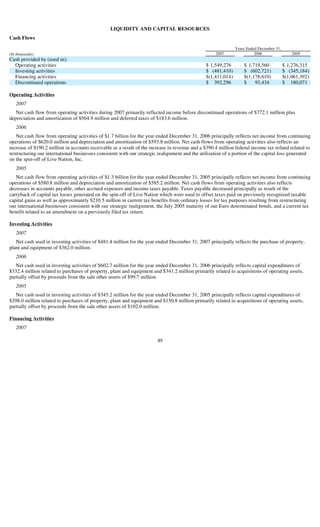
This document is the annual report on Form 10-K filed by Clear Channel Communications, Inc. with the Securities and Exchange Commission for the fiscal year ended December 31, 2007. It provides information on Clear Channel's business segments, which include radio broadcasting, Americas outdoor advertising, and international outdoor advertising. It also discusses Clear Channel's strengths such as its global scale and local market leadership across radio stations and outdoor displays, as well as the attractive fundamentals of the out-of-home radio broadcasting and outdoor advertising industries.
This document is Bell Microproducts' annual report on Form 10-K for the 2008 fiscal year. It provides an overview of the company's business operations, audited financial statements, and discussions of financial results, accounting practices, legal proceedings, risk factors, and corporate leadership. The report is divided into four parts, with Part I discussing the company's business and risk factors, Part II covering financial results and market risk disclosures, Part III related to corporate governance, and Part IV providing supplemental financial information and certifications.
The document is The Boston Beer Company's (Boston Beer) annual report on Form 10-K for the fiscal year ended December 26, 2009. It provides information on Boston Beer's business, including that it is the largest craft brewer in the US, its product portfolio led by the Samuel Adams brand, and that it focuses on the higher-quality "Better Beer" category. It also lists the various beer, cider, and flavored malt beverage products Boston Beer offers.
The document is Emrise Corp's annual report (Form 10-K) filed with the SEC on April 15, 2009. It provides an overview of the company's business operations for 2008, including its two business segments: electronic devices and communications equipment. In 2008, electronic devices contributed approximately 75% of net sales while communications equipment contributed approximately 25%. It also notes the acquisition of Advanced Control Components in August 2008 and the sale of its Digitran division in March 2009.
This document is Whole Foods Market's annual report on Form 10-K for the fiscal year ended September 28, 2008. It provides a summary of Whole Foods Market's business operations, including that it is the world's leading natural and organic supermarket with 275 stores across North America. It also discusses the natural and organic products industry trends of increased awareness of nutrition and environmental concerns driving demand. Whole Foods Market's strategy is to be the premier natural and organic grocer while promoting whole foods, whole people, and a whole planet through sustainable business practices and community support.
This document is General Mills' annual 10-K report filed with the SEC summarizing its business operations for the fiscal year. It discusses General Mills' major product categories including cereals, yogurt, soup, snacks and more. It provides an overview of the company's segments, trademarks, raw materials, research and development activities. The report also includes financial information by segment and geographic region.
This document is Nordstrom's annual report on Form 10-K filed with the SEC, summarizing its business operations for the fiscal year ended January 31, 2009. It discusses Nordstrom's segments including Retail Stores, Direct, Credit, and Other. It provides an overview of Nordstrom's operations including its store count, real estate strategy, and sales by segment. It also outlines the company's trademarks, return policy, seasonality, inventory management, competition, employees, and risk factors associated with its business.
This document is AdvanSource Biomaterials Corp's annual report (Form 10-K) for the fiscal year ending March 31, 2009. It discusses the company's description of business including its history developing advanced polymer materials for medical devices, clinical trials of its synthetic coronary artery bypass graft, and sale of certain business units. It provides an overview of the company's operations, products, partnerships, and reincorporation from Massachusetts to Delaware.
This document is Celadon Group's annual report on Form 10-K for the fiscal year ended June 30, 2008 filed with the United States Securities and Exchange Commission. It provides an overview of Celadon Group's business operations, including that it is one of North America's largest truckload carriers, generating over $565 million in revenue in fiscal year 2008. Approximately half of its revenue comes from international shipments between the US, Mexico, and Canada, making it a leader in cross-border truckload movements. It operates both internationally and domestically, with strategies focused on improving rates, utilization, and service standards.
This document provides an annual report filed by US Dataworks Inc. for the fiscal year ending March 31, 2009. It summarizes that US Dataworks develops payment processing software for banking institutions, credit card issuers, major retailers and the US Government. It generates revenue from licensing, professional services, transaction processing and maintenance of its Clearingworks software. It faces competition from other payment processing software companies and discusses its products, customers, strategic partnerships, competition, intellectual property, government regulation, employees and research and development activities. It also notes that it has incurred losses over the last three fiscal years and may need to raise additional capital or debt financing to continue operations.
The document is Zimmer Holdings' annual report (Form 10-K) filed with the SEC for the year ended December 31, 2005. It provides an overview of Zimmer's business operations, including that it is a global leader in orthopaedic implants and surgical products. It operates in over 24 countries and markets products in over 100 countries. Its primary customers are musculoskeletal surgeons. In 2005, its three major geographic segments were the Americas (59% of sales), Europe (27% of sales), and Asia Pacific. The report discusses Zimmer's customers, sales and marketing approach, distribution network, and main product lines.
This document is Terex Corporation's annual report (Form 10-K) filed with the SEC for the fiscal year ended December 31, 2005. It provides information on Terex's five business segments: Terex Construction, Terex Cranes, Terex Aerial Work Platforms, Terex Materials Processing & Mining, and Terex Roadbuilding, Utility Products and Other. It describes the types of equipment each segment produces and identifies their major manufacturing locations. The report is filed annually with the SEC to provide information on Terex's financial performance and operating structure to investors.
The document is Nordstrom's annual report (Form 10-K) filed with the SEC for the fiscal year ended February 2, 2008. It provides an overview of Nordstrom's business segments and operations, discusses competitive conditions and risks. Key points include:
- Nordstrom has four business segments: Retail Stores, Direct, Credit, and Other. Retail Stores and Direct are the main segments.
- In 2007, Nordstrom opened new stores and remodeled existing stores. It also sold its Façonnable boutiques.
- Nordstrom faces competition from other retailers and risks including its ability to respond to fashion trends, effective inventory management, and economic conditions.
This document is the annual report filed by Whole Foods Market, Inc. with the Securities and Exchange Commission for the fiscal year ending September 25, 2005. It provides information on Whole Foods' business operations, financial results, properties, legal proceedings, executive officers and directors. Whole Foods operates 175 natural and organic food stores across the United States, Canada, and United Kingdom, with $4.7 billion in sales for fiscal year 2005. The report is intended to comply with reporting requirements and provide information to shareholders.
2009 annual Report for PROS Holdings Inc. (NYSE:PRO)
PROS is a leading provider of prescriptive pricing and revenue management software for companies in the manufacturing, distribution, services and travel industries. PROS gives customers far greater confidence and agility in their pricing strategies by providing data-driven insights into transaction profitability, forecasting demand, recommending optimal prices for each product and deal, and streamlining pricing processes with enhanced controls and compliance. With $468 billion in revenues under management, PROS has implemented more than 500 solutions in more than 50 countries. The PROS team comprises more than 500 professionals, including 100 with advanced degrees and 25 with Ph.D.s.
StockTwits - http://stocktwits.com/PROSHoldings
Twitter - http://twitter.com/#!/mattbal4
IR Website - http://phx.corporate-ir.net/phoenix.zhtml?c=211158&p=irol-irhome
Corporate Blog - http://www.pricingleadership.com/
This document is Benihana Inc.'s annual report on Form 10-K for the fiscal year ending March 29, 2009. It provides an overview of the company's business and operations for the past year. The report includes details on Benihana's legal proceedings, risk factors, management discussion and analysis, financial statements, controls and procedures, corporate governance, security ownership, and other disclosures required by the SEC for public companies.
This document is Sanmina-SCI Corporation's annual report (Form 10-K) filed with the SEC. It provides an overview of Sanmina's business as an independent global provider of electronics manufacturing services (EMS). Key points include:
1) Sanmina provides end-to-end EMS including design, manufacturing, assembly, fulfillment and after-market support.
2) It focuses on industries like communications, computing, medical, and defense and has global manufacturing capabilities.
3) Sanmina aims to be a leading EMS provider through its end-to-end services, design resources, vertically integrated manufacturing, advanced technologies, global scale, and customer focus.
This document is Symantec Corporation's annual report (Form 10-K) filed with the SEC for the fiscal year ended March 28, 2008. It provides an overview of Symantec's business operations, financial results, risk factors, and other disclosures. Specifically, the report discusses Symantec's position as a global leader in security, storage, and systems management solutions, its operations in security and storage software markets, and business developments in fiscal 2008 including new product launches, acquisitions, executive changes, and cost structure reductions.
This document is the Form 10-K annual report that Broadridge Financial Solutions, Inc. filed with the SEC for the fiscal year ending June 30, 2011. It includes information such as the company's business description, legal proceedings, financial statements, management's discussion and analysis, and corporate leadership. Broadridge is a Delaware corporation that provides technology-based solutions for brokerage, investment advisory, banking and insurance clients.
The document is Interpublic Group's annual report (Form 10-K) for the fiscal year ended December 31, 2007. It provides an overview of the company's business, including its market strategy, offering of advertising and marketing services through global agency brands like McCann Worldgroup, Draftfcb, and Lowe Worldwide. The report also discusses risks, properties, legal proceedings, stock performance, financial data, controls and procedures, and incorporates sections on leadership, compensation, and accounting matters by reference to the company's proxy statement.
- Castle Brands Inc. develops and markets premium branded spirits including vodka, rum, whiskey, liqueurs and tequila. It distributes these spirits in the US and internationally.
- The document provides details on Castle Brands' leading brands such as Boru vodka, Gosling's rum, Clontarf Irish whiskey, and Pallini liqueurs. It also discusses the company's strategy to focus on profitable brands and selectively add new premium brands.
- Castle Brands does not produce spirits itself but rather has supply agreements with distillers and bottlers. Production and supply details are provided for some of its leading brands such as Boru vodka and Gosling's rum.
This document is KB Home's Form 10-Q quarterly report filed with the SEC for the quarterly period ended February 29, 2004. It includes financial statements, notes to the financial statements, and other financial information. Specifically, it provides KB Home's consolidated statements of income and cash flows for the periods ended February 29, 2004 and February 28, 2003, and consolidated balance sheet as of February 29, 2004 and November 30, 2003. It also includes a discussion and analysis of the company's financial condition and results of operations for the periods.
This document is Ball Corporation's annual report for 2000. It discusses the company's focus on understanding customer markets and delivering superior shareholder returns. In 2000, Ball reported earnings of $2.14 per share including restructuring charges, and continued reducing debt. It also highlights leadership changes, with R. David Hoover becoming the new CEO. The report pays tribute to Edmund Ball, the company's former chairman, and expresses optimism about Ball's future opportunities.
Clear Channel Communications reported financial results for the fourth quarter and full year of 2002. For the fourth quarter, revenues increased 19% to $2.2 billion and EBITDA increased 68% to $579 million. For the full year, revenues increased 6% to $8.4 billion and EBITDA rose 14% to $2.2 billion. Radio revenues increased 10% for the quarter and 8% for the year. Outdoor revenues grew 17% for the quarter and 6% for the year. Entertainment revenues were up 28% for the quarter but down 1% for the year. The company had strong free cash flow of $273 million for the quarter and $1.25 billion for the full year. Management credited
Clear Channel Communications reported record financial results for 2007. Revenue increased 6% to $6.82 billion for the full year, with net income rising 37% to $938.5 million. Earnings per share reached a record high of $1.89. Revenue and OIBDAN grew in both the radio and outdoor advertising divisions. The company also provided updates on its pending acquisition by private equity firms and its plans to divest its television and non-core radio stations.
- Ball Corporation reported second quarter earnings that were higher than the previous year's record earnings, despite some challenges. Earnings per share increased in both the quarter and first half of 2008 compared to 2007.
- Beverage can volumes remained strong in Europe and China but were lower in North America compared to the previous year. However, earnings from aerospace, food and household, and Brazil offset some of the lower beverage can earnings.
- Management expects full-year free cash flow of $300 million and net debt to be less than $2.3 billion by year-end, indicating strong second half cash flow. The company also remains on track to purchase $300 million in stock for the full year.
1) Ball Corporation is a provider of metal and plastic packaging for beverages, foods and household products, as well as aerospace technologies and services.
2) In 2006, Ball expanded its product portfolio and global footprint through acquisitions but faced challenges from inflationary pressures and a plant fire in Germany.
3) While free cash flow was lower than expected in 2006 due to high raw material inventories, Ball expects free cash flow to reach at least $350 million in 2007 as materials are drawn down and strategic actions from 2006 provide benefits.
Clear Channel Communications reported financial results for Q4 2006 and full year 2006. Revenue increased 11% to $1.94 billion in Q4 2006 and 7% to $7.07 billion for the full year. Income before discontinued operations grew 15% to $210.1 million in Q4 2006 and 688.8 million for the full year. OIBDAN increased 17% to $655.3 million in Q4 2006 and 11% to $2.28 billion for 2006. Radio revenues increased 6% to $3.7 billion for 2006 due to higher advertising rates. Outdoor revenues grew 9% to $2.9 billion for 2006 from increases in the Americas and International segments.
The document is Nordstrom's annual report (Form 10-K) filed with the SEC for the fiscal year ended February 2, 2008. It provides an overview of Nordstrom's business segments and operations, discusses competitive conditions and risks. Key points include:
- Nordstrom has four business segments: Retail Stores, Direct, Credit, and Other. Retail Stores and Direct are the main segments.
- In 2007, Nordstrom opened new stores and remodeled existing stores. It also sold its Façonnable boutiques.
- Nordstrom faces competition from other retailers and risks including its ability to respond to fashion trends, effective inventory management, and economic conditions.
This document is Nordstrom's annual report on Form 10-K filed with the SEC, summarizing its business operations for the fiscal year ended January 31, 2009. It discusses Nordstrom's segments including retail stores, direct, credit, and other. It provides an overview of Nordstrom's operations, including its store count, real estate strategy, brands, suppliers, seasonality, inventory management, and competitive environment. The report also addresses risks to Nordstrom's business from economic conditions, consumer spending, competition, and other factors.
This document is Nordstrom's annual report on Form 10-K for the fiscal year ending January 31, 2009. It provides information on Nordstrom's business operations and financial results. Specifically, [1] it describes Nordstrom's retail operations including its full-line department stores, Nordstrom Rack off-price stores, and clearance stores; [2] it notes that Nordstrom operates 171 stores across 28 U.S. states as of March 2009; and [3] it divides Nordstrom's business into four segments: Retail Stores, Direct, Credit, and Other. The filing also includes details on store openings, financial and operating results, risk factors, properties, legal proceedings, and other disclosures required in an annual
This document is Nordstrom's annual report on Form 10-K filed with the SEC, summarizing its business operations for the fiscal year ended January 31, 2009. It discusses Nordstrom's segments including Retail Stores, Direct, Credit, and Other. It provides an overview of Nordstrom's operations including its store count, real estate strategy, and sales by segment. It also outlines the company's trademarks, return policy, seasonality, inventory management, competition, employees, and regulatory filings. Key risks to Nordstrom's business from economic conditions, consumer spending patterns, competitive pricing, and effective execution of its strategies are also summarized.
2008 annual Report for PROS Holdings Inc. (NYSE:PRO)
PROS is a leading provider of prescriptive pricing and revenue management software for companies in the manufacturing, distribution, services and travel industries. PROS gives customers far greater confidence and agility in their pricing strategies by providing data-driven insights into transaction profitability, forecasting demand, recommending optimal prices for each product and deal, and streamlining pricing processes with enhanced controls and compliance. With $468 billion in revenues under management, PROS has implemented more than 500 solutions in more than 50 countries. The PROS team comprises more than 500 professionals, including 100 with advanced degrees and 25 with Ph.D.s.
StockTwits - http://stocktwits.com/PROSHoldings
Twitter - http://twitter.com/#!/mattbal4
IR Website - http://phx.corporate-ir.net/phoenix.zhtml?c=211158&p=irol-irhome
Corporate Blog - http://www.pricingleadership.com/
This document is Whole Foods Market's annual report on Form 10-K for the fiscal year ended September 28, 2008. It provides a summary of Whole Foods Market's business operations, including that it is the world's leading natural and organic supermarket with 275 stores across North America. It also discusses the natural and organic products industry trends of increased awareness of nutrition and environmental concerns driving demand. Whole Foods Market's strategy is to be the premier natural and organic grocer while promoting whole foods, whole people, and a whole planet through sustainable business practices and community support.
This document is Whole Foods Market's annual report on Form 10-K for the fiscal year ended September 28, 2008. It provides a summary of Whole Foods Market's business and operations, including that it is the world's leading natural and organic supermarket with 275 stores across North America. It discusses the growth of the natural and organic products industry. It also outlines Whole Foods Market's business strategy of emphasizing high quality natural and organic products, empowering employees, and supporting sustainable agriculture and communities. The report is filed with the SEC to comply with reporting requirements.
This document is Whole Foods Market's annual report on Form 10-K for the fiscal year ended September 28, 2008. It provides a summary of Whole Foods Market's business operations, including that it is the world's leading supermarket emphasizing natural and organic foods. It operates 275 stores across the U.S., Canada, and U.K. The report discusses factors driving growth in the natural and organic products industry. It also summarizes Whole Foods Market's business strategy of focusing on high quality products, empowering employees, and supporting sustainable agriculture and communities.
- Whole Foods Market is the largest retailer of natural and organic foods in the US, operating 186 stores across North
America.
- The document is Whole Foods Market's annual report on Form 10-K, filed with the SEC for the fiscal year ended
September 24, 2006.
- It provides an overview of the company's business including its mission, strategy, values and growth in the natural
products industry.
The document is Interpublic Group's annual report (Form 10-K) for the fiscal year ended December 31, 2007. It provides an overview of the company's business, including its market strategy, offering of advertising and marketing services through global agency brands like McCann Worldgroup, Draftfcb, and Lowe Worldwide. The report also discusses risks, properties, legal proceedings, stock performance, financial data, controls and procedures, and incorporates sections on leadership, compensation, and accounting matters by reference to the company's proxy statement.
This document is Regions Financial Corporation's annual report (Form 10-K) filed with the SEC for the year ended December 31, 2008. It provides an overview of Regions' business operations, including its banking operations conducted through Regions Bank and over 1,900 branches across 16 states, as well as other financial services offered through subsidiaries like Morgan Keegan and Regions Insurance Group. The report also includes sections on risk factors, legal proceedings, financial statements and other standard Form 10-K report sections.
This document is Whole Foods Market's annual report on Form 10-K for the fiscal year ended September 30, 2007. It provides information on Whole Foods Market's business including an overview of the company and the natural and organic products industry, details of the company's acquisition of Wild Oats Markets, and discusses its business strategy, core values, and foundations which support its mission of promoting health and sustainability.
Fiscal 2011 was a year of positive sales growth and improved profitability for The Home Depot. The company increased sales through merchandising and supply chain transformations, improved technology, and effective expense control. The Home Depot remains committed to providing excellent customer service, being a trusted source of product information for homeowners and professionals, and leveraging its interconnected retail strategy across stores and online.
The document is Thermo Fisher Scientific's annual report on Form 10-K for the fiscal year ended December 31, 2006. It provides information on the company's business operations and financial performance. Specifically, it discusses Thermo Fisher's merger with Fisher Scientific to create a global leader in serving science. It also describes the company's two business segments - Analytical Technologies and Laboratory Products and Services - and provides an overview of key product lines within the Analytical Technologies segment, including scientific instruments, biosciences products, and diagnostic and environmental instruments.
This document is Terex Corporation's annual report (Form 10-K) filed with the SEC for the 2005 fiscal year. It provides an overview of Terex's five business segments which include construction, cranes, aerial work platforms, materials processing and mining, and roadbuilding/utility products. For each segment, it lists the primary product types and significant manufacturing locations. It also discloses that Terex aims to improve returns on invested capital through its Terex Business System initiative and lean manufacturing principles.
This document is Ameriprise Financial's annual report on Form 10-K, filed with the SEC. It summarizes Ameriprise's business operations for the fiscal year ended December 31, 2006. Ameriprise provides financial planning and products to help clients achieve their asset accumulation, income and protection needs through long-term relationships with over 12,000 affiliated financial advisors serving around 2.8 million clients. As a holding company, Ameriprise primarily conducts business through its subsidiaries. The Form 10-K includes details on Ameriprise's business segments, risk factors, legal proceedings, financial statements and other required disclosures.
plains all american pipeline Table of Contents and Forward Looking Statement...finance13
This document is Plains All American Pipeline's annual report on Form 10-K for the fiscal year ending December 31, 2002 filed with the United States Securities and Exchange Commission. It provides an overview of the company's business and properties, legal proceedings, security ownership, executive compensation, and financial statements. The report contains forward-looking statements about future performance and results that are based on certain assumptions and could differ materially due to various risk factors.
WRA worked on energy, water, and public lands issues in 2003. In energy, they promoted renewable energy standards and efficiency measures. They also worked to reduce emissions from coal plants and prevent new coal plant construction. In water, they advocated for urban water conservation and efficiency and protected rivers and habitats. In lands, they focused on responsible oil and gas development, protecting roadless areas, managing motorized recreation, and grazing reform.
The annual report summarizes the organization's activities and accomplishments in 2006. Some key points:
- The organization celebrated a major victory that protected water rights and flows for Colorado's Gunnison River.
- The organization opened a new office in Nevada and added staff in multiple states to advance its mission of protecting land, air, and water resources in the Interior West.
- Notable programs and advocacy efforts achieved successes in renewable energy development, limiting new coal-fired power plants, protecting public lands from oil/gas development, and responsible management of motorized recreation on public lands.
Western Resource Advocates' (WRA) 2007 annual report summarizes the organization's work over the past year to protect land, air, water, and ecosystems in the Western United States. The report highlights WRA's efforts to promote clean energy alternatives to coal power, encourage responsible motorized recreation on public lands, influence oil and gas development policies, and implement water conservation strategies in urban areas. Through advocacy, litigation, and partnerships with other groups, WRA achieved victories such as blocking new coal plants, protecting roads and lands from off-road vehicle damage, passing legislation to safeguard wildlife from drilling impacts, and influencing several municipalities to adopt water conservation measures. The report outlines WRA's goals and strategies across its key program
C.H. Robinson achieved strong success in 2007 despite economic challenges. The company grew gross profits 14.9% to $1.2 billion through its diverse business lines and relationships with customers and carriers. Its non-asset based model allowed it to efficiently manage costs. The company continued investing in its business by expanding its office network and adding employees. C.H. Robinson is well positioned for future growth given ongoing trends driving demand for third party logistics.
This document is C.H. Robinson Worldwide's annual report (Form 10-K) filed with the SEC for the year ended December 31, 2007. It provides an overview of the company's business operations, including that it is a non-asset based third party logistics provider offering freight transportation and logistics services through a network of 218 offices worldwide. The report describes C.H. Robinson's main business lines of multimodal transportation services, fresh produce sourcing, and information services. It provides details on the types of transportation it arranges and its relationships with over 48,000 transportation providers.
This document is C.H. Robinson Worldwide's definitive proxy statement filed with the SEC on April 1, 2008 to provide shareholders information on matters to be voted on at the company's upcoming annual meeting on May 15, 2008. The proxy statement summarizes the purposes of the meeting as electing three directors, ratifying the selection of the independent auditors, and any other business properly brought before the meeting. It provides details on shareholder voting eligibility, the methods by which shareholders can vote including by mail, phone or internet, and the proposals to be voted on.
C.H. Robinson achieved strong success in 2007 despite challenging market conditions. The company grew gross profits 14.9% to $1.2 billion through its diverse mix of transportation services and customer relationships. Its non-asset based model and over 7,300 employees enabled it to efficiently manage over 6.5 million shipments. Looking ahead, C.H. Robinson is well positioned for continued growth given industry trends, its financial strength with no debt and $455 million in cash, and opportunities to expand internationally and through acquisitions.
This document is a Form 10-Q quarterly report filed by KB Home with the Securities and Exchange Commission. It summarizes KB Home's financial performance for the first quarter of fiscal year 2003, ending February 28, 2003. Key details include total revenues of $1.09 billion, net income of $52.8 million, basic earnings per share of $1.32, and cash dividends of $0.075 per share. The report includes financial statements and notes, as well as sections on management discussion/analysis, market risk, and controls/procedures.
There are three primary ways for individual investors to hold securities: direct registration system (DRS), physical paper certificates, and street-name registration through a brokerage account. Both DRS and street-name registration involve book-entry ownership with no physical certificate printed, while transactions are recorded electronically. Investors can choose to hold securities through different methods and change methods as desired, though brokers may charge fees. The DRS allows electronic transfer of book-entry shares between parties like brokers and issuers.
KBH was established as a public company in 1986 through an IPO of Kaufman and Broad Inc. (KBI). In 1989, the remaining portion of KBH was distributed to KBI shareholders, making KBH and KBI independent companies. KBI later merged with American International Group (AIG) in 1999. The document provides guidance on determining the tax basis for holdings in KBH and KBI/AIG following corporate restructurings and stock splits over the years. Questions regarding stock certificates or exchanges should be directed to AIG's transfer agent.
This document lists milestones from KB Home, a homebuilder, over the past 50+ years. Some key milestones include KB Home becoming the first national homebuilder on the New York Stock Exchange in 1969, building over 100,000 homes by 1977, establishing sustainability programs and receiving awards for energy efficient construction in the 2000s-2010s, and expanding nationwide through strategic acquisitions over the decades. The milestones show KB Home's growth from its founding to becoming one of the largest homebuilders in the United States.
This document is a Form 10-Q quarterly report filed by KB Home with the Securities and Exchange Commission for the quarter ended February 28, 2003. The 10-Q includes financial statements such as income statements, balance sheets, and cash flow statements for the quarter, as well as notes to the financial statements. It provides information on KB Home's revenues, expenses, assets, liabilities, cash flows, earnings per share, and reporting segments for its homebuilding and mortgage banking businesses.
This document is the Form 10-Q quarterly report filed by KB Home with the Securities and Exchange Commission for the quarter ended May 31, 2003. It includes the consolidated financial statements, notes to the financial statements, and management's discussion and analysis of the company's financial condition and results of operations for the quarter. Key details include total revenues of $2.5 billion for the six months ended May 31, 2003, net income of $134 million, and basic earnings per share of $3.36.
This document is the Form 10-Q quarterly report filed by KB Home with the Securities and Exchange Commission for the quarter ended May 31, 2003. The 10-Q provides KB Home's unaudited financial statements and disclosures including the consolidated statements of income, balance sheets, cash flows, and notes. It summarizes KB Home's revenues, construction and land costs, expenses, operating income, interest income/expense, taxes, and earnings per share for the interim period.
This document is a Form 10-Q quarterly report filed by KB Home with the Securities and Exchange Commission for the quarter ended August 31, 2003. The 10-Q provides financial statements and disclosures including the consolidated statements of income, balance sheets, cash flows, and notes to the financial statements. Key details include revenues of $3.98 billion for the nine months, net income of $232 million, basic EPS of $5.87, and total assets of $4.12 billion as of August 31, 2003.
This document is a Form 10-Q quarterly report filed by KB Home with the Securities and Exchange Commission for the quarter ended August 31, 2003. The 10-Q provides financial statements and disclosures including the consolidated statements of income, balance sheets, cash flows, and notes to the financial statements. It discloses that for the quarter ended August 31, 2003, KB Home had total revenues of $1.44 billion, net income of $97.8 million, and basic earnings per share of $2.51.
This document is a Form 10-Q quarterly report filed by KB Home with the SEC for the quarter ending May 31, 2004. The summary includes:
1) KB Home reported total revenues of $2.9 billion for the six months ended May 31, 2004, with construction pretax income of $258.7 million and mortgage banking pretax income of $4.5 million.
2) The balance sheet shows KB Home's assets including $65.6 million in cash, $429.2 million in receivables, and $3.55 billion in construction inventories as of May 31, 2004.
3) The document provides KB Home's financial statements and notes for the quarter,
This document is KB Home's Form 10-Q quarterly report filed with the SEC for the quarterly period ended February 29, 2004. It includes financial statements such as the consolidated statements of income and balance sheets, as well as notes to the financial statements and information on reportable segments. The filing provides shareholders and the public with financial information on KB Home's construction and mortgage banking operations for the quarterly period.
This document is a Form 10-Q quarterly report filed by KB Home with the SEC for the quarter ending May 31, 2004. The summary includes:
1) KB Home reported total revenues of $2.9 billion for the six months ended May 31, 2004, with construction pretax income of $258.7 million and mortgage banking pretax income of $4.5 million.
2) The balance sheet shows KB Home's assets including $65.6 million in cash, $429.2 million in receivables, and $3.55 billion in construction inventories as of May 31, 2004.
3) The document provides KB Home's financial statements and notes for the quarter,
Unlock Your Potential with NCVT MIS.pptxcosmo-soil
The NCVT MIS Certificate, issued by the National Council for Vocational Training (NCVT), is a crucial credential for skill development in India. Recognized nationwide, it verifies vocational training across diverse trades, enhancing employment prospects, standardizing training quality, and promoting self-employment. This certification is integral to India's growing labor force, fostering skill development and economic growth.
Independent Study - College of Wooster Research (2023-2024) FDI, Culture, Glo...AntoniaOwensDetwiler
"Does Foreign Direct Investment Negatively Affect Preservation of Culture in the Global South? Case Studies in Thailand and Cambodia."
Do elements of globalization, such as Foreign Direct Investment (FDI), negatively affect the ability of countries in the Global South to preserve their culture? This research aims to answer this question by employing a cross-sectional comparative case study analysis utilizing methods of difference. Thailand and Cambodia are compared as they are in the same region and have a similar culture. The metric of difference between Thailand and Cambodia is their ability to preserve their culture. This ability is operationalized by their respective attitudes towards FDI; Thailand imposes stringent regulations and limitations on FDI while Cambodia does not hesitate to accept most FDI and imposes fewer limitations. The evidence from this study suggests that FDI from globally influential countries with high gross domestic products (GDPs) (e.g. China, U.S.) challenges the ability of countries with lower GDPs (e.g. Cambodia) to protect their culture. Furthermore, the ability, or lack thereof, of the receiving countries to protect their culture is amplified by the existence and implementation of restrictive FDI policies imposed by their governments.
My study abroad in Bali, Indonesia, inspired this research topic as I noticed how globalization is changing the culture of its people. I learned their language and way of life which helped me understand the beauty and importance of cultural preservation. I believe we could all benefit from learning new perspectives as they could help us ideate solutions to contemporary issues and empathize with others.
Optimizing Net Interest Margin (NIM) in the Financial Sector (With Examples).pdfshruti1menon2
NIM is calculated as the difference between interest income earned and interest expenses paid, divided by interest-earning assets.
Importance: NIM serves as a critical measure of a financial institution's profitability and operational efficiency. It reflects how effectively the institution is utilizing its interest-earning assets to generate income while managing interest costs.
^%$Zone1:+971)581248768’][* Legit & Safe #Abortion #Pills #For #Sale In #Duba...mayaclinic18
Whatsapp (+971581248768) Buy Abortion Pills In Dubai/ Qatar/Kuwait/Doha/Abu Dhabi/Alain/RAK City/Satwa/Al Ain/Abortion Pills For Sale In Qatar, Doha. Abu az Zuluf. Abu Thaylah. Ad Dawhah al Jadidah. Al Arish, Al Bida ash Sharqiyah, Al Ghanim, Al Ghuwariyah, Qatari, Abu Dhabi, Dubai.. WHATSAPP +971)581248768 Abortion Pills / Cytotec Tablets Available in Dubai, Sharjah, Abudhabi, Ajman, Alain, Fujeira, Ras Al Khaima, Umm Al Quwain., UAE, buy cytotec in Dubai– Where I can buy abortion pills in Dubai,+971582071918where I can buy abortion pills in Abudhabi +971)581248768 , where I can buy abortion pills in Sharjah,+97158207191 8where I can buy abortion pills in Ajman, +971)581248768 where I can buy abortion pills in Umm al Quwain +971)581248768 , where I can buy abortion pills in Fujairah +971)581248768 , where I can buy abortion pills in Ras al Khaimah +971)581248768 , where I can buy abortion pills in Alain+971)581248768 , where I can buy abortion pills in UAE +971)581248768 we are providing cytotec 200mg abortion pill in dubai, uae.Medication abortion offers an alternative to Surgical Abortion for women in the early weeks of pregnancy. Zone1:+971)581248768’][* Legit & Safe #Abortion #Pills #For #Sale In #Dubai Abu Dhabi Sharjah Deira Ajman Fujairah Ras Al Khaimah%^^%$Zone1:+971)581248768’][* Legit & Safe #Abortion #Pills #For #Sale In #Dubai Abu Dhabi Sharjah Deira Ajman Fujairah Ras Al Khaimah%^^%$Zone1:+971)581248768’][* Legit & Safe #Abortion #Pills #For #Sale In #Dubai Abu Dhabi Sharjah Deira Ajman Fujairah Ras Al Khaimah%^^%$Zone1:+971)581248768’][* Legit & Safe #Abortion #Pills #For #Sale In #Dubai Abu Dhabi Sharjah Deira Ajman Fujairah Ras Al Khaimah%^^%$Zone1:+971)581248768’][* Legit & Safe #Abortion #Pills #For #Sale In #Dubai Abu Dhabi Sharjah Deira Ajman Fujairah Ras Al Khaimah%^^%$Zone1:+971)581248768’][* Legit & Safe #Abortion #Pills #For #Sale In #Dubai Abu Dhabi Sharjah Deira Ajman Fujairah Ras Al Khaimah%^^%$Zone1:+971)581248768’][* Legit & Safe #Abortion #Pills #For #Sale In #Dubai Abu Dhabi Sharjah Deira Ajman Fujairah Ras Al Khaimah%^^%$Zone1:+971)581248768’][* Legit & Safe #Abortion #Pills #For #Sale In #Dubai Abu Dhabi Sharjah Deira Ajman Fujairah Ras Al Khaimah%^^%$Zone1:+971)581248768’][* Legit & Safe #Abortion #Pills #For #Sale In #Dubai Abu Dhabi Sharjah Deira Ajman Fujairah Ras Al Khaimah%^^%$Zone1:+971)581248768’][* Legit & Safe #Abortion #Pills #For #Sale In #Dubai Abu Dhabi Sharjah Deira Ajman Fujairah Ras Al Khaimah%^^%$Zone1:+971)581248768’][* Legit & Safe #Abortion #Pills #For #Sale In #Dubai Abu Dhabi Sharjah Deira Ajman Fujairah Ras Al Khaimah%^^%$Zone1:+971)581248768’][* Legit & Safe #Abortion #Pills #For #Sale In #Dubai Abu Dhabi Sharjah Deira Ajman Fujairah Ras Al Khaimah%^^%$Zone1:+971)581248768’][* Legit & Safe #Abortion #Pills #For #Sale In #Dubai Abu Dhabi Sharjah Deira Ajman Fujairah Ras Al Khaimah%^^%$Zone1:+971)581248768’][* Legit & Safe #Abortion #Pills #For #Sale In #Dubai Abu Dhabi Sharjah Deira Ajman
A toxic combination of 15 years of low growth, and four decades of high inequality, has left Britain poorer and falling behind its peers. Productivity growth is weak and public investment is low, while wages today are no higher than they were before the financial crisis. Britain needs a new economic strategy to lift itself out of stagnation.
Scotland is in many ways a microcosm of this challenge. It has become a hub for creative industries, is home to several world-class universities and a thriving community of businesses – strengths that need to be harness and leveraged. But it also has high levels of deprivation, with homelessness reaching a record high and nearly half a million people living in very deep poverty last year. Scotland won’t be truly thriving unless it finds ways to ensure that all its inhabitants benefit from growth and investment. This is the central challenge facing policy makers both in Holyrood and Westminster.
What should a new national economic strategy for Scotland include? What would the pursuit of stronger economic growth mean for local, national and UK-wide policy makers? How will economic change affect the jobs we do, the places we live and the businesses we work for? And what are the prospects for cities like Glasgow, and nations like Scotland, in rising to these challenges?
Falcon stands out as a top-tier P2P Invoice Discounting platform in India, bridging esteemed blue-chip companies and eager investors. Our goal is to transform the investment landscape in India by establishing a comprehensive destination for borrowers and investors with diverse profiles and needs, all while minimizing risk. What sets Falcon apart is the elimination of intermediaries such as commercial banks and depository institutions, allowing investors to enjoy higher yields.
Discover the Future of Dogecoin with Our Comprehensive Guidance36 Crypto
Learn in-depth about Dogecoin's trajectory and stay informed with 36crypto's essential and up-to-date information about the crypto space.
Our presentation delves into Dogecoin's potential future, exploring whether it's destined to skyrocket to the moon or face a downward spiral. In addition, it highlights invaluable insights. Don't miss out on this opportunity to enhance your crypto understanding!
https://36crypto.com/the-future-of-dogecoin-how-high-can-this-cryptocurrency-reach/
South Dakota State University degree offer diploma Transcriptynfqplhm
办理美国SDSU毕业证书制作南达科他州立大学假文凭定制Q微168899991做SDSU留信网教留服认证海牙认证改SDSU成绩单GPA做SDSU假学位证假文凭高仿毕业证GRE代考如何申请南达科他州立大学South Dakota State University degree offer diploma Transcript
New Visa Rules for Tourists and Students in Thailand | Amit Kakkar Easy VisaAmit Kakkar
Discover essential details about Thailand's recent visa policy changes, tailored for tourists and students. Amit Kakkar Easy Visa provides a comprehensive overview of new requirements, application processes, and tips to ensure a smooth transition for all travelers.
Economic Risk Factor Update: June 2024 [SlideShare]Commonwealth
May’s reports showed signs of continued economic growth, said Sam Millette, director, fixed income, in his latest Economic Risk Factor Update.
For more market updates, subscribe to The Independent Market Observer at https://blog.commonwealth.com/independent-market-observer.
1. UNITED STATES
SECURITIES AND EXCHANGE COMMISSION
WASHINGTON, DC 20549
FORM 10-K
Annual report pursuant to Section 13 or 15(d) of the Securities Exchange Act of 1934
For the fiscal year ended December 31, 2007, or
Transition report pursuant to Section 13 or 15(d) of the Securities Exchange Act of 1934
For the transition period from to .
Commission File Number
1-9645
CLEAR CHANNEL COMMUNICATIONS, INC.
(Exact name of registrant as specified in its charter)
Texas 74-1787539
(State of Incorporation) (I.R.S. Employer Identification No.)
200 East Basse Road
San Antonio, Texas 78209
Telephone (210) 822-2828
(Address, including zip code, and telephone number,
including area code, of registrant’s principal executive offices)
Securities registered pursuant to Section 12(b) of the Act:
Title of each class Name of each exchange on which registered
Common Stock, $0.10 par value per share New York Stock Exchange
Securities registered pursuant to Section 12(g) of the Act: None.
Indicate by check mark if the registrant is a well-known seasoned issuer, as defined in Rule 405 of the Securities Act. YES NO
Indicate by check mark if the registrant is not required to file reports pursuant to Section 13 or Section 15(d) of the Exchange Act.
YES NO
Indicate by check mark whether the registrant (1) has filed all reports required to be filed by Section 13 or 15(d) of the Securities Exchange Act
of 1934 during the preceding 12 months (or for such shorter period that the registrant was required to file such reports), and (2) has been
subject to such filing requirements for the past 90 days. YES NO
Indicate by check mark if disclosure of delinquent filers pursuant to Item 405 of Regulation S-K is not contained herein, and will not be
contained, to the best of registrant’s knowledge, in definitive proxy or information statements incorporated by reference in Part III of this Form
10-K or any amendment to this Form 10-K.
Indicate by check mark whether the registrant is a large accelerated filer, an accelerated filer, a non-accelerated filer, or a smaller reporting
company. See definition of “large accelerated filer,” “accelerated filer” and “smaller reporting company” in Rule 12b-2 of the Exchange Act.
(Check one):
Large accelerated filer Accelerated filer Non-accelerated filer Smaller reporting company
(Do not check if a smaller reporting company)
Indicate by checkmark whether the registrant is a shell company (as defined in Exchange Act Rule 12b-2). YES NO
As of June 30, 2007, the aggregate market value of the Common Stock beneficially held by non-affiliates of the registrant was approximately
$17.4 billion based on the closing sale price as reported on the New York Stock Exchange. (For purposes hereof, directors, executive officers
and 10% or greater shareholders have been deemed affiliates).
On February 13, 2008, there were 497,879,312 outstanding shares of Common Stock, excluding 173,897 shares held in treasury.
DOCUMENTS INCORPORATED BY REFERENCE
Portions of our Definitive Proxy Statement for the 2008 Annual Meeting, expected to be filed within 120 days of our fiscal year end, are
incorporated by reference into Part III.
2. CLEAR CHANNEL COMMUNICATIONS, INC.
INDEX TO FORM 10-K
Page
Number
PART I.
Item 1. Business 3
Item 1A. Risk Factors 25
Item 1B. Unresolved Staff Comments 32
Item 2. Properties 32
Item 3. Legal Proceedings 33
Item 4. Submission of Matters to a Vote of Security Holders 34
PART II.
Item 5. Market for Registrant’s Common Equity, Related Stockholder Matters and Issuer Purchases of Equity Securities 35
Item 6. Selected Financial Data 36
Item 7. Management’s Discussion and Analysis of Financial Condition and Results of Operations 38
Item 7A. Quantitative and Qualitative Disclosures about Market Risk 58
Item 8. Financial Statements and Supplementary Data 59
Item 9. Changes in and Disagreements with Accountants on Accounting and Financial Disclosure 98
Item 9A. Controls and Procedures 99
Item 9B. Other Information 100
PART III.
Item 10. Directors, Executive Officers and Corporate Governance 101
Item 11. Executive Compensation 102
Item 12. Security Ownership of Certain Beneficial Owners and Management and Related Stockholder Matters 102
Item 13. Certain Relationships and Related Transactions and Director Independence 102
Item 14 Principal Accounting Fees and Services 102
PART IV.
Item 15. Exhibits and Financial Statement Schedules 103
3. PART I
ITEM 1. Business
Agreement and Plan of Merger
On November 16, 2006, we entered into an Agreement and Plan of Merger (the “Merger Agreement”), as amended, with BT Triple
Crown Merger Co., Inc. (“Merger Sub”), B Triple Crown Finco, LLC and T Triple Crown Finco, LLC (together with B Triple Crown Finco,
LLC, the “Fincos”). The Fincos were formed by private equity funds sponsored by Bain Capital Partners, LLC and Thomas H. Lee Partners,
L.P. solely for the purpose of entering into the Merger Agreement and consummating the transactions contemplated by the Merger Agreement.
Upon the satisfaction of the conditions set forth in the Merger Agreement, CC Media Holdings, Inc. will acquire us. The acquisition will be
effected by the merger of Merger Sub with and into us. As a result of the merger, we will become a wholly-owned subsidiary of CC Media
Holdings, Inc.
Under the terms of the Merger Agreement, as amended, our shareholders will receive $39.20 in cash for each share they own plus
additional per share consideration, if any, as the closing of the merger will occur after December 31, 2007. For a description of the computation
of any additional per share consideration and the circumstances under which it is payable, please refer to the joint proxy statement/prospectus
dated August 21, 2007, filed with the Securities & Exchange Commission (the “Proxy Statement”). As an alternative to receiving the $39.20
per share cash consideration, our unaffiliated shareholders were offered the opportunity on a purely voluntary basis to exchange some or all of
their shares of our common stock on a one-for-one basis for shares of Class A common stock of CC Media Holdings, Inc. (subject to aggregate
and individual caps), plus the additional per share consideration, if any.
Holders of shares of our common stock (including shares issuable upon conversion of outstanding options) in excess of the aggregate cap
provided in the Merger Agreement, as amended, elected to receive the stock consideration. As a result, unaffiliated shareholders of ours will
own an aggregate of 30.6 million shares of CC Media Holdings, Inc. Class A common stock upon consummation of the merger.
The Merger Agreement was approved by our shareholders, but remains subject to customary closing conditions. Assuming satisfaction of
the closing conditions, the parties expect to close the merger by the end of the first quarter of 2008.
The Company
We are a diversified media company incorporated in 1974 with three reportable business segments: radio broadcasting, Americas outdoor
advertising (consisting primarily of operations in the United States, Canada and Latin America) and International outdoor advertising. On
November 11, 2005, we completed the initial public offering, or IPO, of approximately 10% of the common stock of Clear Channel Outdoor
Holdings, Inc., or CCO, comprised of our Americas and International outdoor segments. On December 21, 2005 we completed the spin-off of
our former live entertainment segment, which now operates under the name Live Nation.
As of December 31, 2007, we owned 717 core radio stations, 288 non-core radio stations which are being marketed for sale and a leading
national radio network operating in the United States. In addition, we had equity interests in various international radio broadcasting
companies. For the year ended December 31, 2007, the radio broadcasting segment represented 50% of our total revenue. As of December 31,
2007, we also owned or operated approximately 209,000 Americas outdoor advertising display faces and approximately 687,000 International
outdoor advertising display faces. For the year ended December 31, 2007, the Americas and International outdoor advertising segments
represented 21% and 26% of our total revenue, respectively. As of December 31, 2007 we also owned a media representation firm, as well as
other general support services and initiatives, all of which are within the category “other”. This segment represented 3% of our total revenue for
the year ended December 31, 2007.
You can find more information about us at our Internet website located at www.clearchannel.com. Our Annual Report on Form 10-K,
our Quarterly Reports on Form 10-Q, our Current Reports on Form 8-K and any amendments to those reports are available free of charge on
our Internet website as soon as reasonably practicable after we electronically file such material with the SEC.
Our principal executive offices are located at 200 East Basse Road, San Antonio, Texas 78209 (telephone: 210-822-2828).
3
4. Recent Developments
On November 16, 2006, we announced plans to sell 448 non-core radio stations and all of our television stations. As of February 13,
2008, we sold 217 non-core radio stations and were party to definitive purchase agreements to sell 28 non-core radio stations.
On April 20, 2007, we entered into a definitive agreement with an affiliate (“buyer”) of Providence Equity Partners Inc. (“Providence”)
to sell our television business. Subsequently, a representative of Providence informed us that the buyer is considering its options under the
definitive agreement, including not closing the acquisition on the terms and conditions in the definitive agreement. The definitive agreement is
in full force and effect, has not been terminated and contains customary closing conditions. There have been no allegations that we have
breached any of the terms or conditions of the definitive agreement or that there is a failure of a condition to closing the acquisition. On
November 29, 2007, the FCC issued its initial consent order approving the assignment of our television station licenses to the buyer.
On January 17, 2008, we entered into an agreement to sell our equity investment in Clear Channel Independent, an out-of-home
advertising company headquartered in South Africa with operations in Angola, Botswana, Lesotho, Malawi, Mauritius, Mozambique, Namibia,
South Africa, Swaziland, Tanzania, Uganda and Zambia. The closing of the transaction is subject to regulatory approval and other customary
closing conditions.
The sale of these assets is not a condition to the closing of the merger and is not contingent on the closing of the merger.
Operating Segments
We have three reportable business segments: Radio Broadcasting, Americas Outdoor Advertising and International Outdoor Advertising.
Radio Broadcasting. As of December 31, 2007, we owned 717 core domestic radio stations, with 275 stations operating in the top 50
•
markets. Our portfolio of stations offers a broad assortment of programming formats, including adult contemporary, country,
contemporary hit radio, rock, urban and oldies, among others, to a total weekly listening base of over 93 million individuals based on
Arbitron National Regional Database figures for the Spring 2007 ratings period. In addition to our radio broadcasting business, we
operate a national radio network that produces, distributes or represents approximately 70 syndicated radio programs and services for
approximately 5,000 radio stations. Some of our more popular syndicated programs include Rush Limbaugh, Steve Harvey, Ryan
Seacrest and Jeff Foxworthy. We also own various sports, news and agriculture networks. In addition, we own 288 smaller market
non-core radio stations which we previously announced are being marketed for sale. Of these stations, 73 were under definitive asset
purchase agreements as of December 31, 2007. For the year ended December 31, 2007, Radio Broadcasting represented 50% of our
net revenue.
Americas Outdoor Advertising. Our Americas Outdoor Advertising, or Americas, business segment includes our operations in the
•
United States, Canada and Latin America. We own or operate approximately 209,000 displays in our Americas Outdoor Advertising
segment. Our outdoor assets consist of billboards, street furniture and transit displays, airport displays, mall displays, and wallscapes
and other spectaculars. We have operations in 49 of the top 50 markets in the United States, including all of the top 20 markets. For the
year ended December 31, 2007, Americas represented 21% of our net revenue.
International Outdoor Advertising. Our International Outdoor Advertising business segment includes our operations in Africa, Asia,
•
Australia and Europe. We own or operate approximately 687,000 displays in approximately 50 countries. Our international outdoor
assets consist of billboards, street furniture displays, transit displays and other out-of-home advertising displays. Subsequent to
December 31, 2007 we entered into an agreement to sell our operations in Africa. For the year ended December 31, 2007 International
represented 26% of our net revenue.
Other. The Other category includes our media representation business, Katz Media, and general support services and initiatives which
•
are ancillary to our other businesses. Katz Media is a full-service media representation firm that sells national spot advertising time for
clients in the radio and television industries throughout the United States. Katz Media represents approximately 3,200 radio stations,
nearly one third of which are owned by us, and approximately 380 television stations, nearly one tenth of which are owned by us.
Our television operations include 56 stations, 18 of which are distributed as digital multicast stations. Our stations are affiliated with
various television networks including ABC, CBS, NBC and FOX. On April 20, 2007, we entered into a definitive agreement to sell all
of our television operations. Our television business is
4
5. reported as assets and liabilities of discontinued operations on our consolidated balance sheet and the results of operations as
discontinued operations on our statements of operations.
Our Strengths
Global Scale and Local Market Leadership. We own 717 core radio stations in over 100 markets in the United States and operate over
897,000 outdoor advertising displays worldwide. We believe our global scale enables productive and cost-effective investment across our
portfolio.
We have a total weekly listening base of approximately 93 million individuals based on the Arbitron National Regional Database
•
figures for the Spring 2007 ratings period. With over 5,000 sales people in local markets, we believe the aggregation of our local sales
forces comprises the media industry’s largest local-based sales force with national scope. Our national scope has facilitated cost-
effective investment in unique yield management and pricing systems that we believe enable our local salespeople to maximize
revenue. Additionally, our scale has allowed us to implement initiatives that we believe differentiate us from the rest of the radio
industry.
Our outdoor advertising business is focused on urban markets with dense populations. Our real estate locations in these urban markets
•
provide outstanding reach and frequency for our advertisers. In the United States, we operate in all of the top 20 markets.
Internationally, we operate in France, Italy, Spain and the United Kingdom, as well as several attractive growth countries, including
Australia and China. We have invested in real estate locations and new display technologies, such as digital billboards, which we
believe will continue to support future revenue growth.
Attractive Out-of-home Industry Fundamentals. We believe both radio broadcasting and outdoor advertising offer valuable out-of-
home positions and compelling value propositions to advertisers.
Audience Reach. Radio programming reaches 93% of all United States consumers in a given week as reported by Arbitron RADAR 93
•
(June 2007), with the average consumer listening for almost three hours per day. On a weekly basis, this represents nearly 233 million
unique listeners as reported by Arbitron RADAR 95 (December 2007). Additionally, 98% of Americans travel in a car each week as
reported by the Arbitron National In-Car Study (July 2003).
Valuable Out-of-home Position. Both radio broadcasting and outdoor media reach potential consumers outside of the home, which we
•
believe is a valuable position as it is closer to the purchase decision. Today, consumers spend a significant portion of their day out-of-
home, while out-of-home media (outdoor and radio) garner a disproportionately smaller share of media spending than in-home media.
We believe this discrepancy represents an opportunity for growth.
Compelling Value Propositions. We believe outdoor media and radio broadcasting offer compelling value propositions to advertisers
•
by providing cost effective media advertising outlets, as measured by persons reached per dollar invested. We believe the cost
effectiveness of radio broadcasting and outdoor media provide opportunity for growth.
Consistent, Defensible Growth Profile. Both radio and outdoor advertising have demonstrated consistent growth over the last 40 years
and are generally resilient in economic downturns.
Radio advertising revenue has grown to approximately $20 billion in 2006, representing an 8% compound annual growth rate, or
•
CAGR, since 1970. Radio broadcasting has been one of the most resilient forms of advertising, weathering several competitive and
technological advancements over time, including the introduction of television, audio cassettes, CDs and other portable audio devices,
and remaining an important component of local advertiser marketing budgets. The radio industry has experienced only two negative
growth years between 1970 and 2006, with the growth rate in the two years following an economic recession averaging 9%. We expect
growth to be driven by increased advertising, a captive audience spending more time in their cars and the adoption of new technologies
such as HD radio.
Outdoor advertising revenue has grown to approximately $7 billion in 2006, representing a 10% CAGR since 1970. Growth has come
•
via traditional billboards along highways and major roadways, as well as alternative advertising including transit displays, street
furniture and mall displays. The outdoor industry has experienced only two negative growth years between 1970 and 2006, with the
growth rate in the two years following an economic recession averaging 13%. We expect growth to be driven by increased share of
media spending and rollout of digital billboards.
Business Diversity. Our business is comprised of numerous individual operating units in local markets throughout the United States and
the rest of the world. Approximately half of our revenue is generated from our Radio
5
6. Broadcasting segment, with the remaining half comprised of our Americas and International business segments, as well as other support
services and initiatives. We believe we offer advertisers a diverse platform of media assets across geographies, radio programming formats and
outdoor products. We enjoy substantial diversity in our radio business, with no market greater than 9%, no format greater than 18%, and no ad
category greater than 19% of 2007 radio revenue. We also enjoy substantial diversity in our outdoor business, with no market greater than 8%
and no ad category greater than 8% of our 2007 outdoor revenue. We are able to reduce revenue volatility resulting from softness in any one
advertising category or geographic market because of this diversity.
Experienced Management Team and Entrepreneurial Culture. We have an experienced management team from our senior executives
to our local market managers. Our executive officers and certain radio and outdoor senior managers possess an average of 21 years of industry
experience, and have combined experience of over 250 years. The core of the executive management team includes Chief Executive Officer
Mark Mays, who has been with the Company for over 18 years, and President and Chief Financial Officer Randall Mays, who has been with
the Company for over 14 years. We also maintain an entrepreneurial culture empowering local market managers to operate their markets as
separate profit centers, subject to centralized oversight. A portion of our managers’ compensation is dependent upon the financial success of
their individual market. Our managers also have full access to our centralized resources, including sales training, research tools, shared best
practices, global procurement and financial and legal support.
Our Strategy
Our goal is to strengthen our position as a leading global media company specializing in “out-of-home” advertising. We plan to achieve
this objective by capitalizing on our competitive strengths and pursuing the following strategies:
Radio
Our radio broadcasting strategy centers on providing programming and services to the local communities in which we operate and being
a contributing member of those communities. We believe that by serving the needs of local communities, we will be able to grow listenership
and deliver target audiences to advertisers, thereby growing revenue and cash flow. Our radio broadcasting strategy also entails improving the
ongoing operations of our stations through effective programming, promotion, marketing and sales and careful management of costs.
Drive Local and National Advertising. We intend to drive growth in our radio business via a strong focus on yield management,
increased sales force effectiveness and expansion of our sales channels. In late 2004, we implemented price and yield optimization systems and
invested in new information systems, which provide station level inventory yield and pricing information previously unavailable. We shifted
our sales force compensation plan from a straight “volume-based” commission percentages system to a “value-based” system to reward success
in optimizing price and inventory. We believe that utilization of our unique systems throughout our distribution platform will drive continued
revenue growth. We also intend to focus on driving advertisers to our radio stations through new sales channels and partnerships. For example,
we recently formed an alliance with Google whereby we have gained access to an entirely new group of advertisers within a new and
complementary sales channel.
Continue to Capitalize on “Less is More.” In late 2004, we launched the Less is More initiative to enhance listener experience, reduce
advertising clutter and improve radio’s attractiveness as a medium for advertisers. On average, we reduced advertising inventory and promotion
time by approximately 20% and 50%, respectively, across our stations which led to more time for our audiences to listen to our programming.
In addition, we changed our available advertising spots from 60 second ads to a combination of 60, 30, 15 and five second ads in order to give
advertisers more flexibility.
Continue to Enhance the Radio Listener Experience. We will continue to focus on enhancing the radio listener experience by offering a
wide variety of compelling content. We believe our investments in radio programming over time have created a collection of leading on-air
talent. Our Premiere Radio Network produces, distributes or represents approximately 70 syndicated radio programs and services for
approximately 5,000 radio stations across the United States. This distribution platform allows us to attract talent and more effectively utilize
programming, sharing the best and most compelling content across many stations. Finally, we are continually expanding content choices for
our listeners, including utilization of HD radio, Internet and other distribution channels with complementary formats. Ultimately, we believe
compelling content will improve our audience share which, in turn, will drive revenue growth and profit margins.
Deliver Content via New Distribution Technologies. We intend to drive company and industry development through new distribution
technologies. Some examples of such innovation are as follows:
6
7. Alternative Devices. The FM radio feature is expected to be integrated into MP3 players and cell phones. This should expand FM
•
listenership by “putting a radio in every pocket” with free music and local content and represents the first meaningful increase in the
radio installed base in the last 25 years.
HD Radio. HD radio enables crystal clear reception, interactive features, data services and new applications. Further, HD radio allows
•
for many more stations, providing greater variety of content which we believe will enable advertisers to target consumers more
effectively. The interactive capabilities of HD radio will potentially permit us to participate in commercial download services. On
December 6, 2005, we joined a consortium of radio operators in announcing plans to create the HD Digital Radio Alliance to lobby
auto makers, radio manufacturers and retailers for the rollout of digital radios. We plan to continue to develop compelling HD content
and applications and to support the alliance to foster industry conversion.
Internet. Our websites hosted approximately 11.4 million unique visitors in December 2007 as measured by CommScore / Media
•
Metrix, making us one of the top five trafficked music websites. Streaming audio via the Internet provides increased listener reach and
new listener applications as well as new advertising capabilities.
Mobile. We have pioneered mobile applications which allow subscribers to use their cell phones to interact directly with the station,
•
including finding titles/artists, requesting songs and downloading station wallpapers.
Americas and International Outdoor
We seek to capitalize on our global outdoor network and diversified product mix to maximize revenue. In addition, by sharing best
practices among our business segments, we believe we can quickly and effectively replicate our successes throughout the markets in which we
operate. Our diversified product mix and long-standing presence in many of our existing markets provide us with the platform to launch new
products and test new initiatives in a reliable and cost-effective manner.
Drive Outdoor Media Spending. Outdoor advertising only represented 3.4% of total dollars spent on advertising in the United States in
2006 as reported by Veronis Suhler Stevenson Communications Industry Forecast. Given the attractive industry fundamentals of outdoor media
and our depth and breadth of relationships with both local and national advertisers, we believe we can drive outdoor advertising’s share of total
media spending by highlighting the value of outdoor advertising relative to other media. We have made and continue to make investments in
research tools that enable our clients to better understand how our displays can successfully reach their target audiences and promote their
advertising campaigns. Also, we are working closely with clients, advertising agencies and other diversified media companies to develop more
sophisticated systems that will provide improved demographic measurements of outdoor advertising. We believe that these measurement
systems will further enhance the attractiveness of outdoor advertising for both existing clients and new advertisers and further foster outdoor
media spending growth.
Increase Our Share of Outdoor Media Spending. We intend to continue to work toward ensuring that our customers have a superior
experience by leveraging our presence in each of our markets and by increasing our focus on customer satisfaction and improved measurement
systems. We believe our commitment to superior customer service, highlighted by our unique “Proof of Performance” system, and our superior
products will lead to new advertisers and growth in existing advertising categories.
Digital Billboard Conversion Initiatives. Advances in electronic displays, including flat screens, LCDs and LEDs, allow us to provide
these technologies as alternatives to traditional methods of outdoor advertising. These electronic displays may be linked through centralized
computer systems to instantaneously and simultaneously change static advertisements on a large number of displays. These capabilities will
allow us to transition from selling space on a display to a single advertiser to selling time on that display to multiple advertisers. We believe
this transition will create new advertising opportunities for our existing clients and will attract new advertisers, such as certain retailers that
desire to change advertisements frequently and on short notice. We recently began converting a limited number of vinyl boards to networked
digital boards. We believe that the costs of digital upgrades will decrease over time as technologies improve and more digital boards come to
market.
Consolidated
Achieve Operating Efficiencies. We intend to closely manage expense growth and to continue to focus on achieving operating
efficiencies throughout our businesses. Within each of our operating segments, we share best practices across our markets and continually look
for innovative ways to contain costs. We will continue to seek new ways of reducing costs across our global network.
7
8. Pursue Strategic Opportunities and Optimize Our Portfolio of Assets. We continually evaluate strategic opportunities both within and
outside our existing lines of business and may, from time to time, purchase, sell, or swap assets or businesses in order to maximize the
efficiency of our portfolio.
Our Business Segments
Radio Broadcasting
Our Radio Broadcasting segment includes radio stations for which we are the licensee and for which we program and/or sell air time
under local marketing agreements (“LMAs”) or joint sales agreements (“JSAs”). The Radio Broadcasting segment also operates our Premiere
Radio Network, a national radio network, and various other local sports, news and agricultural radio networks. Our Radio Broadcasting
segment generated 50%, 52% and 53% of our consolidated revenue in 2007, 2006 and 2005, respectively.
Sources of Revenue
The primary source of revenue in our Radio Broadcasting segment is the sale of commercial spots on our radio stations for local, regional
and national advertising. Our local advertisers cover a wide range of categories, including automotive dealers, consumer services, retailers,
entertainment, health and beauty products, telecommunications and media. Our contracts with our advertisers generally provide for a term
which extends for less than a one year period. We also generate additional revenues from network compensation, the Internet, air traffic,
events, barter and other miscellaneous transactions. These other sources of revenue supplement our traditional advertising revenue without
increasing on-air-commercial time.
Each radio station’s local sales staff solicits advertising directly from local advertisers or indirectly through advertising agencies. Our
strategy of producing commercials that respond to the specific needs of our advertisers helps to build local direct advertising relationships.
Regional advertising sales are also generally realized by our local sales staff. To generate national advertising sales, we engage firms
specializing in soliciting radio advertising sales on a national level. National sales representatives obtain advertising principally from
advertising agencies located outside the station’s market and receive commissions based on advertising sold.
Advertising rates are principally based on the length of the spot and how many people in a targeted audience listen to our stations, as
measured by independent ratings services. A station’s format can be important in determining the size and characteristics of its listening
audience, and advertising rates are influenced by the station’s ability to attract and target audiences that advertisers aim to reach. The size of the
market influences rates as well, with larger markets typically receiving higher rates than smaller markets. Rates are generally highest during
morning and evening commuting periods.
We seek to maximize revenue by closely managing on-air inventory of advertising time and adjusting prices to local market conditions.
As part of Less is More, we implemented price and yield optimization systems and invested in new information systems, which provide
detailed inventory information previously unavailable to us. These systems enable our station managers and sales directors to adjust
commercial inventory and pricing based on local market demand, as well as to manage and monitor different commercial durations (60 second,
30 second, 15 second and five second) in order to provide more effective advertising for our customers at optimal prices.
Competition
We compete in our respective markets for audiences, advertising revenue and programming with other radio stations owned by
companies such as CBS, Cox Radio, Entercom and Radio One. We also compete with other advertising media, including satellite radio,
broadcast and cable television, print media, outdoor advertising, direct mail, the Internet and other forms of advertisement.
Radio Stations
As of December 31, 2007, we owned 304 AM and 701 FM domestic radio stations (717 core and 288 non-core), of which 151 stations
were in the top 25 U.S. markets according to the Arbitron rankings as of January 2, 2008. In addition, we currently own equity interests in
various international radio broadcasting companies located in Australia, New Zealand and Mexico, which we account for under the equity
method of accounting. The following table sets forth certain selected information with regard to our radio broadcasting stations:
8
9. Number
Market of
Market Rank* Stations
New York, NY 1 5
Los Angeles, CA 2 8
Chicago, IL 3 7
San Francisco, CA 4 7
Dallas-Ft. Worth, TX 5 6
Houston-Galveston, TX 6 8
Philadelphia, PA 7 6
Atlanta, GA 8 6
Washington, DC 9 8
Boston, MA 10 4
Detroit, MI 11 7
Miami-Ft. Lauderdale-Hollywood, FL 12 7
Seattle-Tacoma, WA 14 6
Phoenix, AZ 15 8
Minneapolis-St. Paul, MN 16 7
San Diego, CA 17 8
Nassau-Suffolk (Long Island), NY 18 2
Tampa-St. Petersburg-Clearwater, FL 19 8
St. Louis, MO 20 6
Baltimore, MD 21 3
Denver-Boulder, CO 22 8
Portland, OR 23 5
Pittsburgh, PA 24 6
Charlotte-Gastonia-Rock Hill, NC-SC 25 5
Riverside-San Bernardino, CA 26 6
Sacramento, CA 27 4
Cleveland, OH 28 6
Cincinnati, OH 29 8
San Antonio, TX 30 5
Salt Lake City-Ogden-Provo, UT 31 6
Las Vegas, NV 33 4
Orlando, FL 34 7
San Jose, CA 35 3
Milwaukee-Racine, WI 36 6
Columbus, OH 37 7
Providence-Warwick-Pawtucket, RI 39 4
Indianapolis, IN 40 3
Norfolk-Virginia Beach-Newport News, VA 41 4
Austin, TX 42 6
Raleigh-Durham, NC 43 4
Nashville, TN 44 5
Greensboro-Winston Salem-High Point, NC 45 5
West Palm Beach-Boca Raton, FL 46 6
Jacksonville, FL 47 7
Oklahoma City, OK 48 6
Memphis, TN 49 7
Hartford-New Britain-Middletown, CT 50 5
Louisville, KY 53 8
Rochester, NY 54 7
New Orleans, LA 55 7
Richmond, VA 56 6
Birmingham, AL 57 5
McAllen-Brownsville-Harlingen, TX 58 5
Greenville-Spartanburg, SC 59 6
Dayton, OH 60 8
Tucson, AZ 61 7
Ft. Myers-Naples-Marco Island, FL 62 6
Albany-Schenectady-Troy, NY 63 7
Honolulu, HI 64 6
Tulsa, OK 65 6
Fresno, CA 66 8
Grand Rapids, MI 67 7
Allentown-Bethlehem, PA 68 4
Albuquerque, NM 69 7
Omaha-Council Bluffs, NE-IA 72 5
Sarasota-Bradenton, FL 73 6
Akron, OH 74 5
Wilmington, DE 75 2
El Paso, TX 76 5
Bakersfield, CA 77 6
Harrisburg-Lebanon-Carlisle, PA 78 6
Stockton, CA 79 6
Baton Rouge, LA 80 6
Monterey-Salinas-Santa Cruz, CA 81 5
Syracuse, NY 82 7
Little Rock, AR 84 5
Springfield, MA 86 5
Charleston, SC 87 6
Toledo, OH 88 5
Columbia, SC 90 6
Des Moines, IA 91 5
10. Spokane, WA 92 6
Mobile, AL 93 4
Colorado Springs, CO 95 3
Ft. Pierce-Stuart-Vero Beach, FL 96 6
Melbourne-Titusville-Cocoa, FL 97 4
Wichita, KS 98 4
Madison, WI 99 6
Various U.S. Cities 101-150 88
Various U.S. Cities 151-200 47
Various U.S. Cities 201-250 33
Various U.S. Cities 251+ 23
Various U.S. Cities unranked 17
Non-core (a) 288
Total (b) 1,005
* Per Arbitron Rankings as of January 2, 2008
9
11. (a) Includes 260 stations reported as discontinued operations as of December 31, 2007. Our merger is not contingent on the sales of these
stations, and the sales of these stations are not contingent on the closing of our merger.
(b) Excluded from the 1,005 radio stations owned or operated by us are 5 radio stations programmed pursuant to a local marketing agreement
or shared services agreement (FCC licenses not owned by us) and one Mexican radio station that we provide programming to and sell
airtime for under exclusive sales agency arrangements. Also excluded are radio stations in Australia, New Zealand and Mexico. We own
a 50%, 50% and 40% equity interest in companies that have radio broadcasting operations in these markets, respectively.
Radio Networks
In addition to radio stations, our Radio Broadcasting segment includes our Premiere Radio Network, a national radio network that
produces, distributes or represents more than 70 syndicated radio programs and services for more than 5,000 radio station affiliates. Our broad
distribution platform enables us to attract and retain top programming talent. Some of our more popular radio programs include Rush
Limbaugh, Steve Harvey, Ryan Seacrest and Jeff Foxworthy.
We also own various sports, news and agriculture networks serving Alabama, California, Colorado, Florida, Georgia, Iowa, Kentucky,
Missouri, Ohio, Oklahoma, Pennsylvania, Tennessee and Virginia.
We believe recruiting and retaining top talent is an important component of the success of our radio networks. Given our scale, market
position and distribution platform, we believe that we have a competitive advantage relative to other radio networks with regards to attracting
on-air talent.
International Radio Investments
We own equity interests in various international radio broadcasting companies located in Australia (50% ownership), Mexico (40%
ownership) and New Zealand (50% ownership), which we account for under the equity method of accounting.
Americas Outdoor Advertising
Our Americas Outdoor Advertising segment consists of our operations in the United States, Canada and Latin America, with
approximately 93% of our 2007 revenue in this segment derived from the United States. The Americas Outdoor Advertising segment includes
advertising display faces which we own or operate under lease management agreements. Americas Outdoor Advertising generated 21%, 20%
and 20% of our consolidated net revenue in 2007, 2006 and 2005, respectively.
Sources of Revenue
Americas Outdoor Advertising revenue is derived from the sale of advertising copy placed on our display inventory. Our display
inventory consists primarily of billboards, street furniture displays and transit displays. The margins on our billboard contracts tend to be higher
than those on contracts for other displays. The following table shows the approximate percentage of revenue derived from each category for our
Americas Outdoor Advertising inventory:
Year Ended December 31,
2007 2006 2005
Billboards
Bulletins (1) 52% 52% 54%
Posters 16% 18% 19%
Street furniture displays 4% 4% 4%
Transit displays 16% 14% 11%
Other displays (2) 12% 12% 12%
Total 100% 100% 100%
(1) Includes digital displays.
(2) Includes spectaculars, mall displays and wallscapes.
Our Americas Outdoor Advertising segment generates revenues from local, regional and national sales. Our advertising rates are based
on a number of different factors including location, competition, size of display, illumination,
10
12. market and gross ratings points. Gross ratings points is the total number of impressions delivered, expressed as a percentage of a market
population, of a display or group of displays. The number of impressions delivered by a display is measured by the number of people passing
the site during a defined period of time and, in some international markets, is weighted to account for such factors as illumination, proximity to
other displays and the speed and viewing angle of approaching traffic. For all of our billboards in the United States, we use independent, third-
party auditing companies to verify the number of impressions delivered by a display. “Reach’’ is the percent of a target audience exposed to an
advertising message at least once during a specified period of time, typically during a period of four weeks. “Frequency” is the average number
of exposures an individual has to an advertising message during a specified period of time. Out-of-home frequency is typically measured over a
four-week period.
While location, price and availability of displays are important competitive factors, we believe that providing quality customer service
and establishing strong client relationships are also critical components of sales. In addition, we have long-standing relationships with a
diversified group of local, regional and national advertising brands and agencies across the Americas.
Billboards
Our billboard inventory primarily includes bulletins and posters.
Bulletins. Bulletins vary in size, with the most common size being 14 feet high by 48 feet wide. Almost all of the advertising copy
displayed on bulletins is computer printed on vinyl and transported to the bulletin where it is secured to the display surface. Because of
their greater size and impact, we typically receive our highest rates for bulletins. Bulletins generally are located along major
expressways, primary commuting routes and main intersections that are highly visible and heavily trafficked. Our clients may contract
for individual bulletins or a network of bulletins, meaning the clients’ advertisements are rotated among bulletins to increase the reach
of the campaign. Our client contracts for bulletins generally have terms ranging from one month to one year.
Posters. Posters are available in two sizes, 30-sheet and 8-sheet displays. The 30-sheet posters are approximately 11 feet high by 23
feet wide, and the 8-sheet posters are approximately 5 feet high by 11 feet wide. Advertising copy for posters is printed using silk-
screen or lithographic processes to transfer the designs onto paper that is then transported and secured to the poster surfaces. Posters
generally are located in commercial areas on primary and secondary routes near point-of-purchase locations, facilitating advertising
campaigns with greater demographic targeting than those displayed on bulletins. Our poster rates typically are less than our bulletin
rates, and our client contracts for posters generally have terms ranging from four weeks to one year. Two types of posters are premiere
panels and squares. Premiere displays are innovative hybrids between bulletins and posters that we developed to provide our clients
with an alternative for their targeted marketing campaigns. The premiere displays utilize one or more poster panels, but with vinyl
advertising stretched over the panels similar to bulletins. Our intent is to combine the creative impact of bulletins with the additional
reach and frequency of posters.
Street Furniture Displays
Our street furniture displays, marketed under our global AdshelTM brand, are advertising surfaces on bus shelters, information kiosks,
public toilets, freestanding units and other public structures, and are primarily located in major metropolitan cities and along major commuting
routes. Generally, we own the street furniture structures and are responsible for their construction and maintenance. Contracts for the right to
place our street furniture displays in the public domain and sell advertising space on them are awarded by municipal and transit authorities in
competitive bidding processes governed by local law. Generally, these contracts have terms ranging from 10 to 20 years. As compensation for
the right to sell advertising space on our street furniture structures, we pay the municipality or transit authority a fee or revenue share that is
either a fixed amount or a percentage of the revenue derived from the street furniture displays. Typically, these revenue sharing arrangements
include payments by us of minimum guaranteed amounts. Client contracts for street furniture displays typically have terms ranging from four
weeks to one year, and, similar to billboards, may be for network packages.
Transit Displays
Our transit displays are advertising surfaces on various types of vehicles or within transit systems, including on the interior and exterior
sides of buses, trains, trams and taxis, and within the common areas of rail stations and airports. Similar to street furniture, contracts for the
right to place our displays on such vehicles or within such transit systems and to sell advertising space on them generally are awarded by public
transit authorities in competitive bidding processes or
11
13. are negotiated with private transit operators. These contracts typically have terms of up to five years. Our client contracts for transit displays
generally have terms ranging from four weeks to one year.
Other Inventory
The balance of our display inventory consists of spectaculars, mall displays and wallscapes. Spectaculars are customized display
structures that often incorporate video, multidimensional lettering and figures, mechanical devices and moving parts and other embellishments
to create special effects. The majority of our spectaculars are located in Dundas Square in Toronto, Times Square and Penn Plaza in New York
City, Fashion Show in Las Vegas, Sunset Strip in Los Angeles and across from the Target Center in Minneapolis. Client contracts for
spectaculars typically have terms of one year or longer. We also own displays located within the common areas of malls on which our clients
run advertising campaigns for periods ranging from four weeks to one year. Contracts with mall operators grant us the exclusive right to place
our displays within the common areas and sell advertising on those displays. Our contracts with mall operators generally have terms ranging
from five to ten years. Client contracts for mall displays typically have terms ranging from six to eight weeks. A wallscape is a display that
drapes over or is suspended from the sides of buildings or other structures. Generally, wallscapes are located in high-profile areas where other
types of outdoor advertising displays are limited or unavailable. Clients typically contract for individual wallscapes for extended terms.
Competition
The outdoor advertising industry in the Americas is fragmented, consisting of several larger companies involved in outdoor advertising,
such as CBS and Lamar Advertising Company, as well as numerous smaller and local companies operating a limited number of display faces in
a single or a few local markets. We also compete with other advertising media in our respective markets, including broadcast and cable
television, radio, print media, the Internet and direct mail.
Advertising Inventory and Markets
As of December 31, 2007, we owned or operated approximately 209,000 displays in our Americas Outdoor Advertising segment. The
following table sets forth certain selected information with regard to our Americas outdoor advertising inventory, with our markets listed in
order of their designated market area (“DMA®”) region ranking (DMA® is a registered trademark of Nielsen Media Research, Inc.):
DMA® Street
Billboards
Region Furniture Transit Other Total
Displays (1)
Rank Markets Bulletins Posters Displays Displays Displays
United States
1 New York, NY 16,936
• • • • •
2 Los Angeles, CA 11,583
• • • • •
3 Chicago, IL 15,293
• • • • •
4 Philadelphia, PA 6,618
• • • • •
5 Dallas-Ft. Worth, TX 9,981
• • • • •
6 San Francisco-Oakland-San 8,971
• • • • •
Jose, CA
7 Boston, MA (Manchester, NH) 7,219
• • • • •
8 Atlanta, GA 3,091
• • • •
9 Washington, DC (Hagerstown, 3,403
• • • • •
MD)
•(2)
10 Houston, TX 4,542
• • •
11 Detroit, MI 606
• • •
12 Phoenix, AZ 2,155
• • • •
13 Tampa-St. Petersburg 2,428
• • • • •
(Sarasota), FL
14 Seattle-Tacoma, WA 11,092
• • • •
15 Minneapolis-St. Paul, MN 2,552
• • • •
16 Miami-Ft. Lauderdale, FL 4,003
• • • • •
17 Cleveland-Akron (Canton), OH 3,484
• • • •
18 Denver, CO 861
• •
19 Orlando-Daytona Beach- 4,166
• • • •
Melbourne, FL
12
14. DMA® Street
Billboards
Region Furniture Transit Other Total
Displays (1)
Rank Markets Bulletins Posters Displays Displays Displays
20 Sacramento-Stockton-Modesto, 1,509
• • • • •
CA
21 St. Louis, MO 279
• •
•(2)
22 Pittsburgh, PA 674
• •
23 Portland, OR 1,417
• • • •
24 Baltimore, MD 2,533
• • • • •
25 Charlotte, NC 12
•
26 Indianapolis, IN 1,871
• • • •
27 San Diego, CA 871
• • • •
28 Raleigh-Durham (Fayetteville), 449
•
NC
•(2)
29 Hartford-New Haven, CT 374
•
30 Nashville, TN 652
• • •
•(2)
31 Kansas City, KS/MO 324
32 Columbus, OH 1,525
• • • •
33 Cincinnati, OH 12
• •
34 Milwaukee, WI 5,838
• • • • •
35 Salt Lake City, UT 66
• •
36 Greenville-Spartanburg, SC- 88
• •
Asheville, NC-Anderson, SC
•(2)
37 San Antonio, TX 3,799
• • •
38 West Palm Beach-Ft. Pierce, FL 782
• • • •
39 Grand Rapids-Kalamazoo-Battle 100
•
Creek, MI
41 Harrisburg-Lancaster-Lebanon- 171
• •
York, PA
42 Norfolk-Portsmouth-Newport 470
• • • •
News, VA
43 Las Vegas, NV 13,362
• • • • •
44 Albuquerque-Santa Fe, NM 1,420
• • •
45 Oklahoma City, OK 3
•
46 Greensboro-High Point-Winston 999
•
Salem, NC
47 Memphis, TN 2,305
• • • • •
48 Louisville, KY 134
• •
49 Jacksonville, FL 991
• • • •
50 Buffalo, NY 483
•
•(2)
51-100 Various U.S. Cities 12,925
• • •
•(2)
101-150 Various U.S. Cities 5,491
• • • •
151+ Various U.S. Cities 2,458
• • • •
Non-U.S. Markets
n/a Aruba 213
•
n/a Australia 810
•
n/a Barbados 61
•
n/a Bahamas 194
•
n/a Belize 155
•
n/a Brazil 7,089
• • •
n/a Canada 4,314
• • •
n/a Chile 1,166
• •
n/a Costa Rica 210
•
n/a Dominican Republic 285
•
n/a Grenada 155
•
n/a Guam 144
•
13
15. DMA ® Street
Billboards
Region Furniture Transit Other Total
Displays(1)
Rank Markets Bulletins Posters Displays Displays Displays
n/a Jamaica 213
•
n/a Mexico 5,016
• •
n/a Netherlands Antilles 1,019
•
n/a New Zealand 1,392
•
n/a Peru 2,860
• • • • •
n/a Saint Kitts and Nevis 144
•
n/a Saint Lucia 100
•
n/a Virgin Islands 260
•
209,171
Total Americas Displays
(1) Includes wallscapes, spectaculars, mall and digital displays. Our inventory includes other small displays not in the table since their
contribution to our revenue is not material.
(2) We have access to additional displays through arrangements with local advertising and other companies.
International Outdoor Advertising
Our International Outdoor Advertising segment consists of our advertising operations in Africa, Asia, Australia and Europe, with
approximately half of our 2007 revenue in this segment derived from France and the United Kingdom. Subsequent to December 31, 2007 we
entered into an agreement to sell our operations in Africa. The International Outdoor Advertising segment includes advertising display faces
which we own or operate under lease management agreements. Our International Outdoor Advertising segment generated 26%, 24% and 24%
of our consolidated net revenue in 2007, 2006 and 2005, respectively.
Sources of Revenue
International outdoor advertising revenue is derived from the sale of advertising copy placed on our display inventory. Our international
outdoor display inventory consists primarily of billboards, street furniture displays, transit displays and other out-of-home advertising displays,
such as neon displays. The following table shows the approximate percentage of revenue derived from each inventory category of our
International Outdoor Advertising segment:
Year Ended December 31,
2007 2006 2005
Billboards (1) 39% 41% 44%
Street furniture displays 37% 37% 34%
Transit displays (2) 8% 9% 9%
Other displays (3) 16% 13% 13%
Total 100% 100% 100%
(1) Includes revenue from spectaculars and neon displays.
(2) Includes small displays.
(3) Includes advertising revenue from mall displays, other small displays, and non-advertising revenue from sales of street furniture
equipment, cleaning and maintenance services and production revenue.
Our International Outdoor Advertising segment generates revenues worldwide from local, regional and national sales. Similar to the
Americas, advertising rates generally are based on the gross rating points of a display or group of displays. The number of impressions
delivered by a display, in some countries, is weighted to account for such factors as illumination, proximity to other displays and the speed and
viewing angle of approaching traffic.
While location, price and availability of displays are important competitive factors, we believe that providing quality customer service
and establishing strong client relationships are also critical components of sales. In addition, we have long-standing relationships with a
diversified group of advertising brands and agencies worldwide.
Billboards
The sizes of our international billboards are not standardized. The billboards vary in both format and size across our networks, with the
majority of our international billboards being similar in size to our posters used in our
14
16. Americas outdoor business (30-sheet and 8-sheet displays). Our international billboards are sold to clients as network packages with contract
terms typically ranging from one to two weeks. Long-term client contracts are also available and typically have terms of up to one year. We
lease the majority of our billboard sites from private landowners. Billboards include our spectacular and neon displays. DEFI, our international
neon subsidiary, is a global provider of neon signs with approximately 400 displays in 15 countries worldwide. Client contracts for
international neon displays typically have terms of approximately five years.
Street Furniture Displays
Our international street furniture displays are substantially similar to their Americas street furniture counterparts, and include bus
shelters, freestanding units, public toilets, various types of kiosks and benches. Internationally, contracts with municipal and transit authorities
for the right to place our street furniture in the public domain and sell advertising on such street furniture typically provide for terms ranging
from 10 to 15 years. The major difference between our international and Americas street furniture businesses is in the nature of the municipal
contracts. In our international outdoor business, these contracts typically require us to provide the municipality with a broader range of urban
amenities such as public wastebaskets and lampposts, as well as space for the municipality to display maps or other public information. In
exchange for providing such urban amenities and display space, we are authorized to sell advertising space on certain sections of the structures
we erect in the public domain. Our international street furniture is typically sold to clients as network packages, with contract terms ranging
from one to two weeks. Long-term client contracts are also available and typically have terms of up to one year.
Transit Displays
Our international transit display contracts are substantially similar to their Americas transit display counterparts, and typically require us
to make only a minimal initial investment and few ongoing maintenance expenditures. Contracts with public transit authorities or private transit
operators typically have terms ranging from three to seven years. Our client contracts for transit displays generally have terms ranging from one
week to one year, or longer.
Other International Inventory and Services
The balance of our revenue from our International Outdoor Advertising segment consists primarily of advertising revenue from mall
displays, other small displays and non-advertising revenue from sales of street furniture equipment, cleaning and maintenance services and
production revenue. Internationally, our contracts with mall operators generally have terms ranging from five to ten years and client contracts
for mall displays generally have terms ranging from one to two weeks, but are available for up to six-month periods. Our international
inventory includes other small displays that are counted as separate displays since they form a substantial part of our network and International
Outdoor Advertising revenue. Several of our international markets sell equipment or provide cleaning and maintenance services as part of a
billboard or street furniture contract with a municipality. Production revenue relates to the production of advertising posters, usually for small
customers.
Competition
The international outdoor advertising industry is fragmented, consisting of several larger companies involved in outdoor advertising,
such as CBS and JC Decaux, as well as numerous smaller and local companies operating a limited number of display faces in a single or a few
local markets. We also compete with other advertising media in our respective markets, including broadcast and cable television, radio, print
media, the Internet and direct mail.
Advertising Inventory and Markets
As of December 31, 2007, we owned or operated approximately 687,000 displays in our International Outdoor Advertising segment. The
following table sets forth certain selected information with regard to our International Outdoor Advertising inventory, which are listed in
descending order according to 2007 revenue contribution:
Street
Furniture Transit Other Total
Billboards(1) Displays (2) Displays (3)
International Markets Displays Displays
France 162,386
• • • •
United Kingdom 69,418
• • • •
Italy 57,533
• •
China 62,573
• • • •
Spain 34,474
• • • •
Australia/New Zealand 16,958
• •
Sweden 111,479
• • • •
15
17. Street
Furniture Transit Other Total
Billboards(1) Displays (2) Displays (3)
International Markets Displays Displays
Switzerland 17,663
• • •
Belgium 23,486
• • • •
Norway 18,357
• • •
Ireland 7,581
• •
Denmark 33,986
• • • •
Turkey 10,439
• • • •
India 695
• • •
Finland 23,031
• • • •
Poland 13,204
• • •
Holland 3,326
• •
Baltic States/Russia 16,135
• •
Greece 1,219
• •
Singapore 3,847
•
Japan 53
•
Germany 53
•
Hungary 30
•
Austria 13
•
United Arab Emirates 1
•
Czech Republic 7
•
Ukraine 2
•
Indonesia 1
•
Portugal 15
•
Slovenia 1
•
687,966
Total International Displays
(1) Includes spectaculars and neon displays.
(2) Includes small displays.
(3) Includes mall displays and other small displays counted as separate displays in the table since they form a substantial part of our network
and International revenue.
Equity Investments
In addition to the displays listed above, as of December 31, 2007, we had equity investments in various out-of-home advertising
companies that operate in the following markets:
Street
Equity Furniture Transit
Billboards(1)
Market Company Investment Displays Displays
Outdoor Advertising Companies
South Africa(2) Clear Channel Independent 50.0% • • •
Italy Alessi 34.3% • • •
Italy AD Moving SpA 17.5% • •
Hong Kong Buspak 50.0% • •
Spain Clear Channel CEMUSA 50.0% •
Thailand Master & More 32.5% • •
Belgium MTB 49.0% •
Belgium Streep 25.0% •
Denmark City Reklame 45.0% •
Other Media Companies
Norway CAPA 50.0%
(1) Includes spectaculars and neon displays.
16