Download to read offline

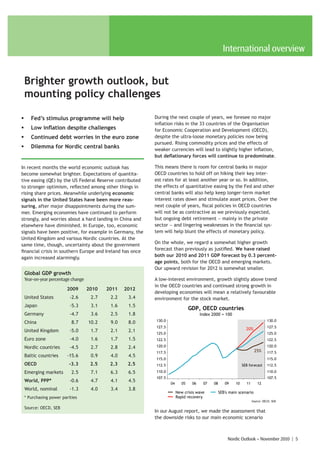
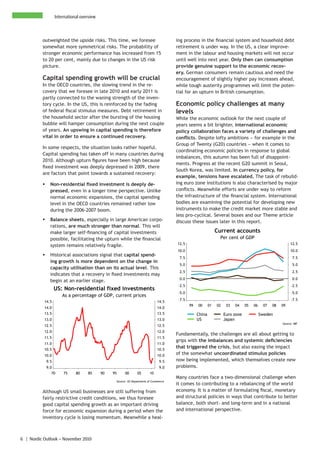
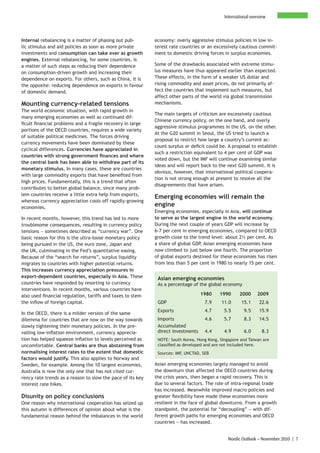
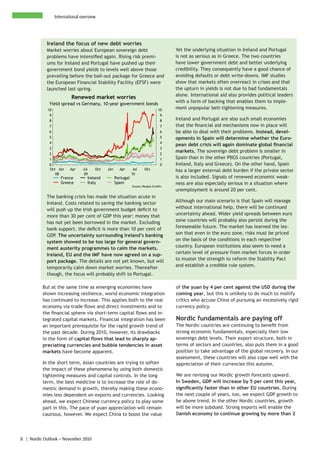
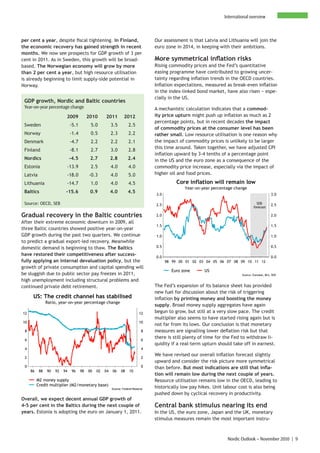
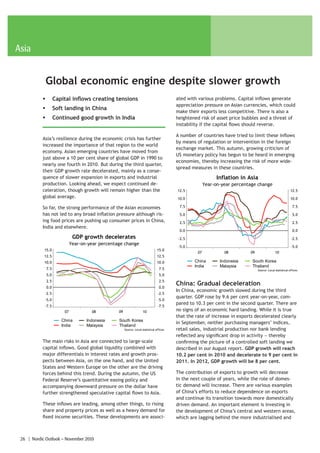
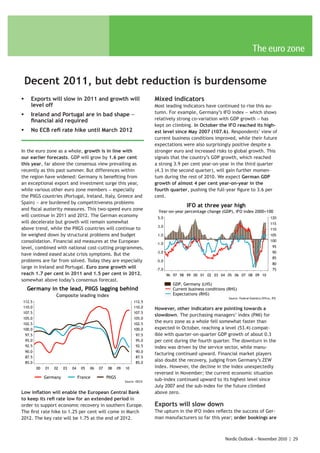

The Nordic economic outlook report from November 2010 presents a somewhat brighter growth forecast amid ongoing policy challenges, highlighting stronger growth in OECD countries and emerging markets. Key risks include rising inflation concerns, particularly due to commodity prices and currency-related tensions, while central banks are expected to maintain low interest rates in response. Additionally, the document underscores the complex interplay of fiscal and monetary policies needed to achieve economic stability and rebalancing amidst a fragile recovery in parts of Europe.


![17772207112012 155649.Single Doc[1]](https://cdn.slidesharecdn.com/ss_thumbnails/17772207112012155649singledoc1-13420369175478-phpapp02-120711150223-phpapp02-thumbnail.jpg?width=640&height=640&fit=bounds)


