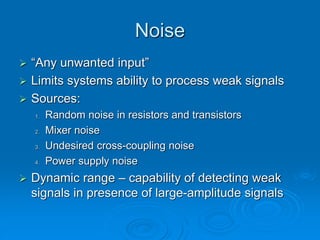
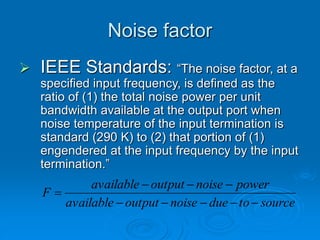
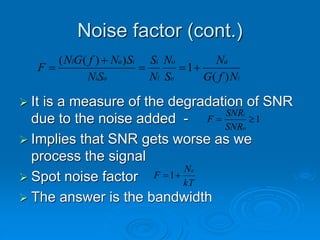
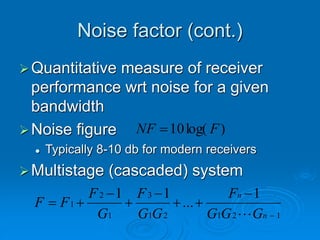
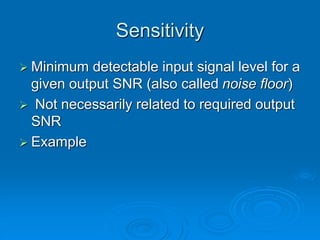
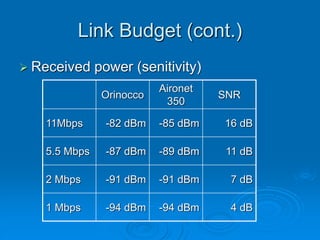
Noise Figure, Noise
Factor and Sensitivity
Wireless Systems Instructional
Design
Noise
 “Any unwanted input”
 Limits systems ability to process weak signals
 Sources:
1. Random noise in resistors and transistors
2. Mixer noise
3. Undesired cross-coupling noise
4. Power supply noise
 Dynamic range – capability of detecting weak
signals in presence of large-amplitude signals
Noise (contd.)
power
noise
average
power
signal
average
f
N
f
S
SNR






)
(
)
(
 “noisiness” of the signal measure = signal-to-
noise ratio (frequency dependant)
 Random noise
 External
• Atmospheric
• Interstellar
 Receiver internal
• Thermal
• Flicker noise (low frequency)
• Shot noise
“Sky” Noise
Noise factor
 IEEE Standards: “The noise factor, at a
specified input frequency, is defined as the
ratio of (1) the total noise power per unit
bandwidth available at the output port when
noise temperature of the input termination is
standard (290 K) to (2) that portion of (1)
engendered at the input frequency by the input
termination.”
source
to
due
noise
output
available
power
noise
output
available
F









Noise factor (cont.)
 It is a measure of the degradation of SNR
due to the noise added -
 Implies that SNR gets worse as we
process the signal
 Spot noise factor
 The answer is the bandwidth
i
a
o
o
i
i
o
i
i
a
i
N
f
G
N
S
N
N
S
S
N
S
N
f
G
N
F
)
(
1
)
)
(
(





1


o
i
SNR
SNR
F
kT
N
F
a

1
Noise factor (cont.)
Quantitative measure of receiver
performance wrt noise for a given
bandwidth
Noise figure
 Typically 8-10 db for modern receivers
Multistage (cascaded) system
)
log(
10 F
NF 
1
2
1
2
1
3
1
2
1
1
...
1
1









n
n
G
G
G
F
G
G
F
G
F
F
F

Sensitivity
 Minimum detectable input signal level for a
given output SNR (also called noise floor)
 Not necessarily related to required output
SNR
 Example
Link Budget
 “Quick and dirty” way of estimating RF link
performance
 Prx,Ptx – received and transmitted power (dB)
 Grx,Gtx – antenna gain (dBi)
 L – path loss
 Amisc – miscellaneous attenuation
misc
rx
tx
tx
rx A
-
L
-
G
G
P
P 


Link Budget (cont.)
 Path loss (Friis formula):
 L = 40 dB + 20log(d) @ 2.4 GHz
 L = 48 dB + 20log(d) @ 5.7 GHz
 Transmit power:
 15 – 20 dBm (30 – 100 mW)
 Antenna gain: given in decibels over an isotropic
antenna (dBi)
 0dBi (isotropic), 8 dBi (biquad), 15 dBi (helix), 24 dBi (parabolic)
20log(d)
20log(F)
92.45
L(dB) 


Link Budget (cont.)
 Received power (senitivity)
Orinocco
Aironet
350
SNR
11Mbps -82 dBm -85 dBm 16 dB
5.5 Mbps -87 dBm -89 dBm 11 dB
2 Mbps -91 dBm -91 dBm 7 dB
1 Mbps -94 dBm -94 dBm 4 dB
Link Budget (cont.)
 Amisc:
 Cables (@ 2.4 GHz)
• RG 174: 2 [dB/m]
• RG 58: 1 [dB/m]
• RG 213: 0.6 [dB/m]
• IEEE 802.3: 0.3 [dB/m]
• LMR-400: 0.22 [dB/m]
 Connectors (BNC, N, SMA)
• 0.1 – 1 dB loss
Project
 Link characterization with Network
Analyzer

NoiseFigure.ppt

  • 1.
    Noise Figure, Noise Factorand Sensitivity Wireless Systems Instructional Design
  • 2.
    Noise  “Any unwantedinput”  Limits systems ability to process weak signals  Sources: 1. Random noise in resistors and transistors 2. Mixer noise 3. Undesired cross-coupling noise 4. Power supply noise  Dynamic range – capability of detecting weak signals in presence of large-amplitude signals
  • 3.
    Noise (contd.) power noise average power signal average f N f S SNR       ) ( ) (  “noisiness”of the signal measure = signal-to- noise ratio (frequency dependant)  Random noise  External • Atmospheric • Interstellar  Receiver internal • Thermal • Flicker noise (low frequency) • Shot noise
  • 4.
  • 5.
    Noise factor  IEEEStandards: “The noise factor, at a specified input frequency, is defined as the ratio of (1) the total noise power per unit bandwidth available at the output port when noise temperature of the input termination is standard (290 K) to (2) that portion of (1) engendered at the input frequency by the input termination.” source to due noise output available power noise output available F         
  • 6.
    Noise factor (cont.) It is a measure of the degradation of SNR due to the noise added -  Implies that SNR gets worse as we process the signal  Spot noise factor  The answer is the bandwidth i a o o i i o i i a i N f G N S N N S S N S N f G N F ) ( 1 ) ) ( (      1   o i SNR SNR F kT N F a  1
  • 7.
    Noise factor (cont.) Quantitativemeasure of receiver performance wrt noise for a given bandwidth Noise figure  Typically 8-10 db for modern receivers Multistage (cascaded) system ) log( 10 F NF  1 2 1 2 1 3 1 2 1 1 ... 1 1          n n G G G F G G F G F F F 
  • 8.
    Sensitivity  Minimum detectableinput signal level for a given output SNR (also called noise floor)  Not necessarily related to required output SNR  Example
  • 9.
    Link Budget  “Quickand dirty” way of estimating RF link performance  Prx,Ptx – received and transmitted power (dB)  Grx,Gtx – antenna gain (dBi)  L – path loss  Amisc – miscellaneous attenuation misc rx tx tx rx A - L - G G P P   
  • 10.
    Link Budget (cont.) Path loss (Friis formula):  L = 40 dB + 20log(d) @ 2.4 GHz  L = 48 dB + 20log(d) @ 5.7 GHz  Transmit power:  15 – 20 dBm (30 – 100 mW)  Antenna gain: given in decibels over an isotropic antenna (dBi)  0dBi (isotropic), 8 dBi (biquad), 15 dBi (helix), 24 dBi (parabolic) 20log(d) 20log(F) 92.45 L(dB)   
  • 11.
    Link Budget (cont.) Received power (senitivity) Orinocco Aironet 350 SNR 11Mbps -82 dBm -85 dBm 16 dB 5.5 Mbps -87 dBm -89 dBm 11 dB 2 Mbps -91 dBm -91 dBm 7 dB 1 Mbps -94 dBm -94 dBm 4 dB
  • 12.
    Link Budget (cont.) Amisc:  Cables (@ 2.4 GHz) • RG 174: 2 [dB/m] • RG 58: 1 [dB/m] • RG 213: 0.6 [dB/m] • IEEE 802.3: 0.3 [dB/m] • LMR-400: 0.22 [dB/m]  Connectors (BNC, N, SMA) • 0.1 – 1 dB loss
  • 13.
    Project  Link characterizationwith Network Analyzer