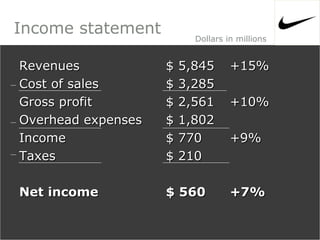
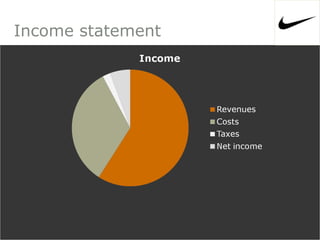
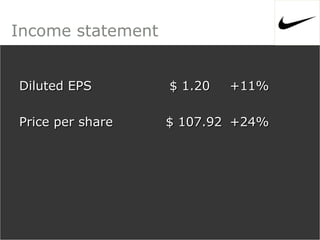
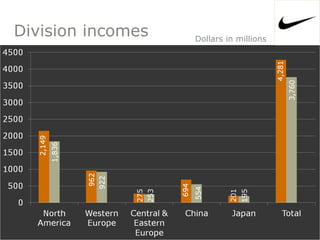
Nike's consolidated financial statements from 1/12/2011 to 29/2/2012 show that revenues increased 15% to $5.845 billion while net income grew 7% to $560 million. Earnings per share increased 11% to $1.20 per share and the stock price rose 24% to $107.92. The presentation analyzes Nike's income statement, division incomes, product groups, and notes pros like growth in China and innovation, and cons such as increased competition from Adidas.