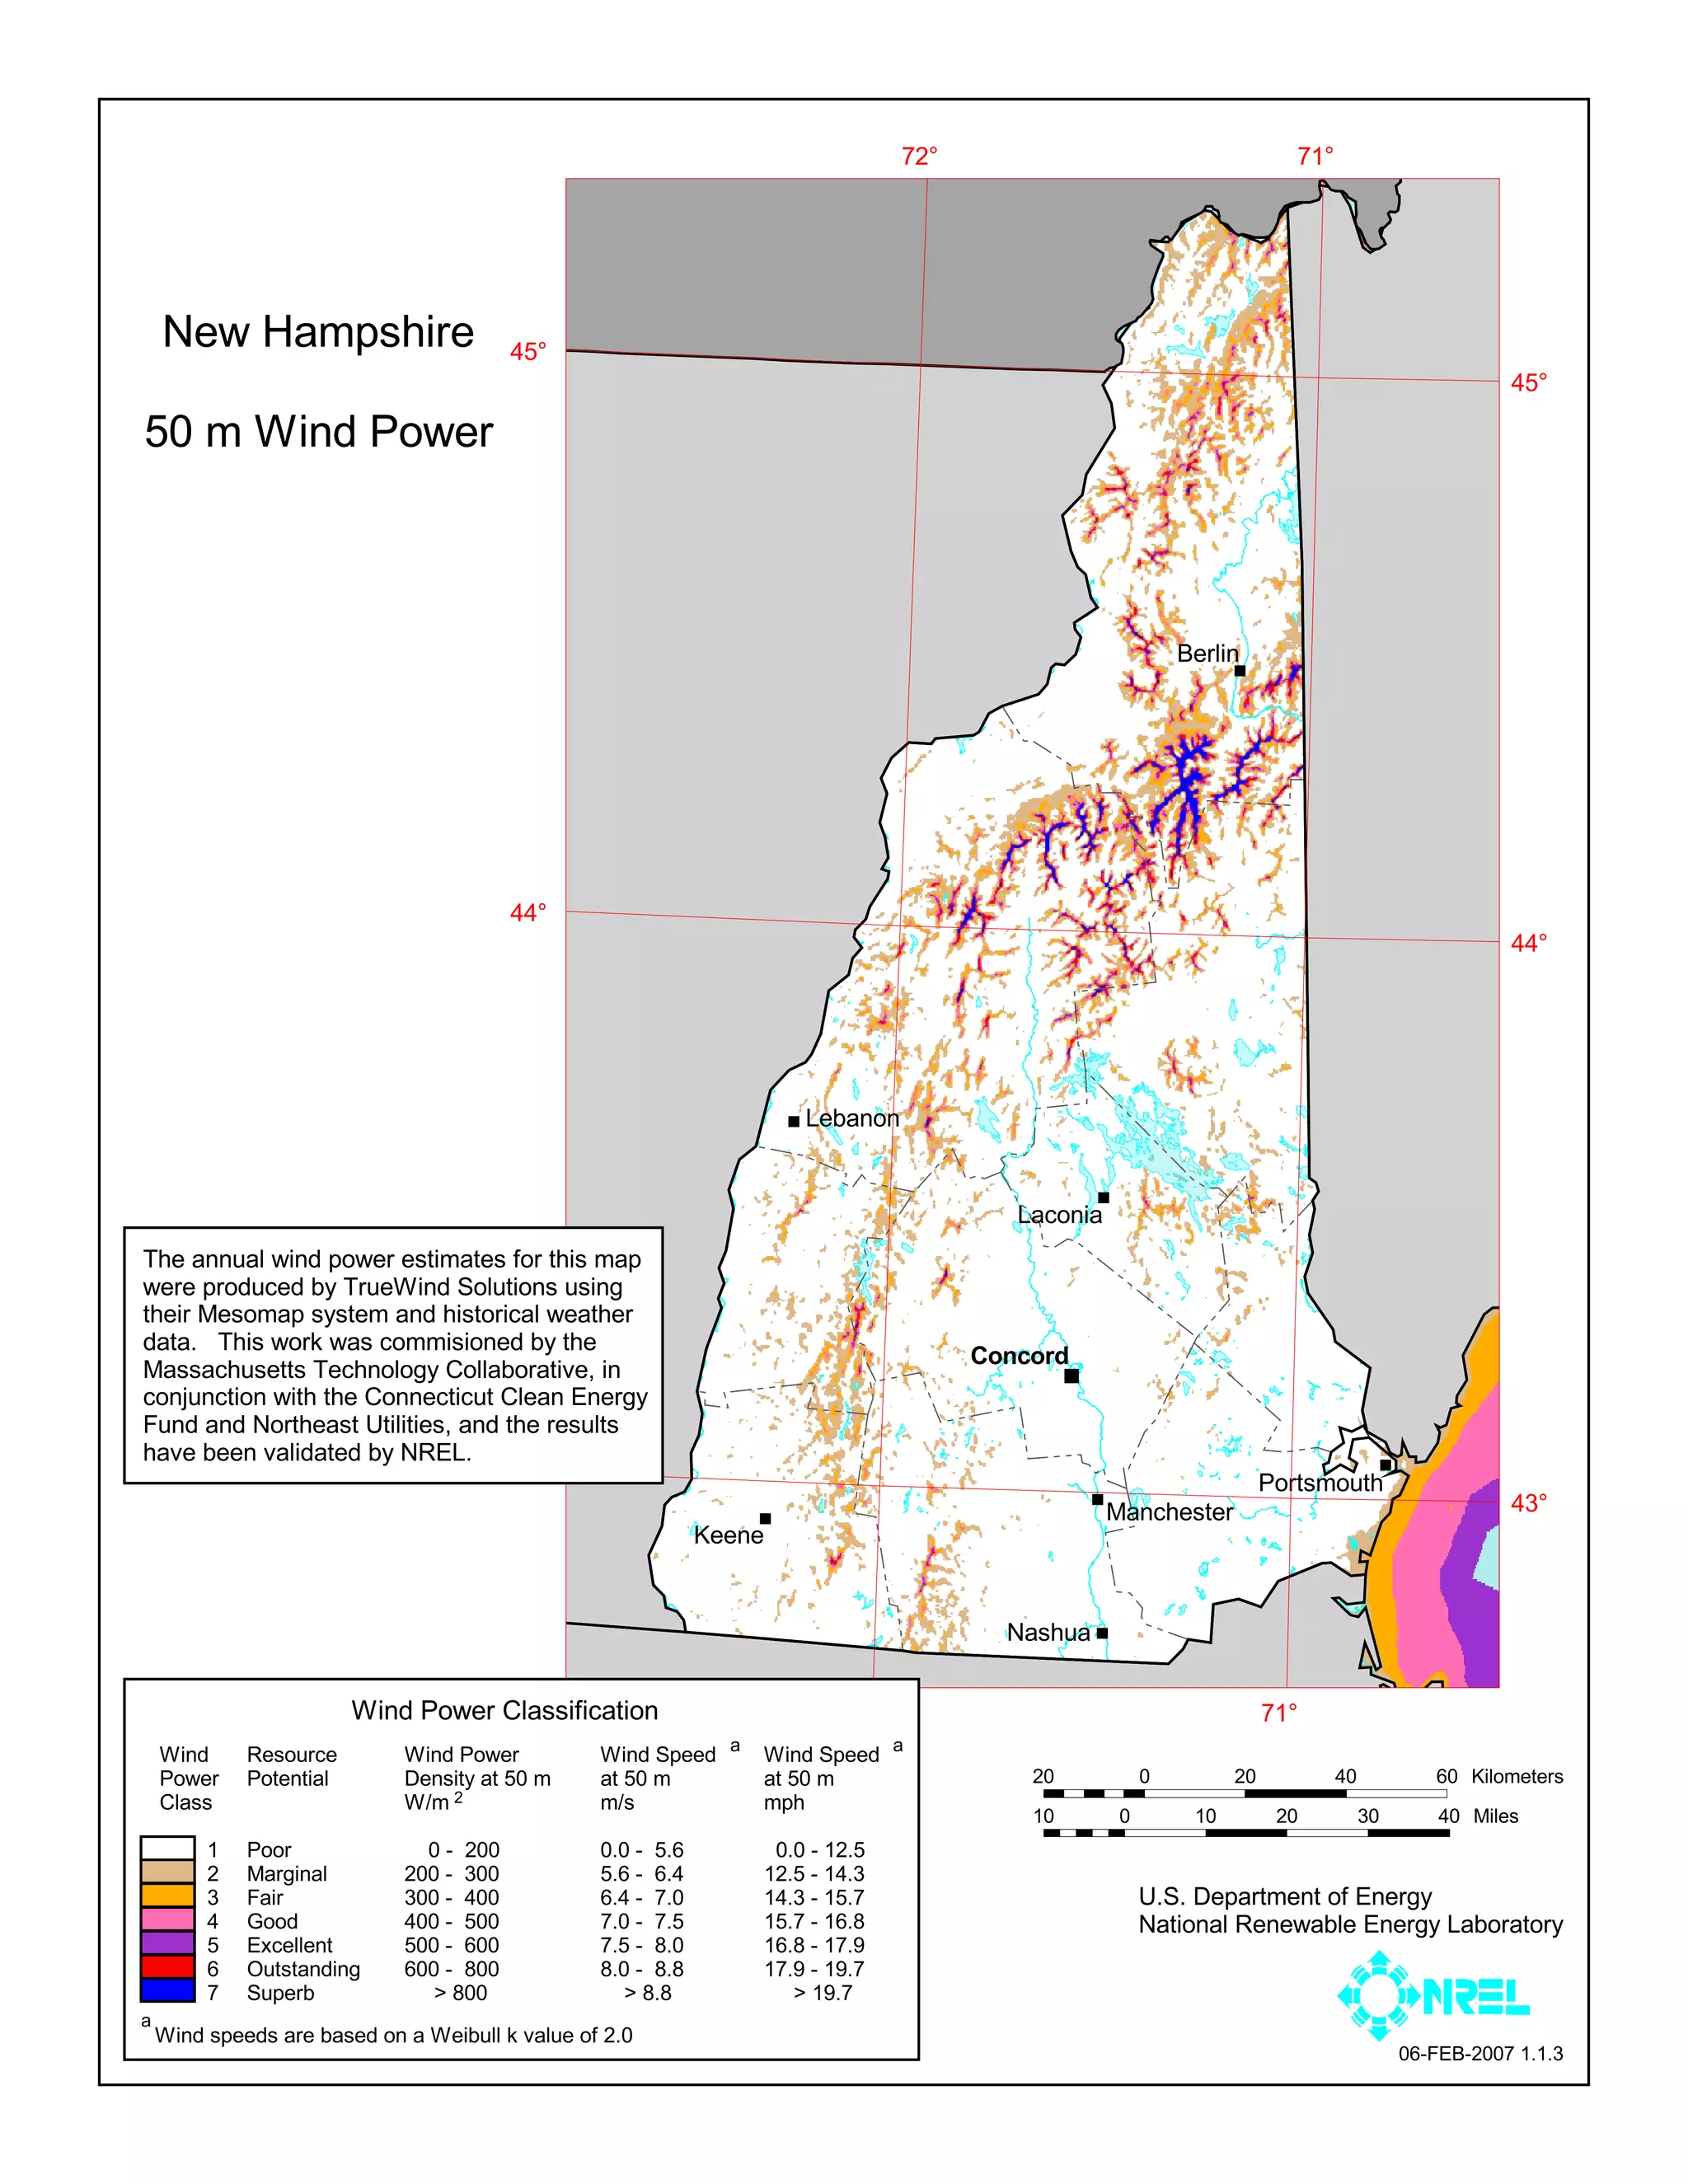
72°                                           71°


  New Hampshire                       45°
                                                                                                                                                              45°
50 m Wind Power


                                                                                                                 Berlin%


                                      44°
                                                                                                                                                              44°


                                                                   %   Lebanon

                                                                                                    %
                                                                                          Laconia
The annual wind power estimates for this map
were produced by TrueWind Solutions using
their Mesomap system and historical weather
data. This work was commisioned by the                                                 Concord
Massachusetts Technology Collaborative, in                                                      %
conjunction with the Connecticut Clean Energy
Fund and Northeast Utilities, and the results
have been validated by NREL.
                                   43°                                                                                      Portsmouth
                                                                                                                                               %

                                                               %
                                                                                                    %
                                                                                                        Manchester                                            43°
                                                           Keene

                                                                                         Nashua %

                     Wind Power Classification                            72°                                               71°
 Wind Resource             Wind Power          Wind Speed a Wind Speed a
 Power Potential           Density at 50 m     at 50 m      at 50 m                        20                0         20            40               60 Kilometers
 Class                     W/m 2               m/s          mph                            10            0        10         20           30          40 Miles
       1 Poor                0 - 200           0.0 - 5.6        0.0 - 12.5
       2 Marginal         200 - 300            5.6 - 6.4       12.5 - 14.3
       3 Fair             300 - 400            6.4 - 7.0       14.3 - 15.7                                   U.S. Department of Energy
       4 Good             400 - 500            7.0 - 7.5       15.7 - 16.8                                   National Renewable Energy Laboratory
       5 Excellent        500 - 600            7.5 - 8.0       16.8 - 17.9
       6 Outstanding 600 - 800                 8.0 - 8.8       17.9 - 19.7
       7 Superb               > 800               > 8.8           > 19.7
a
  Wind speeds are based on a Weibull k value of 2.0
                                                                                                                                                   06-FEB-2007 1.1.3

NH Wind Map

  • 1.
    72° 71° New Hampshire 45° 45° 50 m Wind Power Berlin% 44° 44° % Lebanon % Laconia The annual wind power estimates for this map were produced by TrueWind Solutions using their Mesomap system and historical weather data. This work was commisioned by the Concord Massachusetts Technology Collaborative, in % conjunction with the Connecticut Clean Energy Fund and Northeast Utilities, and the results have been validated by NREL. 43° Portsmouth % % % Manchester 43° Keene Nashua % Wind Power Classification 72° 71° Wind Resource Wind Power Wind Speed a Wind Speed a Power Potential Density at 50 m at 50 m at 50 m 20 0 20 40 60 Kilometers Class W/m 2 m/s mph 10 0 10 20 30 40 Miles 1 Poor 0 - 200 0.0 - 5.6 0.0 - 12.5 2 Marginal 200 - 300 5.6 - 6.4 12.5 - 14.3 3 Fair 300 - 400 6.4 - 7.0 14.3 - 15.7 U.S. Department of Energy 4 Good 400 - 500 7.0 - 7.5 15.7 - 16.8 National Renewable Energy Laboratory 5 Excellent 500 - 600 7.5 - 8.0 16.8 - 17.9 6 Outstanding 600 - 800 8.0 - 8.8 17.9 - 19.7 7 Superb > 800 > 8.8 > 19.7 a Wind speeds are based on a Weibull k value of 2.0 06-FEB-2007 1.1.3