Natural Gas Storage Levels Fall as Colder Weather Looms
1. Natural Gas Weekly Storage Forecast - 02/08/01 Gary Clark
609/897-1174
Storage Withdrawal as Expected; Brandon Balagna-Toal
Futures Up on Colder 6-10 Day Weather Outlook 303/291-5257
SNSNSNSNSNSNSNSNSNSNSNSNSNSNSNSNSNSNSNSNSNSNSNSNSNSNSNSNSNSNSNSNSNSNSNSNSNSNSNSNSNSNSNSNSNSNSNS
• Yesterday’s AGA report showed a 105 Bcf withdrawal for the week ended 2/3. This was only
slightly below our forecast of 110 Bcf and roughly in line with street expectations of a 103
Bcf withdrawal.
• Storage levels are now at 1,136 Bcf, which is 36% below the 5-year average of 1,552 Bcf and
37% below last year’s level of 1,562 Bcf.
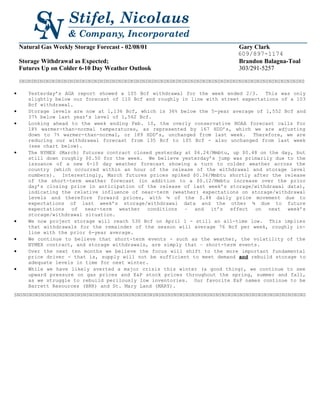
• Looking ahead to the week ending Feb. 10, the overly conservative NOAA forecast calls for
18% warmer-than-normal temperatures, as represented by 167 HDD’s, which we are adjusting
down to 7% warmer-than-normal, or 189 HDD’s, unchanged from last week. Therefore, we are
reducing our withdrawal forecast from 135 Bcf to 105 Bcf - also unchanged from last week
(see chart below).
• The NYMEX (March) futures contract closed yesterday at $6.24/Mmbtu, up $0.48 on the day, but
still down roughly $0.50 for the week. We believe yesterday’s jump was primarily due to the
issuance of a new 6-10 day weather forecast showing a turn to colder weather across the
country (which occurred within an hour of the release of the withdrawal and storage level
numbers). Interestingly, March futures prices spiked $0.36/Mmbtu shortly after the release
of the short-term weather forecast (in addition to a $0.12/Mmbtu increase over the prior
day’s closing price in anticipation of the release of last week’s storage/withdrawal data),
indicating the relative influence of near-term (weather) expectations on storage/withdrawal
levels and therefore forward prices, with ¼ of the $.48 daily price movement due to
expectations of last week’s storage/withdrawal data and the other ¾ due to future
expectations of near-term weather conditions – and it’s effect on next week’s
storage/withdrawal situation.
• We now project storage will reach 530 Bcf on April 1 - still an all-time low. This implies
that withdrawals for the remainder of the season will average 76 Bcf per week, roughly in-
line with the prior 6-year average.
• We continue to believe that short-term events - such as the weather, the volatility of the
NYMEX contract, and storage withdrawals, are simply that – short-term events.
• Over the next ten months we believe the focus will shift to the more important fundamental
price driver - that is, supply will not be sufficient to meet demand and rebuild storage to
adequate levels in time for next winter.
• While we have likely averted a major crisis this winter (a good thing), we continue to see
upward pressure on gas prices and E&P stock prices throughout the spring, summer and fall,
as we struggle to rebuild perilously low inventories. Our favorite E&P names continue to be
Barrett Resources (BRR) and St. Mary Land (MARY).
SNSNSNSNSNSNSNSNSNSNSNSNSNSNSNSNSNSNSNSNSNSNSNSNSNSNSNSNSNSNSNSNSNSNSNSNSNSNSNSNSNSNSNSNSNSNSNSNS
2. Storage Levels with HDD's
0
50
100
150
200
250
300
10/27/00
11/03/00
11/10/00
11/17/00
11/24/00
12/01/00
12/08/00
12/15/00
12/22/00
12/29/00
01/05/01
01/12/01
01/19/01
01/26/01
02/02/01
2/9/2001E
2/16/2001E
2/23/2001E
3/2/2001E
3/9/2001E
3/16/2001E
3/23/2001E
3/30/2001E
HDD's
0
500
1,000
1,500
2,000
2,500
3,000
StorageLevels
Normal HDD's Actual HDD's
Ending Storage Current Yr Actuals Current Yr Estimates
Storage Levels/Injections/Withdrawals and HDD Data
Ending Storage
Normal Actual Estimated Percentage Beginning Injections/ Current Yr Current Yr Prior Year Percentage
Date HDD's HDD's HDD's Difference Storage Withdrawals Actuals Estimates Actuals Change
10/27/00 83 47 -43.4% 2,642 70 2,712 2,995 -9.4%
11/03/00 99 83 -16.2% 2,712 36 2,748 3,007 -8.6%
11/10/00 112 122 8.9% 2,748 (6) 2,742 3,016 -9.1%
11/17/00 129 176 36.4% 2,742 (94) 2,648 2,996 -11.6%
11/24/00 145 195 34.5% 2,648 (146) 2,502 3,001 -16.6%
12/01/00 162 168 3.7% 2,502 (73) 2,429 2,932 -17.2%
12/08/00 180 213 18.3% 2,429 (158) 2,271 2,859 -20.6%
12/15/00 191 220 15.2% 2,271 (158) 2,113 2,743 -23.0%
12/22/00 202 261 29.2% 2,113 (175) 1,938 2,570 -24.6%
12/29/00 209 265 26.8% 1,938 (209) 1,729 2,437 -29.1%
01/05/01 214 238 11.2% 1,729 (167) 1,562 2,326 -32.8%
01/12/01 216 210 -2.8% 1,562 (103) 1,459 2,212 -34.0%
01/19/01 215 203 203 -5.6% 1,459 (90) 1,369 1,369 2,017 -32.1%
01/26/01 216 218 198 -8.3% 1,369 (128) 1,241 1,241 1,775 -30.1%
02/02/01 210 189 171 -18.6% 1,241 (105) 1,136 1,136 1,562 -27.3%
2/9/2001E 203 189 -6.9% 1,136 (105) 1,031 1,404 -26.6%
2/16/2001E 191 191 0.0% 1,031 (115) 916 1,268 -27.7%
2/23/2001E 179 179 0.0% 916 (110) 806 1,194 -32.5%
3/2/2001E 167 167 0.0% 806 (80) 726 1,157 -37.2%
3/9/2001E 150 150 0.0% 726 (72) 654 1,126 -41.9%
3/16/2001E 136 136 0.0% 654 (68) 586 1,064 -44.9%
3/23/2001E 122 122 0.0% 586 (45) 541 1,036 -47.8%
3/30/2001E 110 110 0.0% 541 (11) 530 1,031 -48.6%
Stifel, Nicolaus & Company, Inc. research also available online at http://www.multexnet.com
and http://www.firstcall.com
Stifel, Nicolaus & Company, Inc.
One Financial Plaza 1125 17th
Street
501 N. Broadway Suite 1600
St. Louis, Missouri 63102 Denver, Colorado 80202
314 342-2000 303 296-2300
Member SIPC and New York Stock Exchange, Inc.
Additional information is available upon request. The information and statistical data contained herein have been obtained from sources we
believe to be reliable but in no way are warranted by us as to accuracy or completeness. We do not undertake to advise you as to any changes
in figures or our views. This is not a solicitation of any order to buy or sell. We, our affiliates, and any officer, director, or
stockholder, or any member of their families may have a position in and may from time to time purchase or sell any of the herein mentioned
or related securities.