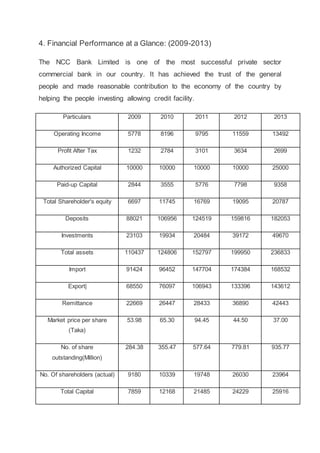
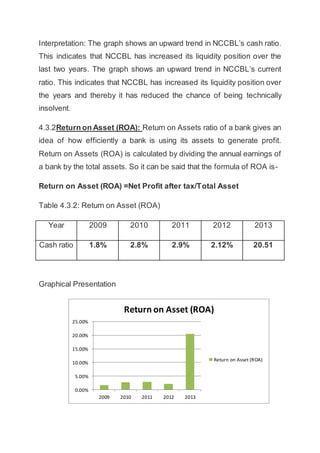
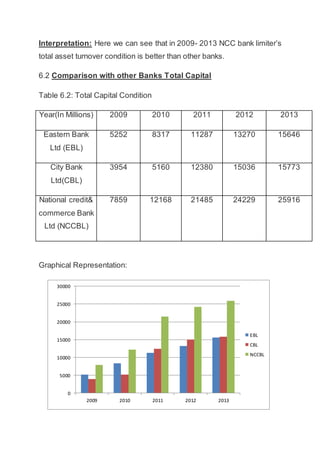
SlideShare a Scribd company logo
1 of 17
4. Financial Performance at a Glance: (2009-2013)
The NCC Bank Limited is one of the most successful private sector
commercial bank in our country. It has achieved the trust of the general
people and made reasonable contribution to the economy of the country by
helping the people investing allowing credit facility.
Particulars 2009 2010 2011 2012 2013
Operating Income 5778 8196 9795 11559 13492
Profit After Tax 1232 2784 3101 3634 2699
Authorized Capital 10000 10000 10000 10000 25000
Paid-up Capital 2844 3555 5776 7798 9358
Total Shareholder's equity 6697 11745 16769 19095 20787
Deposits 88021 106956 124519 159816 182053
Investments 23103 19934 20484 39172 49670
Total assets 110437 124806 152797 199950 236833
Import 91424 96452 147704 174384 168532
Export| 68550 76097 106943 133396 143612
Remittance 22669 26447 28433 36890 42443
Market price per share
(Taka)
53.98 65.30 94.45 44.50 37.00
No. of share
outstanding(Million)
284.38 355.47 577.64 779.81 935.77
No. Of shareholders (actual) 9180 10339 19748 26030 23964
Total Capital 7859 12168 21485 24229 25916
Interpretation:
By analyzing NCC bank performance from 2009 to 2013 it can be said
that NCC bank has improved in financial sector gradually. Here We can
see from NCC bank 5 years performance that in the year of 2009 the
operating income of NCC bank in million Tk5778 but in the year of 2013
it has increased to in million Tk13492. NCC bank has earned deposit
money during the year of 2013 in million Tk182053, which was in million
Tk 88021 in the year of 2009. And also NCC bank has increased their
export business profit from the year 2009 to 2013. NCC bank has
increased every year the amount of investment during these 5 years. We
can see that in the year of 2009 the investment of NCC bank was in
million Tk231013 then in 2013 it has increased in million Tk49670 .NCC
bank also developed their asset and capital position in 2009 NCCBL’s
total capital was in million Tk7859 after that in has increased year by
year in last 2013 it has improved their level in million Tk25916 And every
Besides these other sectors performance are also satisfactory like
export, total capital, authorized capital etc.
Ratio Analysis:
4.1Liquidity Ratio:
4.1.1 Cash ratio: Cash ratio is the ratio of cash and cash equivalents of
a company to its current liabilities. It measures the ability of a business
to repay its current liabilities by only using its cash and cash equivalents
and nothing else. Cash ratio is calculated using the following formula:
Cash Ratio=Cash+ Cash Equivalents/Current Liabilities
Table: 4.1.1: Cash Ratio
Year 2009 2010 2011 2012 2013
Cash ratio 8.18% 9.58% 7.69% 57.12% 59.10%
Graphical Presentation
Figure: 4.1.1
Interpretation: The graph shows an upward trend in NCCBL’s cash ratio.
This indicates that NCCBL has increased its liquidity position over the
last two years.
0.00%
10.00%
20.00%
30.00%
40.00%
50.00%
60.00%
70.00%
2009 2010 2011 2012 2013
cash ratio
cash ratio
4.1.2 Current ratio: The current ratio, one of the most commonly cited
financial ratios, measures the firm’s ability to meet its short term
obligations. The higher the current ratio, the better the liquidity position
of the firm. It is expressed as-
Current Ratio=Current Asset/Current Liabilities
Table: 4.1.2: Current Ratio
Year 2009 2010 2011 2012 2013
Current Ratio 2.88 1.16 2.19 2.35 2.36
Graphical Presentation
Figure: 4.1.2
0.00%
0.50%
1.00%
1.50%
2.00%
2.50%
3.00%
3.50%
2009 2010 2011 2012 2013
current ratio
current ratio
Interpretation: The graph shows an upward trend in NCCBL’s cash ratio.
This indicates that NCCBL has increased its liquidity position over the
last two years. The graph shows an upward trend in NCCBL’s current
ratio. This indicates that NCCBL has increased its liquidity position over
the years and thereby it has reduced the chance of being technically
insolvent.
4.3.2Return on Asset (ROA): Return on Assets ratio of a bank gives an
idea of how efficiently a bank is using its assets to generate profit.
Return on Assets (ROA) is calculated by dividing the annual earnings of
a bank by the total assets. So it can be said that the formula of ROA is-
Return on Asset (ROA) =Net Profit after tax/Total Asset
Table 4.3.2: Return on Asset (ROA)
Year 2009 2010 2011 2012 2013
Cash ratio 1.8% 2.8% 2.9% 2.12% 20.51
Graphical Presentation
0.00%
5.00%
10.00%
15.00%
20.00%
25.00%
2009 2010 2011 2012 2013
Return on Asset (ROA)
Figure 4.3.2
Interpretation: Return on assets is an indicator of how profitable a
company is. The banks return on asset increasing from 1.55% to 1.76%
in the preceding 5 years. But in 2008 it was dramatically fall which is
1.12% and after that in 2013 it is steadily deceased. This is bad sign for
the Bank.
4.3.3Return on Equity (ROE): The return on equity measures the return
earned on the owner’s investment. High the return on equity is the better
for the owner.
Return on Equity=Net Profit after Tax/ Shareholders equity
Table: 4.3.3: Return on Equity
Year 2009 2010 2011 2012 2013
Cash ratio 25.2% 34.1% 27.7% 25.6% 19.51%
Graphical Presentation:
Figure 4.3.3
Interpretation: Here the chart shows that 2009 to 2013 it so much
fluctuating this is not good.
4.3.4 Earnings per Share: The firm’s Earning per share (EPS) are
generally of interest to present or prospective stockholders and
management. The Earning per share represent the number of dollars
earned on behalf of each outstanding share of common stock. The
earnings per share is calculated as follows
Earnings per Share =Earnings available for common stock
holder/No of shares of common stock outstanding
0.00%
5.00%
10.00%
15.00%
20.00%
25.00%
30.00%
35.00%
40.00%
2009 2010 2011 2012 2013
Return on Equity
Return on Equity
Table 4.3.4: Earnings per Share
Earnings per share (BDT)Share value BDT10 |
Year 2009 2010 2011 2012 2013
Cash ratio 16.69% 11.63% 14.50% 12.08% 17.51%
Graphical Presentation:
Figure 4.3.4
Interpretation: The graph shows that, EPS is highest in 2013 and there
is a downward trend in EPS from year 2010 to 2012 which is negative
sign for Bank.
0.00%
2.00%
4.00%
6.00%
8.00%
10.00%
12.00%
14.00%
16.00%
18.00%
20.00%
2009 2010 2011 2012 2013
Earnings per Share
Earnings per Share
6. Comparison with other banks
6.1 Comparison with other Banks Total Asset:
Table 6.1: Total Asset Condition
Year(In Millions) 2009 2010 2011 2012 2013
Eastern Bank
Ltd (EBL)
147148 111760 82098 69871 54598
City Bank
Ltd(CBL)
57115 76467 90898 115736 130186
National credit&
commerce Bank
Ltd (NCCBL)
110437 124806 152797 199950 236833
Graphical Presentation:
Figure: 6.1
0
50000
100000
150000
200000
250000
2009 2010 2011 2012 2013
EBL
CBL
NCCBL
Interpretation: Here we can see that in 2009- 2013 NCC bank limiter’s
total asset turnover condition is better than other banks.
6.2 Comparison with other Banks Total Capital
Table 6.2: Total Capital Condition
Year(In Millions) 2009 2010 2011 2012 2013
Eastern Bank
Ltd (EBL)
5252 8317 11287 13270 15646
City Bank
Ltd(CBL)
3954 5160 12380 15036 15773
National credit&
commerce Bank
Ltd (NCCBL)
7859 12168 21485 24229 25916
Graphical Representation:
0
5000
10000
15000
20000
25000
30000
2009 2010 2011 2012 2013
EBL
CBL
NCCBL
Figure: 6.2
Interpretation: Here we can see that in 2009- 2013 NCC Bank limited’s
total capital turnover condition is better than other banks.
6.3 Comparison with other Banks Ratios
6.3.1 Current Ratio:
Table: 6.3.1: Current Ratio:
Year Eastern Bank
Ltd (EBL)
City Bank
Ltd(CBL)
National credit&
commerce Bank Ltd
(NCCBL)
2009 0.71 0.94 2.88
2010 0.78 1.23 1.16
2011 1.28 1.32 2.19
2012 1.48 1.69 2.35
2013 1.90 2.33 2.36
Graphical Presentation:
Figure 6.3.1: Current Ratio
Interpretation: The current ratio measures a firm’s liquidity by
measuring the portion of its current asset relative to its current liabilities
and the higher the ratio, the higher the liquidity of the firm. In 2009,
NCCBL is in better liquidity position than CBL and EBL. The graph
shows that, NCCBL current ratio is better than EBL, and NCCBL in 2012
to 2013. Current ratio is better than EBL and CBL in 2012 to 2013.
0.00%
0.50%
1.00%
1.50%
2.00%
2.50%
3.00%
3.50%
2009 2010 2011 2012 2013
EBL
CBL
NCCBL
7.2.2. Return on Asset:
Table: 7.2.2: Return on Asset
Year Eastern Bank
Ltd (EBL)
City Bank
Ltd(CBL)
National credit&
commerce Bank Ltd
(NCCBL)
2009 1.68 0.80 1.8
2010 2.34 1.20 2.8
2011 3.19 2.20 2.9
2012 3.29 2.10 2.12
2013 2.89 2.20 20.51
Graphical Presentation:
Figure: 7.2.2
0.00%
5.00%
10.00%
15.00%
20.00%
25.00%
2009 2010 2011 2012 2013
EBL
CBL
NCCBL
Interpretation: Return on Asset measures the management ability to
generate net profit by its total available assets. The graph shows that
NCCBL management is not efficient to generate profit and their ROA is
decreasing year by year. In compare to CBL & EBL management is
more efficient but in compare to EBL they are efficient higher in using
assets to generate profit.
7.3 Return on Equity (ROE):
Table: 7.2.3: Return on Equity (ROE)
Year Eastern Bank
Ltd (EBL)
City Bank
Ltd(CBL)
National credit&
commerce Bank Ltd
(NCCBL)
2009 18.64 11.2 25.2
2010 22.1 16.2 34.1
2011 23.64 21.3 27.7
2012 23.08 22.2 25.6
2013 23.91 23.09 19.51
Graphical Presentation
Figure7.2.3.
Interpretation: Return on Equity measures the percentage of profit
against 1 taka equity. The ROE of EBL has the highest value and
increasing year by year. In compare to CBL & EBL is in good position
than the NCCBL. The ROE of all the banks is increasing over the years
than the NCCBL.
0.00%
5.00%
10.00%
15.00%
20.00%
25.00%
30.00%
35.00%
40.00%
2009 2010 2011 2012 2013
EBL
CBL
NCCBL
7.2.4 Earnings per Share:
Table: 7.2.4: Earning Per Share (EPS)
Year Eastern Bank
Ltd (EBL)
City Bank
Ltd(CBL)
National credit&
commerce Bank Ltd
(NCCBL)
2009 30.20 23.3 16.61
2010 50.00 52.1 11.63
2011 80.30 59.4 14.05
2012 79.09 60.01 12.08
2013 81.01 62.09 17.51
Graphical presentation
0.00%
10.00%
20.00%
30.00%
40.00%
50.00%
60.00%
70.00%
80.00%
90.00%
2009 2010 2011 2012 2013
EBL
CBL
NCCBL
Interpretation: Earnings per Share measure the profit against each
common stock share. From the graph it can be said that EBL has the
largest highest earnings per share. are the same position about 46.40
which is less good than CBL & EBL.

More Related Content

What's hot

Summer internship project report 1 2
Summer internship project report 1 2Summer internship project report 1 2
Summer internship project report 1 2NitinLasunte
 
Janata Bank presentation
Janata Bank presentationJanata Bank presentation
Janata Bank presentationAsifulla Azad
 
Comparative Performance Analysis between Islami Bank Bangladesh Limited & EXI...
Comparative Performance Analysis between Islami Bank Bangladesh Limited & EXI...Comparative Performance Analysis between Islami Bank Bangladesh Limited & EXI...
Comparative Performance Analysis between Islami Bank Bangladesh Limited & EXI...Jahid Khan Rahat
 
Internship Report on Financial Statements Analysis of FSIBL by Moez Ansary
Internship Report on Financial Statements Analysis of FSIBL by Moez AnsaryInternship Report on Financial Statements Analysis of FSIBL by Moez Ansary
Internship Report on Financial Statements Analysis of FSIBL by Moez AnsaryMoez Ansary
 
Internship in customer service department at nabil bank - copy
Internship in customer service department at nabil bank - copyInternship in customer service department at nabil bank - copy
Internship in customer service department at nabil bank - copyAspak Miya
 
Sajib final internship report
Sajib final internship reportSajib final internship report
Sajib final internship reportsajib ripon
 
Internship report on Sunrise Bank Limited
Internship report on Sunrise Bank LimitedInternship report on Sunrise Bank Limited
Internship report on Sunrise Bank LimitedRojej Shrestha
 
Banking system of ncc bank ltd an analysis of its investment portfolio
Banking system of ncc bank ltd an analysis of its investment portfolioBanking system of ncc bank ltd an analysis of its investment portfolio
Banking system of ncc bank ltd an analysis of its investment portfolioRabiul Alam Hamon
 
Internship Report: Mega Bank
Internship Report: Mega BankInternship Report: Mega Bank
Internship Report: Mega BankSuraj Ghimire
 
General banking activities and financial analysis of Agrani Bank Ltd
General banking activities and financial analysis of Agrani Bank LtdGeneral banking activities and financial analysis of Agrani Bank Ltd
General banking activities and financial analysis of Agrani Bank LtdShah Meraz Rizvi
 
Presentation about SIBL
Presentation about SIBLPresentation about SIBL
Presentation about SIBLmarufx066
 
Report on summer internship project of Himalayan Bank Limited.
Report on summer internship project of Himalayan Bank Limited.Report on summer internship project of Himalayan Bank Limited.
Report on summer internship project of Himalayan Bank Limited.priyanka sarraf
 
Internship Report on Financial Statements Analysis of FSIBL by Moez Ansary
Internship Report on Financial Statements Analysis of FSIBL by Moez AnsaryInternship Report on Financial Statements Analysis of FSIBL by Moez Ansary
Internship Report on Financial Statements Analysis of FSIBL by Moez AnsaryMoez Ansary
 
The study is to analyze the credit management-A Study on Prime Bank Ltd.
The study is to analyze the credit management-A Study on Prime Bank Ltd.The study is to analyze the credit management-A Study on Prime Bank Ltd.
The study is to analyze the credit management-A Study on Prime Bank Ltd.Ariful Saimon
 

What's hot (20)

Summer internship project report 1 2
Summer internship project report 1 2Summer internship project report 1 2
Summer internship project report 1 2
 
hdfc report
hdfc reporthdfc report
hdfc report
 
Janata Bank presentation
Janata Bank presentationJanata Bank presentation
Janata Bank presentation
 
Fsibl (riyadh)
Fsibl (riyadh)Fsibl (riyadh)
Fsibl (riyadh)
 
Comparative Performance Analysis between Islami Bank Bangladesh Limited & EXI...
Comparative Performance Analysis between Islami Bank Bangladesh Limited & EXI...Comparative Performance Analysis between Islami Bank Bangladesh Limited & EXI...
Comparative Performance Analysis between Islami Bank Bangladesh Limited & EXI...
 
Internship Report on Financial Statements Analysis of FSIBL by Moez Ansary
Internship Report on Financial Statements Analysis of FSIBL by Moez AnsaryInternship Report on Financial Statements Analysis of FSIBL by Moez Ansary
Internship Report on Financial Statements Analysis of FSIBL by Moez Ansary
 
Internship in customer service department at nabil bank - copy
Internship in customer service department at nabil bank - copyInternship in customer service department at nabil bank - copy
Internship in customer service department at nabil bank - copy
 
Sajib final internship report
Sajib final internship reportSajib final internship report
Sajib final internship report
 
Internship report on retail banking activities of city bank ltd by lectureshe...
Internship report on retail banking activities of city bank ltd by lectureshe...Internship report on retail banking activities of city bank ltd by lectureshe...
Internship report on retail banking activities of city bank ltd by lectureshe...
 
Internship report on Sunrise Bank Limited
Internship report on Sunrise Bank LimitedInternship report on Sunrise Bank Limited
Internship report on Sunrise Bank Limited
 
Internship report
Internship reportInternship report
Internship report
 
Nbp report
Nbp reportNbp report
Nbp report
 
Banking system of ncc bank ltd an analysis of its investment portfolio
Banking system of ncc bank ltd an analysis of its investment portfolioBanking system of ncc bank ltd an analysis of its investment portfolio
Banking system of ncc bank ltd an analysis of its investment portfolio
 
Internship Report: Mega Bank
Internship Report: Mega BankInternship Report: Mega Bank
Internship Report: Mega Bank
 
General banking activities and financial analysis of Agrani Bank Ltd
General banking activities and financial analysis of Agrani Bank LtdGeneral banking activities and financial analysis of Agrani Bank Ltd
General banking activities and financial analysis of Agrani Bank Ltd
 
Presentation about SIBL
Presentation about SIBLPresentation about SIBL
Presentation about SIBL
 
Report on summer internship project of Himalayan Bank Limited.
Report on summer internship project of Himalayan Bank Limited.Report on summer internship project of Himalayan Bank Limited.
Report on summer internship project of Himalayan Bank Limited.
 
Internship Report on Financial Statements Analysis of FSIBL by Moez Ansary
Internship Report on Financial Statements Analysis of FSIBL by Moez AnsaryInternship Report on Financial Statements Analysis of FSIBL by Moez Ansary
Internship Report on Financial Statements Analysis of FSIBL by Moez Ansary
 
Dbbl
DbblDbbl
Dbbl
 
The study is to analyze the credit management-A Study on Prime Bank Ltd.
The study is to analyze the credit management-A Study on Prime Bank Ltd.The study is to analyze the credit management-A Study on Prime Bank Ltd.
The study is to analyze the credit management-A Study on Prime Bank Ltd.
 

Viewers also liked

INTERN REPORT OF NCC BANK (1)
INTERN REPORT OF NCC BANK (1)INTERN REPORT OF NCC BANK (1)
INTERN REPORT OF NCC BANK (1)Ashik Mahi
 
3 # main report of nccbl
3 # main report of nccbl3 # main report of nccbl
3 # main report of nccblManoar Hossain
 
Internship Report
Internship ReportInternship Report
Internship Reportzahurul88
 
Internship report on Functions and Process of SME banking of Mercantile Bank ...
Internship report on Functions and Process of SME banking of Mercantile Bank ...Internship report on Functions and Process of SME banking of Mercantile Bank ...
Internship report on Functions and Process of SME banking of Mercantile Bank ...Tanvir Sazzad
 
Presentation on SME Banking of Mercantile Bank Limited
Presentation on SME Banking of Mercantile Bank LimitedPresentation on SME Banking of Mercantile Bank Limited
Presentation on SME Banking of Mercantile Bank LimitedTanvir Sazzad
 
Proposal internship final
Proposal internship finalProposal internship final
Proposal internship finalImam Hasan
 
United commercial bank ltd. internship report
United commercial bank ltd. internship reportUnited commercial bank ltd. internship report
United commercial bank ltd. internship reportArif Hasan
 
Loan Disbusrsement
Loan DisbusrsementLoan Disbusrsement
Loan Disbusrsementimashraf
 
accounts ppt on ratio analysis
accounts ppt on ratio analysisaccounts ppt on ratio analysis
accounts ppt on ratio analysisvaishali_bansal
 
Ratio Analysis Ppt
Ratio Analysis PptRatio Analysis Ppt
Ratio Analysis PptMobasher Ali
 

Viewers also liked (11)

INTERN REPORT OF NCC BANK (1)
INTERN REPORT OF NCC BANK (1)INTERN REPORT OF NCC BANK (1)
INTERN REPORT OF NCC BANK (1)
 
3 # main report of nccbl
3 # main report of nccbl3 # main report of nccbl
3 # main report of nccbl
 
Internship Report
Internship ReportInternship Report
Internship Report
 
SWOT.BY G-B
SWOT.BY G-BSWOT.BY G-B
SWOT.BY G-B
 
Internship report on Functions and Process of SME banking of Mercantile Bank ...
Internship report on Functions and Process of SME banking of Mercantile Bank ...Internship report on Functions and Process of SME banking of Mercantile Bank ...
Internship report on Functions and Process of SME banking of Mercantile Bank ...
 
Presentation on SME Banking of Mercantile Bank Limited
Presentation on SME Banking of Mercantile Bank LimitedPresentation on SME Banking of Mercantile Bank Limited
Presentation on SME Banking of Mercantile Bank Limited
 
Proposal internship final
Proposal internship finalProposal internship final
Proposal internship final
 
United commercial bank ltd. internship report
United commercial bank ltd. internship reportUnited commercial bank ltd. internship report
United commercial bank ltd. internship report
 
Loan Disbusrsement
Loan DisbusrsementLoan Disbusrsement
Loan Disbusrsement
 
accounts ppt on ratio analysis
accounts ppt on ratio analysisaccounts ppt on ratio analysis
accounts ppt on ratio analysis
 
Ratio Analysis Ppt
Ratio Analysis PptRatio Analysis Ppt
Ratio Analysis Ppt
 

Similar to Ncc bank

Performance Analysis of United Leasing Company Ltd.
Performance Analysis of United Leasing Company Ltd.Performance Analysis of United Leasing Company Ltd.
Performance Analysis of United Leasing Company Ltd.Al Mamun
 
ATLAS HONDA ratio analysis
ATLAS HONDA ratio analysisATLAS HONDA ratio analysis
ATLAS HONDA ratio analysisACCA Global
 
Financial analysis of yes bank by Saurabh Kumar +91 9990415104
Financial analysis of yes bank by Saurabh Kumar +91 9990415104Financial analysis of yes bank by Saurabh Kumar +91 9990415104
Financial analysis of yes bank by Saurabh Kumar +91 9990415104Saurabh Kumar
 
“Analysis of Financial Performance of Jamuna Bank Limited”.ppt
“Analysis of Financial Performance of Jamuna Bank Limited”.ppt“Analysis of Financial Performance of Jamuna Bank Limited”.ppt
“Analysis of Financial Performance of Jamuna Bank Limited”.pptfaqrul islam
 
Financial statemet anlysis of co operative bank
Financial statemet anlysis of co operative bankFinancial statemet anlysis of co operative bank
Financial statemet anlysis of co operative bankNeeraj Singh
 
Comparison of Ratio analysis of banks of NEPAL....
Comparison of Ratio analysis of banks of NEPAL....Comparison of Ratio analysis of banks of NEPAL....
Comparison of Ratio analysis of banks of NEPAL....R K Tiwari Sagar
 
Hcc ru2 qfy2011-291010
Hcc ru2 qfy2011-291010Hcc ru2 qfy2011-291010
Hcc ru2 qfy2011-291010Angel Broking
 
Union bank of india ru2 qfy2011-271010
Union bank of india ru2 qfy2011-271010Union bank of india ru2 qfy2011-271010
Union bank of india ru2 qfy2011-271010Angel Broking
 
Kessan 1708682945115077
Kessan 1708682945115077Kessan 1708682945115077
Kessan 1708682945115077yoshikawa0521
 
Corporation bank ru2 qfy2011-221010
Corporation bank ru2 qfy2011-221010Corporation bank ru2 qfy2011-221010
Corporation bank ru2 qfy2011-221010Angel Broking
 
Evaluation of Financial Performance of SIBL
Evaluation of Financial Performance of SIBLEvaluation of Financial Performance of SIBL
Evaluation of Financial Performance of SIBLRakib Hossain
 
Performance evaluation of Dhaka Bank Ltd.
Performance evaluation of Dhaka Bank Ltd.Performance evaluation of Dhaka Bank Ltd.
Performance evaluation of Dhaka Bank Ltd.12inch
 
Project report on gdp and inflation
Project report on gdp and inflationProject report on gdp and inflation
Project report on gdp and inflationharryz18
 
Accounting 970643 paper 4 problem solving (supplementary topics) october nove...
Accounting 970643 paper 4 problem solving (supplementary topics) october nove...Accounting 970643 paper 4 problem solving (supplementary topics) october nove...
Accounting 970643 paper 4 problem solving (supplementary topics) october nove...alproelearning
 
iphone vs samsung
iphone vs samsungiphone vs samsung
iphone vs samsungzhang luwen
 
Icici bank ru2 qfy2011-291010
Icici bank ru2 qfy2011-291010Icici bank ru2 qfy2011-291010
Icici bank ru2 qfy2011-291010Angel Broking
 
Capital budgeting examples
Capital budgeting examplesCapital budgeting examples
Capital budgeting examplesks Chan
 

Similar to Ncc bank (20)

Performance Analysis of United Leasing Company Ltd.
Performance Analysis of United Leasing Company Ltd.Performance Analysis of United Leasing Company Ltd.
Performance Analysis of United Leasing Company Ltd.
 
ATLAS HONDA ratio analysis
ATLAS HONDA ratio analysisATLAS HONDA ratio analysis
ATLAS HONDA ratio analysis
 
Financial analysis of national grid plc
Financial analysis of national grid plcFinancial analysis of national grid plc
Financial analysis of national grid plc
 
Financial analysis of yes bank by Saurabh Kumar +91 9990415104
Financial analysis of yes bank by Saurabh Kumar +91 9990415104Financial analysis of yes bank by Saurabh Kumar +91 9990415104
Financial analysis of yes bank by Saurabh Kumar +91 9990415104
 
“Analysis of Financial Performance of Jamuna Bank Limited”.ppt
“Analysis of Financial Performance of Jamuna Bank Limited”.ppt“Analysis of Financial Performance of Jamuna Bank Limited”.ppt
“Analysis of Financial Performance of Jamuna Bank Limited”.ppt
 
Financial statemet anlysis of co operative bank
Financial statemet anlysis of co operative bankFinancial statemet anlysis of co operative bank
Financial statemet anlysis of co operative bank
 
Comparison of Ratio analysis of banks of NEPAL....
Comparison of Ratio analysis of banks of NEPAL....Comparison of Ratio analysis of banks of NEPAL....
Comparison of Ratio analysis of banks of NEPAL....
 
Hcc ru2 qfy2011-291010
Hcc ru2 qfy2011-291010Hcc ru2 qfy2011-291010
Hcc ru2 qfy2011-291010
 
Union bank of india ru2 qfy2011-271010
Union bank of india ru2 qfy2011-271010Union bank of india ru2 qfy2011-271010
Union bank of india ru2 qfy2011-271010
 
Kessan 1708682945115077
Kessan 1708682945115077Kessan 1708682945115077
Kessan 1708682945115077
 
Corporation bank ru2 qfy2011-221010
Corporation bank ru2 qfy2011-221010Corporation bank ru2 qfy2011-221010
Corporation bank ru2 qfy2011-221010
 
Evaluation of Financial Performance of SIBL
Evaluation of Financial Performance of SIBLEvaluation of Financial Performance of SIBL
Evaluation of Financial Performance of SIBL
 
Performance evaluation of Dhaka Bank Ltd.
Performance evaluation of Dhaka Bank Ltd.Performance evaluation of Dhaka Bank Ltd.
Performance evaluation of Dhaka Bank Ltd.
 
ALLAHABAD BANK
ALLAHABAD BANKALLAHABAD BANK
ALLAHABAD BANK
 
Project report on gdp and inflation
Project report on gdp and inflationProject report on gdp and inflation
Project report on gdp and inflation
 
Accounting 970643 paper 4 problem solving (supplementary topics) october nove...
Accounting 970643 paper 4 problem solving (supplementary topics) october nove...Accounting 970643 paper 4 problem solving (supplementary topics) october nove...
Accounting 970643 paper 4 problem solving (supplementary topics) october nove...
 
iphone vs samsung
iphone vs samsungiphone vs samsung
iphone vs samsung
 
Icici bank ru2 qfy2011-291010
Icici bank ru2 qfy2011-291010Icici bank ru2 qfy2011-291010
Icici bank ru2 qfy2011-291010
 
Capital budgeting examples
Capital budgeting examplesCapital budgeting examples
Capital budgeting examples
 
Ec april 2011 internet
Ec april 2011 internetEc april 2011 internet
Ec april 2011 internet
 

Recently uploaded

The CMO Survey - Highlights and Insights Report - Spring 2024
The CMO Survey - Highlights and Insights Report - Spring 2024The CMO Survey - Highlights and Insights Report - Spring 2024
The CMO Survey - Highlights and Insights Report - Spring 2024christinemoorman
 
Tech Startup Growth Hacking 101 - Basics on Growth Marketing
Tech Startup Growth Hacking 101  - Basics on Growth MarketingTech Startup Growth Hacking 101  - Basics on Growth Marketing
Tech Startup Growth Hacking 101 - Basics on Growth MarketingShawn Pang
 
Regression analysis: Simple Linear Regression Multiple Linear Regression
Regression analysis:  Simple Linear Regression Multiple Linear RegressionRegression analysis:  Simple Linear Regression Multiple Linear Regression
Regression analysis: Simple Linear Regression Multiple Linear RegressionRavindra Nath Shukla
 
Insurers' journeys to build a mastery in the IoT usage
Insurers' journeys to build a mastery in the IoT usageInsurers' journeys to build a mastery in the IoT usage
Insurers' journeys to build a mastery in the IoT usageMatteo Carbone
 
It will be International Nurses' Day on 12 May
It will be International Nurses' Day on 12 MayIt will be International Nurses' Day on 12 May
It will be International Nurses' Day on 12 MayNZSG
 
0183760ssssssssssssssssssssssssssss00101011 (27).pdf
0183760ssssssssssssssssssssssssssss00101011 (27).pdf0183760ssssssssssssssssssssssssssss00101011 (27).pdf
0183760ssssssssssssssssssssssssssss00101011 (27).pdfRenandantas16
 
Vip Dewas Call Girls #9907093804 Contact Number Escorts Service Dewas
Vip Dewas Call Girls #9907093804 Contact Number Escorts Service DewasVip Dewas Call Girls #9907093804 Contact Number Escorts Service Dewas
Vip Dewas Call Girls #9907093804 Contact Number Escorts Service Dewasmakika9823
 
Pharma Works Profile of Karan Communications
Pharma Works Profile of Karan CommunicationsPharma Works Profile of Karan Communications
Pharma Works Profile of Karan Communicationskarancommunications
 
RE Capital's Visionary Leadership under Newman Leech
RE Capital's Visionary Leadership under Newman LeechRE Capital's Visionary Leadership under Newman Leech
RE Capital's Visionary Leadership under Newman LeechNewman George Leech
 
Call Girls In DLf Gurgaon ➥99902@11544 ( Best price)100% Genuine Escort In 24...
Call Girls In DLf Gurgaon ➥99902@11544 ( Best price)100% Genuine Escort In 24...Call Girls In DLf Gurgaon ➥99902@11544 ( Best price)100% Genuine Escort In 24...
Call Girls In DLf Gurgaon ➥99902@11544 ( Best price)100% Genuine Escort In 24...lizamodels9
 
Monte Carlo simulation : Simulation using MCSM
Monte Carlo simulation : Simulation using MCSMMonte Carlo simulation : Simulation using MCSM
Monte Carlo simulation : Simulation using MCSMRavindra Nath Shukla
 
7.pdf This presentation captures many uses and the significance of the number...
7.pdf This presentation captures many uses and the significance of the number...7.pdf This presentation captures many uses and the significance of the number...
7.pdf This presentation captures many uses and the significance of the number...Paul Menig
 
Ensure the security of your HCL environment by applying the Zero Trust princi...
Ensure the security of your HCL environment by applying the Zero Trust princi...Ensure the security of your HCL environment by applying the Zero Trust princi...
Ensure the security of your HCL environment by applying the Zero Trust princi...Roland Driesen
 
MONA 98765-12871 CALL GIRLS IN LUDHIANA LUDHIANA CALL GIRL
MONA 98765-12871 CALL GIRLS IN LUDHIANA LUDHIANA CALL GIRLMONA 98765-12871 CALL GIRLS IN LUDHIANA LUDHIANA CALL GIRL
MONA 98765-12871 CALL GIRLS IN LUDHIANA LUDHIANA CALL GIRLSeo
 
VIP Call Girls In Saharaganj ( Lucknow ) 🔝 8923113531 🔝 Cash Payment (COD) 👒
VIP Call Girls In Saharaganj ( Lucknow  ) 🔝 8923113531 🔝  Cash Payment (COD) 👒VIP Call Girls In Saharaganj ( Lucknow  ) 🔝 8923113531 🔝  Cash Payment (COD) 👒
VIP Call Girls In Saharaganj ( Lucknow ) 🔝 8923113531 🔝 Cash Payment (COD) 👒anilsa9823
 
Mondelez State of Snacking and Future Trends 2023
Mondelez State of Snacking and Future Trends 2023Mondelez State of Snacking and Future Trends 2023
Mondelez State of Snacking and Future Trends 2023Neil Kimberley
 
Catalogue ONG NUOC PPR DE NHAT .pdf
Catalogue ONG NUOC PPR DE NHAT      .pdfCatalogue ONG NUOC PPR DE NHAT      .pdf
Catalogue ONG NUOC PPR DE NHAT .pdfOrient Homes
 
VIP Call Girl Jamshedpur Aashi 8250192130 Independent Escort Service Jamshedpur
VIP Call Girl Jamshedpur Aashi 8250192130 Independent Escort Service JamshedpurVIP Call Girl Jamshedpur Aashi 8250192130 Independent Escort Service Jamshedpur
VIP Call Girl Jamshedpur Aashi 8250192130 Independent Escort Service JamshedpurSuhani Kapoor
 
M.C Lodges -- Guest House in Jhang.
M.C Lodges --  Guest House in Jhang.M.C Lodges --  Guest House in Jhang.
M.C Lodges -- Guest House in Jhang.Aaiza Hassan
 

Recently uploaded (20)

The CMO Survey - Highlights and Insights Report - Spring 2024
The CMO Survey - Highlights and Insights Report - Spring 2024The CMO Survey - Highlights and Insights Report - Spring 2024
The CMO Survey - Highlights and Insights Report - Spring 2024
 
Best Practices for Implementing an External Recruiting Partnership
Best Practices for Implementing an External Recruiting PartnershipBest Practices for Implementing an External Recruiting Partnership
Best Practices for Implementing an External Recruiting Partnership
 
Tech Startup Growth Hacking 101 - Basics on Growth Marketing
Tech Startup Growth Hacking 101  - Basics on Growth MarketingTech Startup Growth Hacking 101  - Basics on Growth Marketing
Tech Startup Growth Hacking 101 - Basics on Growth Marketing
 
Regression analysis: Simple Linear Regression Multiple Linear Regression
Regression analysis:  Simple Linear Regression Multiple Linear RegressionRegression analysis:  Simple Linear Regression Multiple Linear Regression
Regression analysis: Simple Linear Regression Multiple Linear Regression
 
Insurers' journeys to build a mastery in the IoT usage
Insurers' journeys to build a mastery in the IoT usageInsurers' journeys to build a mastery in the IoT usage
Insurers' journeys to build a mastery in the IoT usage
 
It will be International Nurses' Day on 12 May
It will be International Nurses' Day on 12 MayIt will be International Nurses' Day on 12 May
It will be International Nurses' Day on 12 May
 
0183760ssssssssssssssssssssssssssss00101011 (27).pdf
0183760ssssssssssssssssssssssssssss00101011 (27).pdf0183760ssssssssssssssssssssssssssss00101011 (27).pdf
0183760ssssssssssssssssssssssssssss00101011 (27).pdf
 
Vip Dewas Call Girls #9907093804 Contact Number Escorts Service Dewas
Vip Dewas Call Girls #9907093804 Contact Number Escorts Service DewasVip Dewas Call Girls #9907093804 Contact Number Escorts Service Dewas
Vip Dewas Call Girls #9907093804 Contact Number Escorts Service Dewas
 
Pharma Works Profile of Karan Communications
Pharma Works Profile of Karan CommunicationsPharma Works Profile of Karan Communications
Pharma Works Profile of Karan Communications
 
RE Capital's Visionary Leadership under Newman Leech
RE Capital's Visionary Leadership under Newman LeechRE Capital's Visionary Leadership under Newman Leech
RE Capital's Visionary Leadership under Newman Leech
 
Call Girls In DLf Gurgaon ➥99902@11544 ( Best price)100% Genuine Escort In 24...
Call Girls In DLf Gurgaon ➥99902@11544 ( Best price)100% Genuine Escort In 24...Call Girls In DLf Gurgaon ➥99902@11544 ( Best price)100% Genuine Escort In 24...
Call Girls In DLf Gurgaon ➥99902@11544 ( Best price)100% Genuine Escort In 24...
 
Monte Carlo simulation : Simulation using MCSM
Monte Carlo simulation : Simulation using MCSMMonte Carlo simulation : Simulation using MCSM
Monte Carlo simulation : Simulation using MCSM
 
7.pdf This presentation captures many uses and the significance of the number...
7.pdf This presentation captures many uses and the significance of the number...7.pdf This presentation captures many uses and the significance of the number...
7.pdf This presentation captures many uses and the significance of the number...
 
Ensure the security of your HCL environment by applying the Zero Trust princi...
Ensure the security of your HCL environment by applying the Zero Trust princi...Ensure the security of your HCL environment by applying the Zero Trust princi...
Ensure the security of your HCL environment by applying the Zero Trust princi...
 
MONA 98765-12871 CALL GIRLS IN LUDHIANA LUDHIANA CALL GIRL
MONA 98765-12871 CALL GIRLS IN LUDHIANA LUDHIANA CALL GIRLMONA 98765-12871 CALL GIRLS IN LUDHIANA LUDHIANA CALL GIRL
MONA 98765-12871 CALL GIRLS IN LUDHIANA LUDHIANA CALL GIRL
 
VIP Call Girls In Saharaganj ( Lucknow ) 🔝 8923113531 🔝 Cash Payment (COD) 👒
VIP Call Girls In Saharaganj ( Lucknow  ) 🔝 8923113531 🔝  Cash Payment (COD) 👒VIP Call Girls In Saharaganj ( Lucknow  ) 🔝 8923113531 🔝  Cash Payment (COD) 👒
VIP Call Girls In Saharaganj ( Lucknow ) 🔝 8923113531 🔝 Cash Payment (COD) 👒
 
Mondelez State of Snacking and Future Trends 2023
Mondelez State of Snacking and Future Trends 2023Mondelez State of Snacking and Future Trends 2023
Mondelez State of Snacking and Future Trends 2023
 
Catalogue ONG NUOC PPR DE NHAT .pdf
Catalogue ONG NUOC PPR DE NHAT      .pdfCatalogue ONG NUOC PPR DE NHAT      .pdf
Catalogue ONG NUOC PPR DE NHAT .pdf
 
VIP Call Girl Jamshedpur Aashi 8250192130 Independent Escort Service Jamshedpur
VIP Call Girl Jamshedpur Aashi 8250192130 Independent Escort Service JamshedpurVIP Call Girl Jamshedpur Aashi 8250192130 Independent Escort Service Jamshedpur
VIP Call Girl Jamshedpur Aashi 8250192130 Independent Escort Service Jamshedpur
 
M.C Lodges -- Guest House in Jhang.
M.C Lodges --  Guest House in Jhang.M.C Lodges --  Guest House in Jhang.
M.C Lodges -- Guest House in Jhang.
 

Ncc bank

  • 1. 4. Financial Performance at a Glance: (2009-2013) The NCC Bank Limited is one of the most successful private sector commercial bank in our country. It has achieved the trust of the general people and made reasonable contribution to the economy of the country by helping the people investing allowing credit facility. Particulars 2009 2010 2011 2012 2013 Operating Income 5778 8196 9795 11559 13492 Profit After Tax 1232 2784 3101 3634 2699 Authorized Capital 10000 10000 10000 10000 25000 Paid-up Capital 2844 3555 5776 7798 9358 Total Shareholder's equity 6697 11745 16769 19095 20787 Deposits 88021 106956 124519 159816 182053 Investments 23103 19934 20484 39172 49670 Total assets 110437 124806 152797 199950 236833 Import 91424 96452 147704 174384 168532 Export| 68550 76097 106943 133396 143612 Remittance 22669 26447 28433 36890 42443 Market price per share (Taka) 53.98 65.30 94.45 44.50 37.00 No. of share outstanding(Million) 284.38 355.47 577.64 779.81 935.77 No. Of shareholders (actual) 9180 10339 19748 26030 23964 Total Capital 7859 12168 21485 24229 25916
  • 2. Interpretation: By analyzing NCC bank performance from 2009 to 2013 it can be said that NCC bank has improved in financial sector gradually. Here We can see from NCC bank 5 years performance that in the year of 2009 the operating income of NCC bank in million Tk5778 but in the year of 2013 it has increased to in million Tk13492. NCC bank has earned deposit money during the year of 2013 in million Tk182053, which was in million Tk 88021 in the year of 2009. And also NCC bank has increased their export business profit from the year 2009 to 2013. NCC bank has increased every year the amount of investment during these 5 years. We can see that in the year of 2009 the investment of NCC bank was in million Tk231013 then in 2013 it has increased in million Tk49670 .NCC bank also developed their asset and capital position in 2009 NCCBL’s total capital was in million Tk7859 after that in has increased year by year in last 2013 it has improved their level in million Tk25916 And every Besides these other sectors performance are also satisfactory like export, total capital, authorized capital etc. Ratio Analysis: 4.1Liquidity Ratio: 4.1.1 Cash ratio: Cash ratio is the ratio of cash and cash equivalents of a company to its current liabilities. It measures the ability of a business to repay its current liabilities by only using its cash and cash equivalents and nothing else. Cash ratio is calculated using the following formula:
  • 3. Cash Ratio=Cash+ Cash Equivalents/Current Liabilities Table: 4.1.1: Cash Ratio Year 2009 2010 2011 2012 2013 Cash ratio 8.18% 9.58% 7.69% 57.12% 59.10% Graphical Presentation Figure: 4.1.1 Interpretation: The graph shows an upward trend in NCCBL’s cash ratio. This indicates that NCCBL has increased its liquidity position over the last two years. 0.00% 10.00% 20.00% 30.00% 40.00% 50.00% 60.00% 70.00% 2009 2010 2011 2012 2013 cash ratio cash ratio
  • 4. 4.1.2 Current ratio: The current ratio, one of the most commonly cited financial ratios, measures the firm’s ability to meet its short term obligations. The higher the current ratio, the better the liquidity position of the firm. It is expressed as- Current Ratio=Current Asset/Current Liabilities Table: 4.1.2: Current Ratio Year 2009 2010 2011 2012 2013 Current Ratio 2.88 1.16 2.19 2.35 2.36 Graphical Presentation Figure: 4.1.2 0.00% 0.50% 1.00% 1.50% 2.00% 2.50% 3.00% 3.50% 2009 2010 2011 2012 2013 current ratio current ratio
  • 5. Interpretation: The graph shows an upward trend in NCCBL’s cash ratio. This indicates that NCCBL has increased its liquidity position over the last two years. The graph shows an upward trend in NCCBL’s current ratio. This indicates that NCCBL has increased its liquidity position over the years and thereby it has reduced the chance of being technically insolvent. 4.3.2Return on Asset (ROA): Return on Assets ratio of a bank gives an idea of how efficiently a bank is using its assets to generate profit. Return on Assets (ROA) is calculated by dividing the annual earnings of a bank by the total assets. So it can be said that the formula of ROA is- Return on Asset (ROA) =Net Profit after tax/Total Asset Table 4.3.2: Return on Asset (ROA) Year 2009 2010 2011 2012 2013 Cash ratio 1.8% 2.8% 2.9% 2.12% 20.51 Graphical Presentation 0.00% 5.00% 10.00% 15.00% 20.00% 25.00% 2009 2010 2011 2012 2013 Return on Asset (ROA) Return on Asset (ROA)
  • 6. Figure 4.3.2 Interpretation: Return on assets is an indicator of how profitable a company is. The banks return on asset increasing from 1.55% to 1.76% in the preceding 5 years. But in 2008 it was dramatically fall which is 1.12% and after that in 2013 it is steadily deceased. This is bad sign for the Bank. 4.3.3Return on Equity (ROE): The return on equity measures the return earned on the owner’s investment. High the return on equity is the better for the owner. Return on Equity=Net Profit after Tax/ Shareholders equity Table: 4.3.3: Return on Equity Year 2009 2010 2011 2012 2013 Cash ratio 25.2% 34.1% 27.7% 25.6% 19.51% Graphical Presentation:
  • 7. Figure 4.3.3 Interpretation: Here the chart shows that 2009 to 2013 it so much fluctuating this is not good. 4.3.4 Earnings per Share: The firm’s Earning per share (EPS) are generally of interest to present or prospective stockholders and management. The Earning per share represent the number of dollars earned on behalf of each outstanding share of common stock. The earnings per share is calculated as follows Earnings per Share =Earnings available for common stock holder/No of shares of common stock outstanding 0.00% 5.00% 10.00% 15.00% 20.00% 25.00% 30.00% 35.00% 40.00% 2009 2010 2011 2012 2013 Return on Equity Return on Equity
  • 8. Table 4.3.4: Earnings per Share Earnings per share (BDT)Share value BDT10 | Year 2009 2010 2011 2012 2013 Cash ratio 16.69% 11.63% 14.50% 12.08% 17.51% Graphical Presentation: Figure 4.3.4 Interpretation: The graph shows that, EPS is highest in 2013 and there is a downward trend in EPS from year 2010 to 2012 which is negative sign for Bank. 0.00% 2.00% 4.00% 6.00% 8.00% 10.00% 12.00% 14.00% 16.00% 18.00% 20.00% 2009 2010 2011 2012 2013 Earnings per Share Earnings per Share
  • 9. 6. Comparison with other banks 6.1 Comparison with other Banks Total Asset: Table 6.1: Total Asset Condition Year(In Millions) 2009 2010 2011 2012 2013 Eastern Bank Ltd (EBL) 147148 111760 82098 69871 54598 City Bank Ltd(CBL) 57115 76467 90898 115736 130186 National credit& commerce Bank Ltd (NCCBL) 110437 124806 152797 199950 236833 Graphical Presentation: Figure: 6.1 0 50000 100000 150000 200000 250000 2009 2010 2011 2012 2013 EBL CBL NCCBL
  • 10. Interpretation: Here we can see that in 2009- 2013 NCC bank limiter’s total asset turnover condition is better than other banks. 6.2 Comparison with other Banks Total Capital Table 6.2: Total Capital Condition Year(In Millions) 2009 2010 2011 2012 2013 Eastern Bank Ltd (EBL) 5252 8317 11287 13270 15646 City Bank Ltd(CBL) 3954 5160 12380 15036 15773 National credit& commerce Bank Ltd (NCCBL) 7859 12168 21485 24229 25916 Graphical Representation: 0 5000 10000 15000 20000 25000 30000 2009 2010 2011 2012 2013 EBL CBL NCCBL
  • 11. Figure: 6.2 Interpretation: Here we can see that in 2009- 2013 NCC Bank limited’s total capital turnover condition is better than other banks. 6.3 Comparison with other Banks Ratios 6.3.1 Current Ratio: Table: 6.3.1: Current Ratio: Year Eastern Bank Ltd (EBL) City Bank Ltd(CBL) National credit& commerce Bank Ltd (NCCBL) 2009 0.71 0.94 2.88 2010 0.78 1.23 1.16 2011 1.28 1.32 2.19 2012 1.48 1.69 2.35 2013 1.90 2.33 2.36
  • 12. Graphical Presentation: Figure 6.3.1: Current Ratio Interpretation: The current ratio measures a firm’s liquidity by measuring the portion of its current asset relative to its current liabilities and the higher the ratio, the higher the liquidity of the firm. In 2009, NCCBL is in better liquidity position than CBL and EBL. The graph shows that, NCCBL current ratio is better than EBL, and NCCBL in 2012 to 2013. Current ratio is better than EBL and CBL in 2012 to 2013. 0.00% 0.50% 1.00% 1.50% 2.00% 2.50% 3.00% 3.50% 2009 2010 2011 2012 2013 EBL CBL NCCBL
  • 13. 7.2.2. Return on Asset: Table: 7.2.2: Return on Asset Year Eastern Bank Ltd (EBL) City Bank Ltd(CBL) National credit& commerce Bank Ltd (NCCBL) 2009 1.68 0.80 1.8 2010 2.34 1.20 2.8 2011 3.19 2.20 2.9 2012 3.29 2.10 2.12 2013 2.89 2.20 20.51 Graphical Presentation: Figure: 7.2.2 0.00% 5.00% 10.00% 15.00% 20.00% 25.00% 2009 2010 2011 2012 2013 EBL CBL NCCBL
  • 14. Interpretation: Return on Asset measures the management ability to generate net profit by its total available assets. The graph shows that NCCBL management is not efficient to generate profit and their ROA is decreasing year by year. In compare to CBL & EBL management is more efficient but in compare to EBL they are efficient higher in using assets to generate profit. 7.3 Return on Equity (ROE): Table: 7.2.3: Return on Equity (ROE) Year Eastern Bank Ltd (EBL) City Bank Ltd(CBL) National credit& commerce Bank Ltd (NCCBL) 2009 18.64 11.2 25.2 2010 22.1 16.2 34.1 2011 23.64 21.3 27.7 2012 23.08 22.2 25.6 2013 23.91 23.09 19.51
  • 15. Graphical Presentation Figure7.2.3. Interpretation: Return on Equity measures the percentage of profit against 1 taka equity. The ROE of EBL has the highest value and increasing year by year. In compare to CBL & EBL is in good position than the NCCBL. The ROE of all the banks is increasing over the years than the NCCBL. 0.00% 5.00% 10.00% 15.00% 20.00% 25.00% 30.00% 35.00% 40.00% 2009 2010 2011 2012 2013 EBL CBL NCCBL
  • 16. 7.2.4 Earnings per Share: Table: 7.2.4: Earning Per Share (EPS) Year Eastern Bank Ltd (EBL) City Bank Ltd(CBL) National credit& commerce Bank Ltd (NCCBL) 2009 30.20 23.3 16.61 2010 50.00 52.1 11.63 2011 80.30 59.4 14.05 2012 79.09 60.01 12.08 2013 81.01 62.09 17.51 Graphical presentation 0.00% 10.00% 20.00% 30.00% 40.00% 50.00% 60.00% 70.00% 80.00% 90.00% 2009 2010 2011 2012 2013 EBL CBL NCCBL
  • 17. Interpretation: Earnings per Share measure the profit against each common stock share. From the graph it can be said that EBL has the largest highest earnings per share. are the same position about 46.40 which is less good than CBL & EBL.