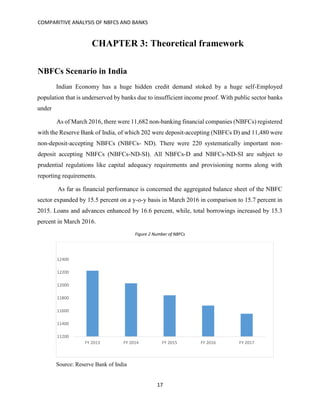
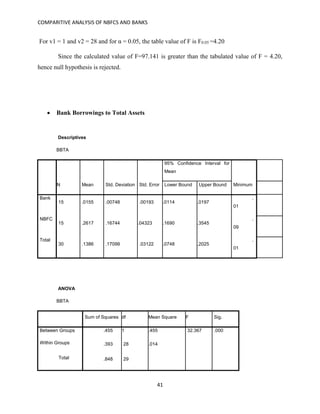
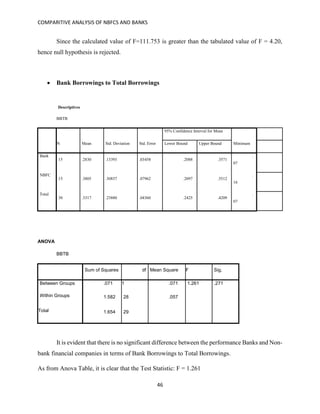
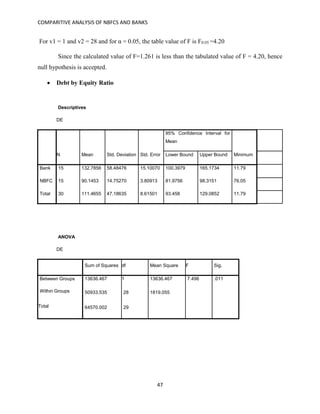
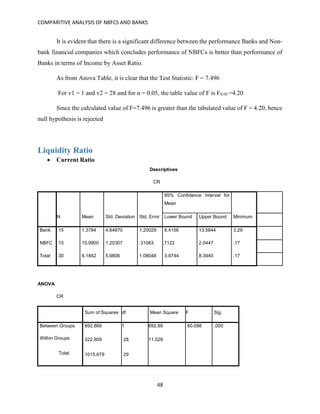
SlideShare a Scribd company logo
1 of 60
Download to read offline
COMPARITIVE ANALYSIS OF NBFCS AND BANKS
i
Acknowledgement
I express my sincere thanks to my faculty guide, Dr. Ranjan Kumar Dash, Associate
Professor, and my director Dr. Jyoti Chandiramani. for guiding me right from the inception till the
successful completion of the report. I sincerely acknowledge them for extending their valuable
guidance, support for literature, critical reviews of the report and above all the moral support that
they had provided to me at all the stages of this report.
COMPARITIVE ANALYSIS OF NBFCS AND BANKS
ii
Abstract
Non-banking financial companies (NBFCs) constitute an integral component of the Indian
Financial system. They play a significant role in nation building and financial inclusion by
complementing the banking sector in reaching extending credit to the unbanked segments of the
populace, particularly to the micro, small and medium enterprises (MSMEs), which champions the
idea of entrepreneurship and innovation. It is essential to note that NBFCs in India have witnessed
a substantial metamorphosis over the past some years and has come to be recognized as one of the
systematically crucial element of the financial system.
The Banking sector is also functioning in parallel to the NBFCs in financial front providing
many other services which NBFCs are not able to offer. Banks has always been highly regulated,
however simplified sanction procedures, flexibility and timeliness in meeting the credit needs and
low cost operations resulted in the NBFCs getting an edge over banks in providing funding.
Since they both hold a key position in the financial system and as mentioned playing an
important role in the economic development by expanding their wings in the form of advancing
credit to almost all the sectors of the economy and various echelons of population. It is extremely
essential that these financial institutions should be sustainable as their financial collapse may
possibly trigger uncontrollable financial cataclysm.
The purpose of the study is to have financial comparative analysis of NBFCs and Banks as
the significant institutions of our financial Economy. Similarly, this study is also conducted to
comprehend the comparative growth potential of NBFCs and Banks in India. The main motive is
to compare the performances on key financial parameters that is profitability, leverage and
liquidity ratio
COMPARITIVE ANALYSIS OF NBFCS AND BANKS
iii
Table of Contents
Chapter 1: Introduction .............................................................................................................................1
1.1 Background:................................................................................................................................1
1.1.1 NBFCs: Banking in new areas?....................................................................................................2
1.1.2 Overview of Scheduled Commercial Banks......................................................................5
Significance of the Study ........................................................................................................................7
Objective of the Study..............................................................................................................................9
Data and Methodology ............................................................................................................................9
Hypothesis: ............................................................................................................................................10
Limitations of the study........................................................................................................................10
CHAPTER 2: Literature Review.............................................................................................................11
Theoretical framework...............................................................................................................................17
NBFCs Scenario in India..........................................................................................................................17
NBFCs' Strengths ....................................................................................................................................19
Performance of Scheduled commercial Banks...................................................................................21
Comparison Between Banks and NBFCs in India .............................................................................22
Purpose of the Study.............................................................................................................................25
Data ........................................................................................................................................................25
Methodology..........................................................................................................................................27
Hypothesis: ............................................................................................................................................27
Chapter 5: Analysis...................................................................................................................................31
Profitability Ratios................................................................................................................................31
Leverage Ratios:....................................................................................................................................40
Liquidity Ratio ......................................................................................................................................48
Chapter 6: Conclusion..............................................................................................................................50
References..................................................................................................................................................52
Appendix....................................................................................................................................................53
COMPARITIVE ANALYSIS OF NBFCS AND BANKS
iv
List of figures
Figure 1 Credit Growth of NBFCs as a % of Total Credit ..............................................................................3
Figure 2 Number of NBFCs..........................................................................................................................17
Figure 3 Credit and deposits Y-o-Y growth .................................................................................................22
COMPARITIVE ANALYSIS OF NBFCS AND BANKS
v
List of Abbreviations
Abbreviations Description
NBFC Non-Banking Financial Companies
AMC Asset Management Capital
AUM Asset Under Management
NPA Non-Performing Assets
GNPA Gross Non-Performing Assets
ALM Asset Liquidity Management
PAT Profit After Tax
SCB Scheduled Commercial Bank
CRAR Capital to Risk weighted Asset Ratio
PSB Public Sector Bank
OOI Other Operating Income
RBI Reserve Bank of India
COMPARITIVE ANALYSIS OF NBFCS AND BANKS
1
Chapter 1: Introduction
1.1 Background:
Banking in India in more contemporary terms was initiated in the late 18th century with
Bank of Hindustan, 1770 and The General Bank of India, 1786.
The oldest bank and the largest in operations and still operating still is the State Bank of
India, which originated in the Bank of Calcutta in June 1806, which eventually became the Bank
of Bengal. There were three presidency banks established under charters from the British East
India Company: Bank of Bengal, Bank of Bombay and Bank of Madras. The three banks merged
to form the Imperial Bank of India, which eventually, upon India's independence, became the State
Bank of India in 1955. The presidency banks continued acting as quasi-central banks for years to
come, as did their successors, until the Reserve Bank of India was established in 1935.
(Santeshkumar)Reserve Bank of India took the initiative to bring Non-Banking Financial
Companies in the economy which was included in Chapter 3B assigning limited authorities to
Banks for the regulation of deposit taking companies. In January 1997, the economy witnessed
drastic changes in 1934, in the Chapters 3-B, 3-C and 5 of the RBI Act with the vital motive to
have a regulatory structure which were introduced to supervise the protection of interests of
depositors while keeping in mind the effective functioning of NBFCs.
Post the amendment of Act in 1997, the period witnessed the substantial growth of Non-
Banking financial companies in the areas of operations, range of market products and instrument
offers, sophistication of technology and many more. Furthermore, the paramount significance of
NBFCs in broadening the financial sector of the country, generates vital interest of researchers
and academicians to examine deep into the onset, growth, and performance
Non-Banking Finance Institutions is a constituent of the institutional structure of
the organized financial system in India are principally the source of providing funds for a
particular activity. Providing or securing finance is an independent functionality of NBFCs
resulting in Financial Management Services & Institutions. The Financial System of any country
COMPARITIVE ANALYSIS OF NBFCS AND BANKS
2
consists of financial markets, intermediaries and financial instruments or products, which
facilitate transfer of funds and are not always independently but in synergy.
.
1.1.1 NBFCs: Banking in new areas?
Banking in India have seen a lot of major developments in the past few years and NBFC
have evidently made an impact on the current system and our persistently making shifts in
becoming financial supermarkets. They are coming forth with an array of services focused all
around the individual needs and have gradually extended their product portfolio to include asset
management companies (AMCs), housing finance firms.
In Spite of the growing competition from the established banks and other financial
institutions the NBFCs' are extending their lines of business with a more permanent and serious
stature. Lately the traditional boundaries between different categories of Financial intermediaries
and institutions have vanished and thus, the NBFCs had to go head on with the banks to compete
for marketspace.
A Non-Banking Financial Company (NBFC) is a company registered under the
Companies Act, 1956 engaged in the business of loans and advances, acquisition of
shares/stocks/bonds/debentures/securities issued by Government or local authority or other
marketable securities of a like nature, leasing, hire-purchase, insurance business, chit business but
does not include any institution whose principal business is that of agriculture activity, industrial
activity, purchase or sale of any goods (other than securities) or providing any services and
sale/purchase/construction of immovable property.
Non-Banking Financial Company (NBFC) in India made a humble beginning in the 1960
to serve the need of the saver and investor whose financial need were not adequately covered by
the then existing banking system in India. Non-bank financial companies (NBFCs) are financial
institutions that provide banking services without meeting the legal definition of a bank, and are
typically restricted from taking deposits from the public under some cases but operations of these
institutions are covered under countries banking regulations.
COMPARITIVE ANALYSIS OF NBFCS AND BANKS
3
The initial phase did not see much traction pouring in for the NBFCs, but however,
between 1980s and 1990s the NBFCs with their customer friendly policies and offerings started
gaining recognition and acceptance. Some of NBFCs are also engaged in underwriting through
subsidiary unit and by offering allied financial services including stock broking, investment
banking, assets management and portfolio management. NBFCs have emerged as a substantial
contributor to the economic growth by supplementing the effort of banks and other financial
institutions
The NBFCs began to invite fixed deposit from investor and work out leasing deal for big
industrial firms. In the initial years they operated on a limited scale and were unable to make
substantial impact on the financial system. However, with the passage of time, their contribution
to the economy rose in leaps and bounds.
Working capital loans were traditionally disbursed by banks and term lending by financial
institutions. Now the stereotypes of these institutions has been radically changed and both moved
into retail financing where NBFC had their forte for instance, in terms of financial assets, NBFCs
have registered a robust growth, i.e. a compound annual growth rate (CAGR) of 19% past few
years, comprising 13% of the total credit and estimated to touch approximately 18% by 2018-19
Figure 1 Credit Growth of NBFCs as a % of Total Credit
Source: Reserve Bank of India
13.01%
14%
14.90%
15.90%
17.09%
18.20%
13.00%
14.40%
15.70%
17.30%
19.00%
20.90%
0.00%
5.00%
10.00%
15.00%
20.00%
25.00%
2015 2016 2017 2018E 2019E 2020E
7% CAGR
10% CAGR
COMPARITIVE ANALYSIS OF NBFCS AND BANKS
4
NBFCs constitute a significant branch of the finance sector. They witnessed incredible
progress during the 1980s and 1990s due to rigorous endeavors of the NBFCs across the globe.
These developments also resulted into haziness of demarcating lines between banks and NBFCs
with some privileges being reserved for the commercial banks. NBFCs are known for their higher
risk absorption capacity than the banks. Despite being an institution of beguiling investors, they
have played a crucial role in the financial system. Several specialized services like factoring,
venture capital finance, and financing road transport were espoused by these institutions. The
success of NBFCs can be assigned to their superior product lines, lower cost, broader and effective
reach, sound risk management capabilities to check and control bad debts, and better
comprehension of their customer segments.
Not only they have displayed success in their conventional citadel, i.e. passenger and
commercial vehicle finance but they have also managed to build significant Assets under
Management (AUM) in the personal loan and housing finance sector which have been the major
source of earnings for retail banks. The rise in urban demand and an enhancement in credit
penetration has assisted and will continue to assist in driving the growth of consumer finance.
Driven by higher disposable incomes through enhanced effectiveness of governance schemes, the
consumer finance segment is going to witness more business activities. It is heartening to note that
NBFCs improved their performance on majority of yardsticks during 2015-16, as the banking
sector struggled under the weight of soaring non-performing assets (NPAs). According to the
Financial Stability Report released by the Reserve Bank of India, NBFCs loans expanded 16.6%
in 2015-16, twice as fast as the 8.8% credit growth across the banking industry on an aggregate
level. The aggregate balance sheet of NBFCs expanded 15.5% in fiscal 2016 compared with
15.7% in the previous year. The gross non-performing assets (GNPA) ratio or the NBFC sector
declined to 4.6% of total advances in March 2016 from 5.1% in September 2015, according to the
Financial Stability Report.
1. Classification of NBFC
Based on their Liability Structure, NBFCs have been divided into two categories. 1.
Category ‘A’ companies (NBFCs accepting public deposits or NBFCs-D), and 2. Category ‘B’
companies (NBFCs not raising public deposits or NBFCs-ND).
COMPARITIVE ANALYSIS OF NBFCS AND BANKS
5
NBFCs-D are subject to requirements of Capital adequacy, Liquid assets maintenance,
Exposure norms (including restrictions on exposure to investments in land, building and unquoted
shares), ALM discipline and reporting requirements; In contrast, until 2006 NBFCs-ND were
subject to minimal regulation. Since April 1, 2007, non-deposit taking NBFCs with assets of `1
billion and above are being classified as Systemically Important Non-Deposit taking NBFCs
(NBFCs-NDSI), and prudential regulations, such as capital adequacy requirements and exposure
norms along with reporting requirements, have been made applicable to them. The asset liability
management (ALM) reporting and disclosure norms have also been made applicable to them at
different points of time.
Depending upon their nature of activities, non- banking finance companies can be
classified into the following categories:
1. Development finance institutions
2. Leasing companies
3. Investment companies
4. House finance companies
5. Venture capital companies
1.1.2 Overview of Scheduled Commercial Banks
Commercial Banks are divided into two categories
1. Scheduled Commercial Banks (Public Sector)
2. Scheduled Commercial Banks (Private Banks)
The scheduled commercial banks are those banks which are included in the second
schedule of RBI Act 1934 and which carry out the normal business of banking such as accepting
deposits, giving out loans and other banking services. Scheduled commercial banks can be further
divided into four groups: Public Sector Banks: This includes SBI and associates, Nationalized
Banks and other public Sector Banks; Private Sector Banks, Foreign Banks and Regional Rural
Banks
COMPARITIVE ANALYSIS OF NBFCS AND BANKS
6
Presently, there are 27 Public Sector Banks in India including SBI and also its five
associates and 19 Nationalized Banks. Further, there are two Banks which have be categorized by
RBI as “Other Public Sector Banks”. IDBI and Bhartiya Mahila Bank come under this category.
SBI and Associates
State Bank of India with its around 17,000 branches and around 200 foreign offices, is
India’s largest banking and financial services company by assets. With over two lakh employees,
SBI is banker to millions of Indians. This got birth in British Era when Bank of Calcutta, bank of
Bombay and Bank of Madras merged into one entity and was called “Imperial Bank of India”.
Then it got nationalized and was called as State Bank of India which is known as the Oldest Bank
of the country. At present SBI has five associates which are State Bank of Bikaner and Jaipur,
State Bank of Mysore, State Bank of Hyderabad, State Bank of Patiala and State Bank of
Travancore.
Apart from these there are 19 Nationalized Banks and two other Public Sector Banks.
Scheduled Commercial Banks (Private Banks)
In private sector banks, most of the capital is in private hands. There are two types of
private sector banks in India that are Old Private Sector Banks and New Private Sector Banks.
There are thirteen old private sector banks which were not nationalized at the time other
banks were and are closely held by certain communities and their operations are mostly restricted
to areas in and place of origin. Their Board of Directors mainly consists of personalities who are
prominent and known in their local areas. Out of thirteen Old Private Sector Banks, Nainital Bank
which is subsidiary of Bank of Baroda has the highest stake of 98.57% in it. Some other Old Private
sector Banks have merged with other Banks.
The New Private sector banks were incorporated as per the revised guidelines issued by
the RBI regarding the entry of private sector banks in 1993.At present there are seven new private
sector banks.
Apart from these seven Banks, there are two banks which are yet to commence operation
and have already obtained ‘in-principle’ licenses from RBI that are IDFC and Bandhan Bank of
Bandhan Financial Services.
COMPARITIVE ANALYSIS OF NBFCS AND BANKS
7
Foreign Banks
These are the type of banks that are obligated to follow the rules of both home and foreign
countries. As foreign branch Banks’ Loan limits are Based on the parent banks capital, so they
provide more loans that the subsidiary Banks. There are 43 foreign banks from 26 countries which
are operating as branches in India and 46 banks from 22 countries operating as representative
offices in India. Most the foreign banks in India are the niche players which means their business
is usually focused on trade finance, external commercial borrowings, wholesale lending etc. RBI
policy towards the presence of foreign banks in India is based upon two cardinal principles that
are reciprocity which means overseas bank are given national treatment only if their home country
allows to open branches of Indian Banks there without much restrictions and single mode of
presence in which RBI allows either of the Branch mode or wholly owned subsidiary mode in
India.
Regional Rural Banks
Even after nationalization, there were commercial banks which were not able to lend to
farmers due to cultural issues even under supervision of government regulation. Therefore, these
type of banks were initiated in 1970 in order to protect the interest of farmers and rural people.
Each Regional Rural Bank is owned by three entities with their respective share as 50% to Central
Government, 15% to State Government and 35% to sponsor Bank and are regulated by NABARD.
Significance of the Study
According to the Economic Survey 2010-11, it has been reported that NBFCs as a whole
account for 11.2 percent of assets of the total financial system. With the growing importance
assigned to financial inclusion, NBFCs have come to be regarded as important financial
intermediaries particularly for the small-scale and retail sectors. In the multi-tier financial system
of India, importance of NBFCs in the Indian financial system is much discussed by various
committees appointed by RBI in the past and RBI has been modifying its regulatory and
supervising policies from time to time to keep pace with the changes in the system. NBFCs have
turned out to be engines of growth and are integral part of the Indian financial system, enhancing
COMPARITIVE ANALYSIS OF NBFCS AND BANKS
8
competition and diversification in the financial sector, spreading risks specifically at times of
financial distress and have been increasingly recognized as complementary of banking system at
competitive prices.
In emerging economies like India, Non-Banking Financial Companies often play an
important role because of their ability to (a) reach out to inaccessible areas; and (b) act as not just
complements but also substitutes to banks when the banks are confronted with stricter regulatory
constraints. Customers tend to find the non-banking entities convenient due to their quicker
decision-making ability, prompt provision of services and expertise in niche segments. Apart from
widening the ambit of and access to financial services, they also enhance the resilience of the
financial system by acting as backup institutions when banks come under stress
The Banking sector is also functioning in parallel to the NBFCs in financial front providing
many other services which NBFCs are not able to offer. Banks has always been highly regulated,
however simplified sanction procedures, flexibility and timeliness in meeting the credit needs and
low cost operations resulted in the NBFCs getting an edge over banks in providing funding. The
purpose of the study is to fill the research Gap of comparative analysis of NBFCs and Banks as
the significant institutions of our financial Economy.
The objective of the study is to comprehend the comparative growth potential of NBFCs
and Banks in India. The main motive is to compare the performances on key financial parameters
that is profitability, leverage and liquidity ratio.
Both Non-Bank Financial Companies and Banks are not governed by the heterogeneous
factors. Therefore, financial implication can differ for different set of services they provide.
Moreover, a study by T.S. Harihar9 throws light on the performance of all NBFCs taken together
in terms of cost of debt, operating margin, net profit margin, return on net worth, asset turnover
ratio etc. The study by Seema Saggar does not reflect the overall performance of NBFCs as it is
based on selected 10 companies. The study by Harihar reveals the aggregate performance of
NBFCs which does not throw light in parallel to the financial performance of Banks. “Analysis
of Financial Performance of Banks in India “by Jeevan Jayant Nagarkar has studied on financial
performance of fifteen banks, five from each category that is Public, Private and Foreign banks;
and depicted the results of Banking performance on the basis of fifteen Banks. In the light of these
COMPARITIVE ANALYSIS OF NBFCS AND BANKS
9
limitations, the present thesis attempts to examine the financial performance of Non-Banking
Financial Companies and Banks as in past years no such comparative research has been conducted.
The present study attempts to examine the relative financial performance of NBFCs and
Banks for the period 1995-2010 in terms of profitability, leverage and liquidity. The reasons of
selecting this period for the purpose of study are: a) During this period the number of NBFCs have
flourished by leaps and bounds. b) The absolute amount of deposits with NBFCs have gone up
from Rs. 4956.6 crores to Rs. 85495.1 crores (increase is almost 17 times). c) The share of deposits
with reporting NBFCs have gone up over a period of time from 4.78% to 16.49% (The share is as
a percentage of total deposits of Reporting NBFCs Non-financial companies and scheduled
commercial banks).
Objective of the Study
The Main Motive of the study is to examine the comparative performance of Scheduled
Commercial Banks and Non-Banking Financial Companies in order to have clear picture of their
contribution to the Financial Economy by evaluating their performances. The objective of this
study is to comprehend the comparative growth potential of NBFCs and Banks and to compare
their performances on the basis of key financial parameters that is profitability, leverage and
liquidity ratios.
Data and Methodology
For the present study secondary data is collected from various issues of RBI Bulletin
regarding Financial and Investment companies and for Banks it is collected from articles of
Business of Commercial Banks in India of RBI. As mentioned above, the period covered in the
study is of fifteen years from 1995 to 2005.
The study presents an analysis of the performance of Non-Government Non-Banking
Financial and Investment (excluding insurance and banking companies) for fifteen-year period.
The data for 282 Scheduled Commercial Banks for fifteen-year period is collected from
Annual Balance sheet of Banks.
COMPARITIVE ANALYSIS OF NBFCS AND BANKS
10
For the purpose of analysis, various ratios of profitability, leverage and liquidity, average
of fifteen years’ ratio i.e. 1995 to 2000 is found for Scheduled Commercial Banks and Non Baking
Financial Companies separately.
Further, to analyze if there is a significant difference between the performance of NBFCs
and Scheduled Commercial Banks, Analysis of Variance (ANOVA) is applied on each ratio. This
statistical tool will assist in gauging the financial performance of NBFCs and Scheduled
Commercial Banks which have been selected for the study for fifteen-year period.
Hypothesis:
To analyze the comparative performance of Banking Sector and NBFCs, we will take
hypothesis as
H0: There is no significant difference between the performance of Banks and Non-bank
financial companies.
H1: There is a significant difference between the performance Banks and Non-bank
financial companies.
Limitations of the study
1. The research study is based on secondary data.
2. There may be other statistical and financial tools also to judge the sustainability and performance
of NBFCs and Banks but in this research paper only the above mentioned statistical and financial
tools have been used. Hence, the conclusions drawn may not reveal the complete picture of NBFCs
and Banks as far as their sustainability is concerned.
3. Due to unavailability of data, only fifteen years’ period that is from 1995 to 2000 is considered.
Hence, conclusions derived pertaining to comparative Analysis of Non-Banking Financial
Company and Scheduled Commercial Banks in India may not reflect the complete scenario of their
financial performance.
COMPARITIVE ANALYSIS OF NBFCS AND BANKS
11
CHAPTER 2: Literature Review
Buddhosev Sinha, has discussed about the current scenario the Non-Banking Financial
Companies which have added overall depth to the financial sector and perceived vital significance
in the developing economy. It has highlighted the growth pattern of the non-banking financial
companies and their classification based on the services they provide. To evaluate the financial
performance of selected NBFCs , three ratios are calculated that are a) Net Sales / Net Revenue
from Operations; b) Profit / Loss Before Tax and c) Profit After Tax / Profit or Loss for the period
and then F test is applied for the further analysis.
It is rightly said that for driving the country’s economy to the modern era , it is required to
have proper functioning of financial system (Kroszner, 2010) . In every advanced economy,
efficient financial structure delivers the variety of financial services and others instruments and act
as significant base in contribution to stability of macroeconomic front and sustained growth of the
economy. Moreover, in the developed financial structure, there is a mobilization of savings which
offers investors and savers a wider choice of instruments and with emergence of the Non-Banking
Financial Companies in the financial system, the investors could now make effective choices by
parking their funds at more lucrative instrument in comparison to the deposits of banks.
In the favor of NBFCs, Greenspan (1999) quoted ‘enhance the resilience of the financial
system to economic shocks by providing it with an effective ‘‘spare tyre’’ in times of need’ While
the need of short term loans by particular industries and agriculture are fulfilled by banks, the other
forms of services and instruments which are require by industries and different segments of the
economy are offered by the Non-Banking Financial Companies.
S. Kantwala attempts to analyse the financial performance of different categories of
NBFCs in terms of profitability, leverage and liquidity ratios for the period 1985-86 and 1994-95.
The author has selected this period because of the immense growth of Non-Banking Financial
Companies and their absolute amount of deposits which grew by 17 times from 4956.6 crores to
Rs.85495.1 crores. The paper has also discussed about the groups for which the maximum number
of ratios are similar. To examine, if these ratios differ significantly between the various categories
of NBFCs that are Trading in shares and investment holdings (TS+IH), Hire purchase finance
(HP), loan finance (LF) and d) leasing (L), one-way Analysis of Variance (ANOVA) is applied. It
COMPARITIVE ANALYSIS OF NBFCS AND BANKS
12
was concluded that there is a significant difference in the three ratios mentioned of the various
categories of NBFCs.
In the The Sustainability Dimension: A Study of Selected NBFCs published by The
institute of Company Secretaries of India, the paper has considered selected NBFCs which are
listed in BSE and creating their strong impact in terms of performance based on key parameters
that is Reported Net Profit After Tax (PAT), Earnings Before Interest and Tax (EBIT), Loans and
Advances. The paper is made to ascertain that if there is a significant difference or not between
the selected NBFCs based on PAT and EBIT. Furthermore, growth potential of loans and advances
of Non-Banking Financial Companies is also examined. To analyze the sustainability of selected
Non-Banking Financial Companies, Business valuation method was applied.
Gumparthi and Manickavasagam (2010) studied on Risk Assessment Model for Assessing
NBFC (Manickavasagm, 2010) (Asset Financing) Customers’. The main motive of this paper is
create a Risk Assessment Model for NBFCs which is based on Market forces and also studied 28
parameters to measure the risk related to customer identification out of which 12 parameters proves
to be the significant ones.
Vadde (2011) studied on performance of Non-Banking Financial Companies in India and
its evaluation by examining the financial structure of non-government financial and investment
companies for the period April 2008 to March 2009 based of Annual Accounts of 12115 Non-
Banking Financial Companies. The data for the study is secondary collected from various issues
of RBI Bulletin. The study concluded that income and expenditure growth decelerated during the
period but this deceleration was more observed in income growth.
Sornaganesh and NavisSoris (2013) investigated on the topic, “A Fundamental Analysis of
NBFC in India” to analyse the profitability position of 5 sample NBFC companies, such as, STF,
SF, BF, and M&MF for the period from April 2008 to March 2012, using Ratio Analysis of
collecting data from the Annual Reports and Balance Sheets of the sample companies. The study
revealed that SF has performed better in terms of Earnings Per Share (EPS) followed by STF, BF,
CF & M&MF but STF and M&MF were found to be far better than other in NPM (Net Profit
Margin).
COMPARITIVE ANALYSIS OF NBFCS AND BANKS
13
Perumal and Santheskumar (2013) studied on the topic “Non-Banking Financial
Companies” analysing the Balance Sheets and Income Statements of two sample companies, i.e.,
Sundaram Finance Limited and Lakshmi General Finance Limited for the period 2007-2012 using
primary and secondary data. The study was conducted using various statistical tools like, average,
standard deviation, co-efficient of variation, trend analysis, index number etc. and concluded that
the contribution of NBFCs to economic development is highly significant and there is need to
integrate it with the mainstream financial system and RBI should be vested with more power to
monitor NBFCs in an effective manner.
Kaur and Tanghi (2013) investigated on the topic “Non-Banking Financial Companies,
Role and Future Prospects” with a focus to analyse role and importance of NBFCs in India. The
paper concluded that NBFCs have to concentrate more on their core strengths and must constantly
endeavor to hunt for new products and services in order to survive and grow constantly.
Arun Kumar (2014) has made an attempt on the topic “Non-Banking Financial
Companies: A Review” and after observing twelve studies of different authors he concluded that
due to the regulations of the Reserve Bank of India, still the NBFCs are not foraying into more
credit and suggested in the NBFC credit policy for reduction of interest rates. The study observed
a research gap which is, evaluation of performance of NBFCs in India.
Arora and Kaur (2006) stated that banking sector in India has given a positive and
encouraging response to the financial sector reforms. Entry of new private banks and foreign banks
has shaken up public sector banks to competition. Changing financial scenario has opened up
opportunities for the banks to expand their global presence through self-expansion, strategic
alliances, etc. Banks are diverting their focus on retail banking so as to attain access to low-cost
funds and to expand into relatively untapped potential growth area.
The Travancore Banking Enquiry Commission and Travancore Companies Act (1938)
recommended that the banks in the state were prohibited from conducting kuri business. But after
Independence following the extension of the Indian Companies Act (1913) to Travancore State,
the position changed and banks restarted the kuri business with effect from 1st April 1951.
COMPARITIVE ANALYSIS OF NBFCS AND BANKS
14
Banking Companies Act (1949) regarded kuries as an agency business which banks could
take up and therefore, chit fund business re-emerged as an essential segment of the operations of
several banks in South India.
William Logan (1951) mentioned the presence of a flourishing Kuri or lottery system
existing in the society. He also described the operation of kuri system among friends known as
‘Changaathi Kuri’.
According to S.K.Basu (1961) A Non-Banking Financial Company (NBFC) is a company
incorporated under the companies Act, 1956, and conducting the financial business as its principal
business. In India, the Non-Banking Financial sector comprises a multiplicity of institutions, which
are defined under section 45 I (a) of the Reserve Bank of India Act, 1934.
According to R.G. Saraiya (1974) the annual savings mobilization through chit funds is in
multiples of 100 crores
Though these savings are less comparing with commercial banks, the number of people
benefited by chit funds is quite large. He has brought forth the recommendations of the Banking
Commission, which has recommended that the State Governments may consider Starting Chit
Funds at strategic places as model foremen with the object of offering effective competition to
private chit funds and thus acting as a disciplining factor.
Nayar (1986) pointed out that Chit Funds have come to stay as a unique non-banking
financial intermediary in India especially in South India. He also pointed out that the rationale of
an auction Chitty or Business Chitty is that the borrowers and lenders meet to fix the rate of interest
and since there is more than one borrower competing for the same amount, a competitive rate of
interest is offered. Only the members enjoy the benefits of the scheme. The study highlighted the
fact that for the subscribers, the return on subscriptions was not the only consideration. The
possibility of getting a lump-sum on easy terms at short notice was a great inducement. Hence, it
is advisable to retain these within the frame work of non-banking financial institutions controlled
under chit funds act 1982, by the state government.
The RBI reports in Trend and Progress of Banking in India (2008) indicates that even after
the four decades of banks’ nationalization, country’s 41 per cent adult population remained outside
the banking system but is surmised to be covered by the NBFCs wise Chit Funds’.
COMPARITIVE ANALYSIS OF NBFCS AND BANKS
15
Ali Akhan (2009) stated that the Non-Banking Financial Companies (NBFCs) have been
playing a very significant role in the present day rigorous money-market conditions. They are
serving the nation by supporting the economic reconstruction and giving a booster to industrial
production. They are engaged into the business of providing loans and advances of small amounts
for a short-period to small borrowers. The Non-Banking Financial Companies (NBFCs) play an
important role in channelizing these savings into investment. They have supplemented the role
played by the banks.
According to Bala Bharathi and Sanjoy De (2009) NBFCs are financial entities that
provide banking services without meeting the legal definition of a bank. They are typically not
allowed to take deposits from general public and hence have to seek other means of funding. These
NBFCs have matured a lot and even withstood the recent deadly crisis with a lot of resilience.
NBFCs can reach the unorganized segments of society with their ability to provide innovative
financial services. These entities play a critical role in disbursing credit to the rural sector, thus
preventing the concentration of credit risk in banks. In urban areas too, NBFCs focus on non-
salaried individuals, traders, transporters and stock brokers who are neglected by banks.
Dr.Amrit Patel and Dr.Gopal Kalkoti (2010) mentioned that according to RBI, the major
reason for increase in overall household debt and increase in the share of rural household
indebtedness to non-institutional sources was a significant increase in the current farm expenditure
and household expenditure for which households found it difficult to obtain loans from banks. In
addition to that the cumbersome procedure of submitting various documents with loan applications
and documentation process led to an average of 33 weeks taken by commercial banks to approve
loans. And this scenario is the niche forchit fund like entities under the banner of NBFCs.
Dr. Jatinder Kaur (2010) reveals that, despite the phenomenal growth of banking sector,
the extent of rural indebtedness in India has been on a continuous rise. About one-third of the rural
credit requirements are still met by non-institutional sources, like moneylenders. The favoring
factor of moneylenders is that banks will not sanction loans for consumption purposes and default
of repayment of previous loan makes it ineligible for further assistance from banks.
COMPARITIVE ANALYSIS OF NBFCS AND BANKS
16
Usha Thorat (2010) states that non-banking entities can be either non-banking non-
financial entities or non-banking financial entities. In case of non-banking financial entities, there
mare deposit taking and non-deposit taking financial companies is there. Considering the
difficulties in ensuring the effective supervision of large number of small deposit-taking entities,
fresh approvals to NBFCs for accepting deposits are not considered.
COMPARITIVE ANALYSIS OF NBFCS AND BANKS
17
CHAPTER 3: Theoretical framework
NBFCs Scenario in India
Indian Economy has a huge hidden credit demand stoked by a huge self-Employed
population that is underserved by banks due to insufficient income proof. With public sector banks
under
As of March 2016, there were 11,682 non-banking financial companies (NBFCs) registered
with the Reserve Bank of India, of which 202 were deposit-accepting (NBFCs D) and 11,480 were
non-deposit-accepting NBFCs (NBFCs- ND). There were 220 systematically important non-
deposit accepting NBFCs (NBFCs-ND-SI). All NBFCs-D and NBFCs-ND-SI are subject to
prudential regulations like capital adequacy requirements and provisioning norms along with
reporting requirements.
As far as financial performance is concerned the aggregated balance sheet of the NBFC
sector expanded by 15.5 percent on a y-o-y basis in March 2016 in comparison to 15.7 percent in
2015. Loans and advances enhanced by 16.6 percent, while, total borrowings increased by 15.3
percent in March 2016.
Figure 2 Number of NBFCs
Source: Reserve Bank of India
11200
11400
11600
11800
12000
12200
12400
FY 2013 FY 2014 FY 2015 FY 2016 FY 2017
COMPARITIVE ANALYSIS OF NBFCS AND BANKS
18
It is quite interesting to note that the financial performance of NBFC sector has remained
constant for the last two years. Net profit as a percentage of total income remained at 18.3 percent
between March 2015 and March 2016 and ROA stood at 2.2 percent during the same period. ROE
enhanced to 10.6 percent from 10.3 percent
While the regulatory norms for the NBFC sector are sought to be brought closer to those
applicable to schedule commercial banks, the performance of this sector (ROE and ROA) seems
to be much better as compared to that of banks. GNPAs of the NBFC sector as a percentage of
total advances reduced to 4.6 percent in March 2016 from 5.1 percent in September 2015. NPAs
as a percentage of total advances also fell to 2.5 percent from 2.9 percent during the same period.
Stress test on credit risk for the NBFC sector as a whole for the period ended March 2016
was conducted under three situations: a) GNPA increase by 0.5 SD, b) GNPA increase by 1 SD
and c) GNPA increase by 3 SD. The results indicate that in the first and second scenarios, the
CRAR of the sector was marginally affected while in the third scenario, it reduced to 23.3 percent
from 24.3 percent. This however, was much above the regulatory minimum needed level of 15
percent.
With public sector banks under severe stress due to soaring non-performing assets, the
appetite to lend is expected to be weak in the medium term till a proper resolution is found.
Consequently, it will result into yawning of gap in the market which will create immense
opportunities for NBFCs. Further, the recent developments in deepening of wholesale debt markets
also bode well for liquidity and funding of NBFCs. Looking into the operational angle of NBFCs,
they operate at higher yields as majority of them operate in underserved markets. Despite the cost
of funds disadvantage, they operate at higher NIM (Net Interest Margin). Their operational costs
and bad debt expenditure is lower as compared to banks resulting into much higher Return on
Assets (ROA). Even being at a lower leverage in comparison to banks, NBFCs deliver higher ROE.
This became a reality on account of extremely focused business model designed around a product,
i.e. customer segment. This approach has assisted the NBFCs to function with better response
times and service levels, resulting into faster growth as compared to banks.
Despite, such prodigious growth and impressive story of NBFCs, a blizzard also exist, i.e.
nearly 200 non-banking financial companies (NBFCs) are facing the threat of closure due to non-
adherence to Reserve Bank of India's mandated requirement of minimum investment grade credit
COMPARITIVE ANALYSIS OF NBFCS AND BANKS
19
rating to accept deposits. These NBFCs comprise mostly of localized small-time lenders who have
knocked the doors of the regulator seeking relaxation in rating norms, citing the reason that they
are being treated in the same way like a big NBFC is treated.
Going by the Financial Stability Report, December 2016 and the Report of Trend and
Progress of Banking in India, 2015-16, published by RBI, the picture appears to be gloomy. The
number of NBFCs in 2013 stood at 12225 which declined to 11555 by H1 FY 2017 (please refer
exhibit 4). Another worrying scenario of NBFCs is regarding GNPA (Gross Non-Performing
Assets). During the first half of FY16-17, the NBFCs reported GNPA of 4.9% which was 4.6% at
the end of FY15- 16. A non-linearity in GNPA and NNPA of NBFCs can be observed during the
period March 2013 to September 2016. In case of GNPA it was 3.6% in March 2013 which rose
to the highest at 5.1% for two years, i.e. September 2014 and September 2015. The scenario
improved a little in March 2016, as GNPA was registered at 4.6% but the situation aggravated in
September 2016, as GNPA stood at 4.9%. On the other hand, NNPA was at its lowest in March
2013, i.e. 1.6% which after witnessing ups and downs touched 2.7% in September 2016. In case
of NNPA also, the situation has worsened. Even comparing the NNPAs of March 2016- 2.5% and
September 2016- 2.7%, i.e. a rise of 0.2% can be observed (please refer exhibit 5). The
deterioration in the asset quality of NBFCs can be attributed to the interconnectedness of the NBFC
sector with the banking sector and appalling performance of the banking sector in terms of asset
quality. But the silver lining is that despite the mentioned bottlenecks, NBFCs are gradually
making their way into balance sheet of companies, particularly those in the small and medium size
category and in the real estate business irrespective of size.
Reserve Bank of India formulated a new category of NBFCs as NBFC-account aggregators
(AAs) in September 2016 aimed at facilitating a consolidated view of individual investors'
financial asset holdings, especially when the entities fall under the purview of different financial
sector regulators.
NBFCs' Strengths
NBFCs have their competitive advantage over banks by their ability to contain risk, adapt
to dynamic market changes and tap demand in markets ay an individual level which results in
making them successful over bigger institutions.
COMPARITIVE ANALYSIS OF NBFCS AND BANKS
20
Risk assessment is the most crucial factor in the financial sector. NBFC cater to the
relatively riskier category and most of them found way at containing risks. In the late 1990 during
the market slowdown, the NPAs increased sharply in the portfolio of banks and financial
institutions. Top-rung NBFCs managed to hold on better risk profile than banks by keeping Lower
proportion of loans to corporate and a more effective recovery mechanism.
The corporate loans which are usually of higher amount means that a single default has a
bigger impact. NBFCs that were into commercial lending were perhaps facilitating low proportion
of loan to each customer vis-a-vis the total disbursement which in case of a default would have
limited impact. The small size of the loans coupled with a better collection mechanism resulted
in effective risk containment by the NBFCs. This was further aided by the greater flexibility of the
NBFC structure, which also enables the NBFCs to act with dispatch when they sense an
opportunity.
The BFCs also have an edge in accessing fixed deposits which gives them access to the
database and leverage on the same. Lack of reliable data has often tripped big names in the
corporate world.
The top NBFCs have adapted themselves for the dynamically changing. The top-rung
NBFCs have equipped themselves for the fast-changing environment where all intermediaries are
competing for retail finance. An outcome of the increased competition is that profit margins of
the NBFCs will decline. Moreover, with a huge resources committed to such areas as insurance,
which may take years to attain profitability, profit levels are unlikely to be as high as they were.
Last year, the share price of quite a few NBFCs rose sharply only to fall rapidly. Share
prices are unlikely to witness any significant, sustained rise this year in the light of the low
premium the stock market attaches to financial services, in general, and especially with the
prospect of a decline in returns on investment in the near term.
Investors with exposures in such top-rung NBFCs as Sundaram Finance, Tata Finance or
Kotak Mahindra may stay invested as there are possibilities of moderate gains in the medium term.
However, fresh exposures may be avoided.
COMPARITIVE ANALYSIS OF NBFCS AND BANKS
21
Performance of Scheduled commercial Banks
The credit growth of Scheduled Commercial Banks declined on y-o-y basis, across the
bank-groups, whereas, deposit growth increased between September 2016 and March 2017. SCBs’
capital to risk-weighted assets ratio (CRAR) improved from 13.4 per cent to 13.6 per cent between
September 2016 and March 2017. However, the Tier-1 leverage ratio at the system level declined
marginally during the same period.
SCBs’ annual profit after tax (PAT) expanded by 48.0 per cent in 2016-17 as against a
decline of 61.6 per cent in 2015-16, mainly due to higher increase in other operating income (OOI)
and lower rise in risk provisions. However, public sector banks (PSBs) once again recorded
negative returns on their assets. The share of OOI in total operating income increased sharply from
30.7 per cent in 2015-16 to 36.2 per cent in 2016-17, mostly contributed by profit on securities
trading. Continuing deceleration in the growth of assets of SCBs along with deterioration in their
asset quality resulted in a secular decline in the share of net interest income (NII) in total operating
incomeThe gross non-performing advances (GNPAs) ratio of SCBs rose from 9.2 per cent in
September 2016 to 9.6 per cent in March 2017. The net nonperforming advances (NNPAs) ratio
of SCBs increased marginally from 5.4 per cent in September 2016 to 5.5 per cent in March 2017.
The stressed advances7 ratio declined from 12.3 per cent to 12.0 per cent due to fall in restructured
standard advances. While there is a fall in stressed advances ratio in agriculture, services and retail
sectors, the stressed advances ratio in industry sector, however, rose from 22.3 per cent to 23.0 per
cent mainly on account of subsectors such as cement, vehicle, mining & quarrying and basic
metals. Accretion of new NPAs from restructured standard advances declined in 2016-17
COMPARITIVE ANALYSIS OF NBFCS AND BANKS
22
Figure 3 Credit and deposits Y-o-Y growth
SOURCE: Reserve Bank of India
Large borrowers account for 56 per cent of gross advances and 86.5 per cent of GNPAs of
SCBs, whereas, top 100 large exposures account for 15.2 per cent of gross advances. Non-
performing accounts within top 100 exposures contribute to 25.6 per cent of GNPAs of SCBs.
While the level of GNPAs of large borrowers increased between September 2016 and March 2017,
their restructured standard advances declined during the same period resulting in reduction of total
stressed advances by 1.8 per cent.
Comparison Between Banks and NBFCs in India
A) Incorporation: The regulatory Bodies are determined by the Act under which each of these
financial institutions is set up. It is important to know under whose purview these institutions fall
in case of any irregularities or legal problem. Banks are incorporated under the Banking Regulation
Act, 1949 whereas NBFCs are incorporated under the Companies Act 1956.
B) Services Provided Majority of the services are the same, but the major points of difference in
services make these two entities significantly unique
1. Demand Deposits: We can withdraw our deposits from Banks on demand but this facility is not
available with NBFCs.
COMPARITIVE ANALYSIS OF NBFCS AND BANKS
23
2. Payment and settlement system: This system involves transfers from one financial institution to
another. While the banks are an integral part of this economic system, Non-Banking Financial
Companies are not.
3. Deposit Insurance- Varying as per Banks, deposits of the common public are insured up to a
certain value with the banks. This makes Banks more dependable. Deposits with the NBFCs are
not insured.
C) Foreign Investment: Foreign Investment up to 100 % is permitted in case of a NBFC but this
limit is earmarked at 74% for Private Banks.
D) Fixed Deposits: Both NBFCs and Banks accept fixed deposits. Yet, there is a difference
between the two. Fixed Deposits of Non-Banking Financial Companies are generally rated by the
rating agencies in the country. While, the Fixed Deposits of Banks are not rated by rating agencies.
If NBFCs default on its payment, you would lose your principal and insurance amount, which is
why it is not recommendable to go for highly rated safe fixed deposits. Also, Non-Banking
Financial Companies tend to offer higher interest rates compared to Banks.
E) Maintenance of Reserve Ratio: It is mandatory for banks, both Private and Public to maintain
the interest rates that RBI dictates as per the Banking Regulation Act, 1949 but NBFCs are not
under such an obligation as they are registered under Companies Act 1956.
F) Transaction Services: These are services which are carried out for money transfer, typically for
corporates by the Banks. It includes commercial banking products, domestic and cross border
payments and professional risk mitigation for international trade. These type of services are
provided by banks but not by NBFCs.
G) Lending: Banks tends to target corporates as well as retailers. While, NBFCs generally targets
for retail sectors but not usually to big power projects. For instance, they would rather go for
vehicle finance, consumer loans etc.
Also banks, offers different types of credit cards according to the needs of customer. On
the other hand, Non Baking Financial Companies do not offer such services.
F) Rating: Deposits of NBFCs are rated, while the deposits of banks are not and deposits of banks
are considered safe, while deposit of NBFCs are not considered same. Also, deposits of NBFCs
COMPARITIVE ANALYSIS OF NBFCS AND BANKS
24
are not guaranteed while that of banks are. Ratings of Non-Banking Finance Companies are
usually check before investment. In general, AAA rated are considered safe as it ensures timely
payments of interest and principal amount.
COMPARITIVE ANALYSIS OF NBFCS AND BANKS
25
CHAPTER 4: Research and Procedure
Purpose of the Study
The Purpose of the study is to examine the comparative performance of Banking sector
and Non-Banking Financial Companies in order to have a clear picture of their contribution to the
Financial Economy. Since they both hold a key position in the financial system and as mentioned
playing an important role in the economic development by expanding their wings in the form of
advancing credit to almost all the sectors of the economy and various echelons of population it is
extremely essential that these financial institutions should be sustainable as their financial collapse
may possibly trigger uncontrollable financial cataclysm.
The objective of this study is to comprehend the comparative growth potential of NBFCs
and Banks and to have comparison of their performances on the basis of key financial parameters
that is profitability, leverage and liquidity ratios. This study is conducted to have better
understanding of financial institutions and their significance in the financial structure of the
country.
Data
For the present study secondary data is collected from various issues of RBI Bulletin
regarding Financial and Investment companies and for Banks it is collected from articles of
Business of Commercial Banks in India of RBI. As mentioned above, the period covered in the
study is of fifteen years from 1995 to 2005.
The study presents an analysis of the performance of Non-Government Non-Banking
Financial and Investment (excluding insurance and banking companies) for fifteen-year period
based on the audited annual accounts data of 18,225 companies, out of which 17,636 company’s
data are based on the Ministry of Corporate Affairs(MCA) which mainly covers four categories of
NBFCs that are a) Trading in shares and investment holdings (TS+IH), b) Hire purchase finance
(HP), c) loan finance (LF) and d) leasing (L).
COMPARITIVE ANALYSIS OF NBFCS AND BANKS
26
This thesis attempts to have comparative analysis of financial performance of Banks with
NBFCs. The data for 282 Scheduled Commercial Banks for fifteen-year period is collected from
Annual Balance sheet of Banks which covers all the categories that are
a) Public Sector Banks
b) Private Sector Banks,
c) Foreign Banks and
d) Regional Rural Banks
For the purpose of analysis, various ratios of profitability, leverage and liquidity, average
of fifteen years’ ratio i.e. 1995 to 2000 is found for Scheduled Commercial Banks and Non Baking
Financial Companies separately. three broad group: viz. profitability ratios, leverage ratios and
liquidity ratios. The ratios under study are
COMPARITIVE ANALYSIS OF NBFCS AND BANKS
27
Methodology
To analyze the financial performance of Banks and Non-Banking Financial Companies,
first financial ratios that are profitability, Leverage and Liquidity Ratios are evaluated for each
year of fifteen-year period.
Profitability Ratios are taken in order to assess a business’s ability to generate earnings
compared to its expenses and other relevant costs incurred during a specific period of time. High
Profitability ratio means high efficiency of organization due to which it turns business activities
into profits.
Leverage Ratio is one of the several financial measure that looks how much capital comes
in the form of Debt and assesses the ability of a company to meet its financial obligation. Highly
leveraged means that organization has more debt than equity.
Liquidity Ratio is taken into consideration in order to measure company’s ability to pay
Debt obligation and which is calculated as Company’s Assets by its Liabilities. High current ratio
means organization is more likely to meet its liabilities which are due over the next twelve months.
Further, to analyze if there is a significant difference between the performance of NBFCs
and Scheduled Commercial Banks, Analysis of Variance (ANOVA) is applied on each ratio. This
statistical tool will assist in gauging the financial performance of NBFCs and Scheduled
Commercial Banks which have been selected for the study for fifteen-year period.
Hypothesis:
To analyze the comparative performance of Banking Sector and NBFCs, we will take hypothesis as
H0: There is no significant difference between the performance of Banks and Non-bank financial
companies.
H1: There is a significant difference between the performance Banks and Non-bank financial
companies.
COMPARITIVE ANALYSIS OF NBFCS AND BANKS
28
Design of the Study
As, the main motive of this study is to examine the comparative performance of Scheduled
Commercial Banks and Non-Banking Financial Companies, in order to have clear picture of their
contribution to the Financial Economy by evaluating their performances. The objective of this
study is to accomplished by comparing their performances on the basis of key financial parameters
that is profitability, leverage and liquidity ratios.
In profitability ratio, seven Indicators are taken which will define business’s ability to
generate earnings compared to its expenses.
In leverage ratio, six Indicators are taken which measures the amount of capital that comes
in the form of Debt and assesses the ability of a company to meet its financial obligation.
To measure the liquidity of Banks and NBFCs, current ratio is measured which is
calculated as current assets by current ratio.
RATIO DESCRIPTION
INCOME/ASSET Return on Assets (ROA) Return on assets (ROA) is a financial ratio
that shows the percentage of profit a company earns in relation to its overall
resources.
OPERATING
PROFIT / TOTAL
ASSET
The return on total assets (ROTA) is a ratio that measures a
company's earnings before interest and taxes (EBIT) against its total net
assets. The ratio is considered to be an indicator of how effectively a
company is using its assets to generate earnings before contractual
obligations must be paid.
PROFIT AFTER
TAX /NET
WORTH
The ratio is determined by a formula that divides net profit after taxes
by shareholder investment plus retained earnings. Retained earnings are a
percentage of net earnings not paid out as dividends but that are retained to
reinvest in the company or pay down debt.
COMPARITIVE ANALYSIS OF NBFCS AND BANKS
29
RATIO DESCRIPTION
TAX
PROVISION
/PROFIT
BEFORE TAX
A provision for income taxes is the estimated amount that a business
or individual taxpayer expects to pay in income taxes for the current year.
RETURN ON
NET WORTH
Return on equity (ROE) is a measure of profitability that calculates
how many dollars of profit a company generates with each dollar of
shareholders' equity. The formula for ROE is: ROE = Net
Income/Shareholders' Equity. ROE is sometimes called "return on net
worth."
PROFIT BEFORE
TAX TO TOTAL
INCOME
Before-tax profit margin is a financial performance ratio, calculated
by dividing net profit before taxes by revenue. A company's before-tax profit
margin is important because it tells investors the percentage of money a
company actually earns per dollar of revenue.
Borrowings to
Total assets
The debt to total assets ratio is an indicator of financial leverage. It
tells you the percentage of total assets that were financed by creditors,
liabilities, debt. The debt to total assets ratio is calculated by dividing a
corporation's total liabilities by its total assets.
Bank
borrowing to
total asset
For investment banks, the average debt/equity is higher, about 3.1.
The debt/equity ratio is a leverage ratio that represents what amount of debt
and equity is being used to finance a company's assets. It is calculated as
total liabilities divided by total shareholders' equity.
Net worth to
total assets
Net worth of an individual is the difference between his/her total
assets and total liabilities. Net worth is positive if the accumulated assets are
worth more than the liabilities. This ratio indicates the ability of an
COMPARITIVE ANALYSIS OF NBFCS AND BANKS
30
RATIO DESCRIPTION
individual to repay all his/her existing debts using existing assets in case of
unforeseen events
Bank
Borrowing to
total borrowing
For example, if the leverage ratio is 2, the company was able to
obtain in debt double of what they have as equity. In that way, the more a
business has money invested by the shareholders and / or the profits of the
company, the more it is able to borrow at the bank, which explains the use
of the term “leverage”.
Debt Equity The debt-to-equity ratio (D/E) is a financial ratio indicating the
relative proportion of shareholders' equity and debt used to finance a
company's assets. Closely related to leveraging, the ratio is also known as
risk, gearing or leverage.
Loans to
current Assets
The loans to assets ratio measures the total loans outstanding as a
percentage of Current assets. The higher this ratio indicates a bank is loaned
up and its liquidity is low. The higher the ratio, the more risky a bank may
be to higher defaults.
Current Asset/
Current
Liabilities
Current Assets divided by Current Liabilities, measuring current
assets available to cover current liabilities, a test of near-term solvency. The
ratio indicates to what extent cash on hand and disposable assets are enough
to pay off near term liabilities.
COMPARITIVE ANALYSIS OF NBFCS AND BANKS
31
Chapter 5: Analysis
After calculating fourteen indicators for both the Financial Institutions, Anova is applied
on each of the indicator to do comparative analysis.
Profitability Ratios
 Income by Assets Ratio
Descriptives
IA
N Mean Std. Deviation Std. Error
95% Confidence Interval for
Mean
MinimumLower Bound Upper Bound
Rank
15 7599 .32209
.
08316
.5815 .9382
.
01
N
NBFC
15 1171 .02026
.
00523
.1059 .1283
.
09
T
Total
30 4385 .39638
.
07237
.2905 .5865
.
01
ANOVA
IA
Sum of Squares Df Mean Square F Sig.
Between
Groups
3.098 1 3.098 59.496 .000
Within Groups
1.458 28 .052
Total
4.557 29
COMPARITIVE ANALYSIS OF NBFCS AND BANKS
32
It is evident that there is a significant difference between the performance of Banks and
Non-bank financial companies which concludes performance of Banks is better than performance
of NBFCs in terms of Income by Asset Ratio.
As from the Anova table, it is clear that Test Statistic: F = 59.496
For v1 = 1 and v2 = 28 and for α = 0.05, the table value of F is F0.05 =4.20
Since the calculated value of F=59.46 which is greater than the tabulated value of F = 4.20,
hence null hypothesis is rejected.
 Operating Profits to Total Assets
Descriptives
OPTA
N Mean Std. Deviation Std. Error
95% Confidence
Interval for Mean
M
inimum
Lowe
r Bound
Uppe
r Bound
B
ank
15 1.9433 .35981
.
09290
1.7441
2.142
6
1
.44
N
BFC
15 2.8467 1.71125
.
44184
1.8990
3.794
3
.
10
T
otal
30 2.3950 1.29894
.
23715
1.9100
2.880
0
.
10
COMPARITIVE ANALYSIS OF NBFCS AND BANKS
33
ANOVA
OPTA
Sum of
Squares
D
f
Mean
Square F
S
ig.
Between
Groups
6.120 1 6.120
4.
003
.0
55
Within
Groups
42.810
2
8
1.529
Total
48.930
2
9
It is evident that there is no significant difference between the performance of Banks and
Non-bank financial companies in terms of Operating Profit to Total Assets.
As from the Anova table, it is clear that Test Statistic: F = 4.003
For v1 = 1 and v2 = 28 and for α = 0.05, the table value of F is F0.05 =4.20
Since the tabulated value of F=4.20 is greater than the calculated value of F = 4.003, hence
null hypothesis is accepted
 Profit After Tax to Net Worth
COMPARITIVE ANALYSIS OF NBFCS AND BANKS
34
Descriptives
PATNW
N Mean
Std
. Deviation
S
td. Error
95% Confidence Interval
for Mean
Mini
mum
Lower
Bound
Upper
Bound
Bank
15 .1172
.04
433
.
01144
.0927 .1418 .01
NBFC
15 .1085
.14
069
.
03633
.0306 .1864 .02
Total
30 .1129
.10
259
.
01873
.0746 .1512 .01
ANOVA
PATNW
Sum of
Squares df
Mean
Square F
S
ig.
Between
Groups
.001 1 .001
.0
52
.8
21
Within
Groups
.305
2
8
.011
Total
.305
2
9
COMPARITIVE ANALYSIS OF NBFCS AND BANKS
35
It is evident that there is no significant difference between the performance of Banks and
Non-bank financial companies in terms of Profit After Tax to Net Worth.
As from Anova table, it is clear that Test Statistic: F = 0.052
For v1 = 1 and v2 = 28 and for α = 0.05, the table value of F is F0.05 =4.20
Since the tabulated value of F=4.20 is greater than the calculated value of F = 0.052, hence
null hypothesis is accepted.
 Tax Provision to Profit Before Tax
Descriptives
TPPBT
N Mean Std. Deviation Std. Error
95% Confidence Interval for Mean
Minimum
Lower
Bound
Upper
Bound
Bank 15 .2248 .15389 .03974 .1395 .3100 .12
NBFC 15 .4931 .63049 .16279 .1440 .8423 .13
Total 30 .3589 .47113 .08602 .1830 .5349 .12
ANOVA
TPPBT
Sum of
Squares df
Mean
Square F
S
ig.
Between
Groups
.540 1 .540
2.
565
.1
20
Within
Groups
5.897
2
8
.211
Total
6.437
2
9
COMPARITIVE ANALYSIS OF NBFCS AND BANKS
36
It is evident that there is no significant difference between the performance of Banks and
Non-bank financial companies in terms of Tax Provision to Profit Before Tax
As from Anova table, it is clear that the Test Statistic: F = 2.565
For v1 = 1 and v2 = 28 and for α = 0.05, the table value of F is F0.05 =4.20
Since the tabulated value of F=4.20 is greater than the calculated value of F = 2.565, hence
null hypothesis is accepted.
 Profit After Tax to Total Assets
Descriptives
PATTA
N
M
ean
Std.
Deviation
S
td. Error
95% Confidence
Interval for Mean
M
inimum
Lowe
r Bound
Uppe
r Bound
B
ank
1
5
.
0073
.002
88
.
00074
.0057 .0089
.
00
N
BFC
1
5
2
.2542
1.38
487
.
35757
1.487
3
3.021
1
.
13
T
otal
3
0
1
.1307
1.49
382
.
27273
.5729
1.688
5
.
00
COMPARITIVE ANALYSIS OF NBFCS AND BANKS
37
ANOVA
PATTA
Sum of
Squares
D
f
Mean
Square F
S
ig.
Between
Groups
37.863 1 37.863
3
9.484
.0
00
Within
Groups
26.850
2
8
.959
Total
64.714
2
9
It is evident that there is a significant difference between the performance of Banks and
Non-bank financial companies which concludes performance of NBFCs is better than banks in
terms of Profit After Tax to Total Assets
As from Anova table, it is clear that the Test Statistic: F = 39.484
For v1 = 1 and v2 = 28 and for α = 0.05, the table value of F is F0.05 =4.20
Since the calculated value of F=39.484 is greater than the tabulated value of F = 4.20, hence
null hypothesis is rejected.
 Return on Net Worth
COMPARITIVE ANALYSIS OF NBFCS AND BANKS
38
Descriptives
RNW
N Mean Std. Deviation Std. Error
95% Confidence Interval for
Mean
Minimum
Lower
Bound
Uppe
r Bound
Bank
15 12.2820 4.74178 1.22432 9.6561
14.90
79
1.27
NBFC
15 6.8760 4.25693 1.09913 4.5186
9.233
4
.02
Total
30 9.5790 5.21162 .95151 7.6329
11.52
51
.02
ANOVA
RNW
Sum of
Squares df
Mean
Square F
S
ig.
Between Groups
219.186 1 219.186 10.796
.
003
Within Groups 568.482 28 20.303
Total 787.668 29
It is evident that there is a significant difference between the performance Banks and Non-
bank financial companies which concludes performance of Banks is better than performance of
NBFCs in terms of Return on Net Worth
As from Anova table it is clear that the Test Statistic: F = 10.796
For v1 = 1 and v2 = 28 and for α = 0.05, the table value of F is F0.05 =4.20
Since the calculated value of F=10.796 is greater than the tabulated value of F = 4.20, hence
null hypothesis is rejected.
COMPARITIVE ANALYSIS OF NBFCS AND BANKS
39
 Profit Before Tax to Total Income
Descriptives
PBTTI
N Mean Std. Deviation Std. Error
95% Confidence Interval for
Mean
MinimumLower Bound Upper Bound
Bank 15 .0965 .03536 .00913 .0769 .1161 .02
NBFC 15 25.8327 16.44746 4.24672 16.7244 34.9410 4.04
Total 30 12.9646 17.37510 3.17224 6.4766 19.4526 .02
ANOVA
PBTTI
Sum of Squares df Mean Square F Sig.
Between Groups 4967.641 1 4967.641 36.727 .000
Within Groups 3787.284 28 135.260
Total 8754.925 29
It is evident that there is a significant difference between the performance Banks and Non-
bank financial companies which concludes performance of NBFCs is better than performance of
Banks in terms of Profit Before Tax to Total Income
As from Anova Table it is clear that the Test Statistic: F = 36.727
For v1 = 1 and v2 = 28 and for α = 0.05, the table value of F is F0.05 =4.20
Since the calculated value of F=36.727 is greater than the tabulated value of F = 4.20,
hence null hypothesis is rejected.
COMPARITIVE ANALYSIS OF NBFCS AND BANKS
40
Leverage Ratios:
 Borrowings to Total Assets
Descriptives
BTA
N Mean Std. Deviation Std. Error
95% Confidence Interval for
Mean
MinimumLower Bound Upper Bound
Bank 15 .0585 .01649 .00426 .0493 .0676 .04
NBFC 15 .6671 .23859 .06160 .5350 .7992 .07
Total 30 .3628 .35130 .06414 .2316 .4940 .04
ANOVA
BTA
Sum of Squares df Mean Square F Sig.
Between Groups 2.778 1 2.778 97.141 .000
Within Groups .801 28 .029
Total 3.579 29
It is evident that there is a significant difference between the performance Banks and Non-
bank financial companies which concludes performance of Banks is better than performance of
NBFCs in terms of Borrowings to Total Assets.
As from Anova table, it is clear Test Statistic: F = 97.141
COMPARITIVE ANALYSIS OF NBFCS AND BANKS
41
For v1 = 1 and v2 = 28 and for α = 0.05, the table value of F is F0.05 =4.20
Since the calculated value of F=97.141 is greater than the tabulated value of F = 4.20,
hence null hypothesis is rejected.
 Bank Borrowings to Total Assets
Descriptives
BBTA
N Mean Std. Deviation Std. Error
95% Confidence Interval for
Mean
MinimumLower Bound Upper Bound
Bank
15 .0155 .00748 .00193 .0114 .0197
.
01
NBFC
15 .2617 .16744 .04323 .1690 .3545
.
09
Total
30 .1386 .17099 .03122 .0748 .2025
.
01
ANOVA
BBTA
Sum of Squares df Mean Square F Sig.
Between Groups .455 1 .455 32.367 .000
Within Groups .393 28 .014
Total .848 29
COMPARITIVE ANALYSIS OF NBFCS AND BANKS
42
It is evident that there is a significant difference between the performance Banks and Non-
bank financial companies which concludes performance of Banks is better than performance of
NBFCs in terms of Income by Asset Ratio.
As from Anova Table it is clear that the Test Statistic: F = 32.367
For v1 = 1 and v2 = 28 and for α = 0.05, the table value of F is F0.05 =4.20
Since the calculated value of F=32.367 is greater than the tabulated value of F = 4.20, hence
null hypothesis is rejected.
 Net Worth to Total Assets
Descriptives
NWTA
N Mean Std. Deviation Std. Error
95% Confidence Interval for
Mean
MinimumLower Bound Upper Bound
Bank
15 .0620 .00547 .00141 .0590 .0651
.
05
NBFC
15 .8163 .18623 .04808 .7132 .9195
.
27
Total
30 .4392 .40485 .07392 .2880 .5904
.
05
COMPARITIVE ANALYSIS OF NBFCS AND BANKS
43
 ANOVA
NWTA
Sum of Squares df Mean Square F Sig.
Between Groups 4.267 1 4.267 245.878 .000
Within Groups .486 28 .017
Total 4.753 29
It is evident that there is a significant difference between the performance Banks and Non-
bank financial companies which concludes performance of NBFCs is better than performance of
Banks in terms of Net Worth to Total Assets.
As from Anova Table it is clear that the Test Statistic: F = 245.878
For v1 = 1 and v2 = 28 and for α = 0.05, the table value of F is F0.05 =4.20
Since the calculated value of F= 245.878 is greater than the tabulated value of F = 4.20,
hence null hypothesis is rejected.
 Loans to Current Asset
Descriptives
LCA
N Mean Std. Deviation Std. Error
95% Confidence Interval for
Mean
MinimumLower Bound Upper Bound
Bank
15
.
4558
.07045
.
01819
.4168 .4948
.
39
NBFC
15
.
3630
.14731
.
03804
.2814 .4446
.
09
Total
30
.
4094
.12288
.
02243
.3635 .4553
.
09
COMPARITIVE ANALYSIS OF NBFCS AND BANKS
44
ANOVA
LCA
Sum of Squares df Mean Square F Sig.
Between Groups .065 1 .065 4.844 .036
Within Groups .373 28 .013
Total .438 29
It is evident that there is a significant difference between the performance Banks and Non-
bank financial companies which concludes performance of NBFCs is better than performance of
Banks in terms of Loans to Current Assets.
As from Anova Table , it is clear that the Test Statistic: F = 4.844
For v1 = 1 and v2 = 28 and for α = 0.05, the table value of F is F0.05 =4.20
Since the calculated value of F=4.844 is greater than the tabulated value of F = 4.20, hence
null hypothesis is rejected. there
COMPARITIVE ANALYSIS OF NBFCS AND BANKS
45
 Bank Borrowings to Total Assets
Descriptives
BBTA
N Mean Std. Deviation Std. Error
95% Confidence Interval for
Mean
MinimumLower Bound Upper Bound
Bank
15 .0155 .00748 .00193 .0114 .0197
.
01
NBFC
15 .6671 .23859 .06160 .5350 .7992
.
07
Total
30 .3413 .37054 .06765 .2029 .4797
.
01
ANOVA
BBTA
Sum of Squares df Mean Square F Sig.
Between Groups 3.184 1 3.184 111.753 .000
Within Groups .798 28 .028
Total 3.982 29
It is evident that there is a significant difference between the performance Banks and Non-
bank financial companies which concludes performance of Banks is better than performance of
NBFCs in terms of Bank Borrowings to Total Asset
As from Anova Table it is clear that the Test Statistic: F = 111.753
For v1 = 1 and v2 = 28 and for α = 0.05, the table value of F is F0.05 =4.20
COMPARITIVE ANALYSIS OF NBFCS AND BANKS
46
Since the calculated value of F=111.753 is greater than the tabulated value of F = 4.20,
hence null hypothesis is rejected.
 Bank Borrowings to Total Borrowings
Descriptives
BBTB
N Mean Std. Deviation Std. Error
95% Confidence Interval for Mean
MinimumLower Bound Upper Bound
Bank
15 .2830 .13393 .03458 .2088 .3571
.
07
NBFC
15 .3805 .30837 .07962 .2097 .5512
.
16
Total
30 .3317 .23880 .04360 .2425 .4209
.
07
ANOVA
BBTB
Sum of Squares df Mean Square F Sig.
Between Groups .071 1 .071 1.261 .271
Within Groups 1.582 28 .057
Total 1.654 29
It is evident that there is no significant difference between the performance Banks and Non-
bank financial companies in terms of Bank Borrowings to Total Borrowings.
As from Anova Table, it is clear that the Test Statistic: F = 1.261
COMPARITIVE ANALYSIS OF NBFCS AND BANKS
47
For v1 = 1 and v2 = 28 and for α = 0.05, the table value of F is F0.05 =4.20
Since the calculated value of F=1.261 is less than the tabulated value of F = 4.20, hence
null hypothesis is accepted.
 Debt by Equity Ratio
Descriptives
DE
N Mean Std. Deviation Std. Error
95% Confidence Interval for
Mean
MinimumLower Bound Upper Bound
Bank 15 132.7856 58.48476 15.10070 100.3979 165.1734 11.79
NBFC 15 90.1453 14.75270 3.80913 81.9756 98.3151 76.05
Total 30 111.4655 47.18635 8.61501 93.458 129.0852 11.79
ANOVA
DE
Sum of Squares df Mean Square F Sig.
Between Groups 13636.467 1 13636.467 7.496 .011
Within Groups 50933.535 28 1819.055
Total 64570.002 29
COMPARITIVE ANALYSIS OF NBFCS AND BANKS
48
It is evident that there is a significant difference between the performance Banks and Non-
bank financial companies which concludes performance of NBFCs is better than performance of
Banks in terms of Income by Asset Ratio.
As from Anova Table, it is clear that the Test Statistic: F = 7.496
For v1 = 1 and v2 = 28 and for α = 0.05, the table value of F is F0.05 =4.20
Since the calculated value of F=7.496 is greater than the tabulated value of F = 4.20, hence
null hypothesis is rejected
Liquidity Ratio
 Current Ratio
Descriptives
CR
N Mean Std. Deviation Std. Error
95% Confidence Interval for
Mean
MinimumLower Bound Upper Bound
Bank 15 1.3784 4.64870 1.20029 8.4156 13.5644 3.29
NBFC 15 10.9900 1.20307 .31063 .7122 2.0447 .17
Total 30 6.1842 5.9806 1.08048 3.9744 8.3940 .17
ANOVA
CR
Sum of Squares df Mean Square F Sig.
Between Groups 692.869 1 692.89 60.098 .000
Within Groups 322.809 28 11.529
Total 1015.679 29
COMPARITIVE ANALYSIS OF NBFCS AND BANKS
49
It is evident that there is a significant difference between the performance Banks and Non-
bank financial companies which concludes performance of NBFCs is better than performance of
Banks in terms of Current Ratio that is Current Assets by Current Liabilities.
As from Anova Table, it is clear Test Statistic: F = 60.098
For v1 = 1 and v2 = 28 and for α = 0.05, the table value of F is F0.05 =4.20
Since the calculated value of F=60.098 is greater than the tabulated value of F = 4.20, hence
null hypothesis is rejected.
COMPARITIVE ANALYSIS OF NBFCS AND BANKS
50
Chapter 6: Conclusion
Green = Profitability Ratios
Blue = Leverage Ratio
Grey = Liquidity Ratio
Indicators Non-Baking Finance
Companies
Scheduled Commercial Banks
Income to Asset Ratio
Operating Profit to Total
Assets
Profit After Tax to Net Worth
Total Profits to Profit Before
Tax
Profit After Tax to Total
Assets
Return on Net Worth
Profit Before Tax to Total
Income
Borrowings to Total Assets
Bank Borrowings to Total
Assets
Net Worth to Total Assets
Loans to Current Assets
COMPARITIVE ANALYSIS OF NBFCS AND BANKS
51
On comparing the performances of two major financial institutions that is Banks and
NBFC’s we understand that in profitability ratios, banks have an upper hand, On Leverage ratio
they stand equal and Liquidity ratio NBFCs perform better.
This comparative analysis on accounting ratios shows that there is not much significant
difference on the performance of both the institutes. The major difference between the two lies on
the Regulation body under which they operate, Banks under RBI regulations and NBFC’s under
Companies Act. There might be some difference on the area of interest for investment. They might
aim for different sectors and Investment Amount.
But, they both play an important role in the overall growth of the economy. Banks generally
finance Large institutions and Corporate while NBFC’s target for retail sector.
Rating is another key difference between banks and NBFCs. For example, the deposits of
NBFCs are rated, while the deposits of banks are not. The latter is considered as very safe, while
the former is not.
Since they both hold a key position in the financial system and as mentioned playing an
important role in the economic development by expanding their wings in the form of advancing
credit to almost all the sectors of the economy and various echelons of population it is extremely
essential that these financial institutions should be sustainable as their financial collapse may
possibly trigger uncontrollable financial cataclysm.
For Further research I would like to suggest that more financial ratios shall be considered
in context of Capital, Assets Under Management and Efficiency and for a longer period of time .
Bank Borrowings to Total
Assets
Bank Borrowings to Total
Borrowings
Debt Equity
Current Ratio
COMPARITIVE ANALYSIS OF NBFCS AND BANKS
52
References
Ahn, C. a. Kyes and Mujin-Financial Intermediaries in South Korea.
Ardener. The Evolution of an Informal Financial Institution.
Basu, S. Non- Banking Financial Intermediaries and Monetary Policy.
CMIE. Monthly Review of Indian Economy.
De, B. B. (2009). Study on NBFCs and Banks.
Greenspan. (2011). financial effectiveness of NBFCs.
Higuchi, S. a. (2000.). A Continuum of Informality of Credit: What Can Informal.
Joshi, M. (1999.). “Financial Intermediaries in India.
Kantawala, A. S. (1992.). Financial Performance of Non Banking Finance Companies.
Khan, D. A. (2009). Role of Banking Sector.
Kothari, D. A. (2010). Overall Household Debt-NBFCs role.
MachirajuH.R. (n.d.). Indian Financial System.
Manickavasagm, G. a. (2010). Risk Assesment Model for Assesing NBFC.
Menon, S. K.A.Schemes for starting Chitties under State Auspecies.
Nagarkar, J. Analysis of Financial Performance of Banks in India.
Reserve Bank Of India Bulletin .
Saggar, S. Financial Performance of Leasing Companies, During the Quinquennium Ending.
Santeshkumar, P. Non-Banking Financial Companies.
Simcox. Primitive Civilization or Outlines of the History of Ownership in Archaic.
Sinha, A. B. Non-Banking Financial Institutions of India- Their Onset, Growth and Performance of
Selected NBFCs.
V.Krishnan. (1995). Indigenous Banking in South India.
Vadde. (2011). Non-Banking Financial Companies-An Evaluation.
COMPARITIVE ANALYSIS OF NBFCS AND BANKS
53
Appendix
Paid up Capital for Banks and NBFC’s
Income for Banks and NBFC’s
0
12500
25000
37500
50000
1995-96 1997-98 1999-00 2001-02 2003-04 2005-06 2007-08 2009-10 2011-12
Paid up Capital (Crore)
NBFC'S Paid up Capital
 Banks
0
125000
250000
375000
500000
1995-96 1997-98 1999-00 2001-02 2003-04 2005-06 2007-08 2009-10
Income (Crore) for NBFC's TOTAL INCOME for Banks
COMPARITIVE ANALYSIS OF NBFCS AND BANKS
54
Accounting Ratio’s of NBFC’s
Years
Return
on Net
Worth
Tax
Provisi
on to
Profit
Operati
ng
Profits
to
Profits
after
Tax to
Net
Debt to
equity
Borrow
ingsto
total
assets
Bank
borrowi
ngsto
total
Current
Ratio
Total
Income
/Total
Assets
PBT/T
otal
Income
Loans
to
Current
Assets
PAT/N
et
Worth
PAT/T
otal
Assets
Bank
Borowi
ngs/To
tal
Net
worth
/Total
Assets
1995-96 11.9 0.126 4 0.119 76.05 0.386 0.244 0.749 0.143 28.06 0.271 4.164 3.496 0.094 0.839
1996-97 3.6 0.331 2.1 0.051 78.41 0.474 0.221 1.106 0.145 11.94 0.236 1.18 1.008 0.105 0.855
1997-98 5.2 0.331 2.1 0.052 79.38 0.689 0.167 1.153 0.153 13.86 0.284 1.664 1.414 0.115 0.85
1998-99 0.02 2.702 0.1 0.02 81.04 0.592 0.158 1.006 0.132 5.44 0.283 0.144 0.125 0.094 0.872
1999-00 6 0.368 2.6 0.06 82.4 0.575 0.189 1.033 0.13 4.036 0.302 0.421 0.372 0.109 0.883
2000-01 0.02 0.506 1.8 0.036 82.5 0.07 1.432 3.713 0.111 5.297 0.092 2.621 2.548 0.1 0.972
2001-02 2.9 0.785 0.4 0.6 86.9 0.912 0.227 0.75 0.098 21.72 0.511 2.007 1.662 0.207 0.828
2002-03 4.9 0.426 1.2 0.029 87.4 0.58 0.29 0.691 0.095 22.19 0.405 1.505 1.311 0.214 0.871
2003-04 7.4 0.337 1.9 0.049 98.4 0.65 0.294 0.605 0.096 30.45 0.475 2.295 2.055 0.247 0.895
2004-05 10.2 0.219 3.3 0.102 93.8 0.7 0.362 0.398 0.095 38.22 0.408 3.096 2.793 0.28 0.902
2005-06 13.2 0.189 5.3 0.132 81.5 0.76 0.426 3.17 0.119 54.25 0.37 5.927 5.412 0.396 0.913
2006-07 13.3 0.25 5.9 0.133 81.8 0.85 0.422 3.53 0.119 30.06 0.354 2.916 2.667 0.437 0.915
2007-08 9.5 0.263 4.6 0.095 105.6 0.9 0.432 2.374 0.108 45.41 0.745 3.979 3.564 0.489 0.896
2008-09 7.8 0.281 4 0.078 106.2 0.92 0.447 0.226 0.091 52.6 0.404 7.089 3.425 0.501 0.483
2009-10 7.2 0.283 3.4 0.072 130.8 0.95 0.396 0.174 0.122 23.97 0.305 7.234 1.959 0.539 0.271
COMPARITIVE ANALYSIS OF NBFCS AND BANKS
55
Accounting Ratios for Banks
Years
Return
onNet
Worth
Debt/
Equity
liabilit
ies/As
sets
Incom
e/Tota
l
Assets
Bank
borro
wings
to
total
borro
wings
Opera
ting
Profit/
total
Assets
Borrwi
ngsto
total
Assets
PBT/T
oatal
Incom
e
PAT/N
et
worth
PAT/T
otal
Assets
Tax/PBT
Bank
Borro
wings
/Total
Assets
Net
worth
/Total
Assets
Loans/
Assets
Opera
ting
Profits
to
Total
net
Assets
1995-96 5.71 57.848 18.14 0.35 0.3473 1.44 0.0523 0.0547 0.0569 0.0034 0.3621 0.0182 0.0605 0.4054 1.44
1996-97 1.27 11.791 16.15 0.008 0.4894 1.63 0.0726 0.025 0.0126 0.0008 0.718 0.0355 0.0603 0.4198 1.63
1997-98 8.29 73.739 14.74 0.54 0.2743 1.77 0.0379 0.0643 0.0821 0.0053 0.2726 0.0104 0.0641 0.4067 1.77
1998-99 12.01 111.82 12.47 0.8 0.2606 1.82 0.0353 0.092 0.1185 0.0079 0.1998 0.0092 0.0667 0.4044 1.82
1999-00 8.72 83.138 14.67 0.5 0.4121 1.48 0.0445 0.0647 0.0857 0.0049 0.271 0.0183 0.0577 0.3854 1.48
2000-01 12.22 117.83 12.13 0.69 0.4667 1.68 0.0427 0.0823 0.1196 0.0068 0.2071 0.0199 0.0566 0.3955 1.68
2001-02 10.22 100.35 15.03 0.54 0.4842 1.55 0.0442 0.0686 0.0998 0.0053 0.2442 0.0214 0.0529 0.4022 1.55
2002-03 13.96 141.95 8.12 0.78 0.3278 1.96 0.0702 0.0943 0.1364 0.0077 0.1745 0.023 0.0561 0.4167 1.96
2003-04 17.3 171.04 5.25 1.02 0.2586 2.39 0.0519 0.115 0.1692 0.01 0.1397 0.0134 0.0592 0.4321 2.39
2004-05 19.31 207.88 3.29 1.15 0.1692 2.67 0.0492 0.1381 0.1888 0.0113 0.1221 0.0083 0.0596 0.4345 2.67
2005-06 14.21 176.08 10.65 0.91 0.1405 2.16 0.0715 0.1289 0.1393 0.0089 0.1431 0.01 0.064 0.486 2.16
2006-07 14.51 184.38 13.37 0.94 0.16 2.08 0.0732 0.1291 0.1321 0.0087 0.1421 0.0117 0.066 0.5409 2.08
2007-08 15.24 192.58 10.64 0.98 0.212 2.09 0.0709 0.1296 0.14 0.0089 0.1328 0.015 0.0635 0.5689 2.09
2008-09 15.89 187 6 1.09 0.1671 2.13 0.0706 0.1316 0.135 0.0098 0.1209 0.0118 0.0728 0.5694 2.13
2009-10 15.37 174.35 4.2 1.1 0.0746 2.3 0.0902 0.1294 0.1426 0.01 0.1216 0.0067 0.0703 0.5686 2.3

More Related Content

What's hot

Research on the NBFC industry
Research on the NBFC industry Research on the NBFC industry
Research on the NBFC industry Nulaim Nuwaiz
 
Consumer behaviour towards co-op banks-project report
Consumer behaviour towards co-op banks-project reportConsumer behaviour towards co-op banks-project report
Consumer behaviour towards co-op banks-project reportAtul Gurav
 
Icici colg ppt
Icici colg pptIcici colg ppt
Icici colg pptTania goel
 
Report on HDFC bank by Ayushi Jain
Report on HDFC bank by Ayushi JainReport on HDFC bank by Ayushi Jain
Report on HDFC bank by Ayushi JainAyushi Jain
 
Study on Retail Banking Transformations in India - PNB
Study on Retail Banking Transformations in India - PNBStudy on Retail Banking Transformations in India - PNB
Study on Retail Banking Transformations in India - PNBRavi Panwar
 
Service quality hdfc bank at hdfc
Service quality hdfc bank at hdfcService quality hdfc bank at hdfc
Service quality hdfc bank at hdfcprikshit chauhan
 
PROJECT ON CONSUMER DURABLE LOANS IN BAJAJ FINANCE
PROJECT ON CONSUMER DURABLE LOANS IN BAJAJ FINANCEPROJECT ON CONSUMER DURABLE LOANS IN BAJAJ FINANCE
PROJECT ON CONSUMER DURABLE LOANS IN BAJAJ FINANCELast Channel Media
 
summer training project report on bajaj finserv
 summer training project report on bajaj finserv summer training project report on bajaj finserv
summer training project report on bajaj finservSiddharth Kumar Jha
 
Hdfc ppt mba.docx
Hdfc ppt mba.docxHdfc ppt mba.docx
Hdfc ppt mba.docxJagdish PAl
 
A Study On Comparative Analysis Of Banks Terms Of Service Quality Project
A Study On Comparative Analysis Of Banks Terms Of Service Quality ProjectA Study On Comparative Analysis Of Banks Terms Of Service Quality Project
A Study On Comparative Analysis Of Banks Terms Of Service Quality Projectmukesh Patidar
 
Comparative analysis of insurance market in india on hdfc-life-1-1
Comparative analysis of insurance market in india on hdfc-life-1-1Comparative analysis of insurance market in india on hdfc-life-1-1
Comparative analysis of insurance market in india on hdfc-life-1-1Flex
 
RESEARCH REPORT ON ICICI
RESEARCH REPORT ON ICICIRESEARCH REPORT ON ICICI
RESEARCH REPORT ON ICICIKushal Tomar
 
MBA HDFC bank Porject
 MBA HDFC bank Porject MBA HDFC bank Porject
MBA HDFC bank PorjectAchut B Roogi
 
A Study On Customer Satisfaction Towards HDFC Bank In Agra City
A Study On Customer Satisfaction Towards HDFC Bank In Agra CityA Study On Customer Satisfaction Towards HDFC Bank In Agra City
A Study On Customer Satisfaction Towards HDFC Bank In Agra CityRachitMudgal1
 
Comparative Study of Housing Loan of HDFC and ICICI Bank
Comparative Study of Housing Loan of HDFC and ICICI BankComparative Study of Housing Loan of HDFC and ICICI Bank
Comparative Study of Housing Loan of HDFC and ICICI BankIOSR Journals
 

What's hot (20)

Research on the NBFC industry
Research on the NBFC industry Research on the NBFC industry
Research on the NBFC industry
 
Consumer behaviour towards co-op banks-project report
Consumer behaviour towards co-op banks-project reportConsumer behaviour towards co-op banks-project report
Consumer behaviour towards co-op banks-project report
 
Icici colg ppt
Icici colg pptIcici colg ppt
Icici colg ppt
 
Report on HDFC bank by Ayushi Jain
Report on HDFC bank by Ayushi JainReport on HDFC bank by Ayushi Jain
Report on HDFC bank by Ayushi Jain
 
Study on Retail Banking Transformations in India - PNB
Study on Retail Banking Transformations in India - PNBStudy on Retail Banking Transformations in India - PNB
Study on Retail Banking Transformations in India - PNB
 
Service quality hdfc bank at hdfc
Service quality hdfc bank at hdfcService quality hdfc bank at hdfc
Service quality hdfc bank at hdfc
 
PROJECT ON CONSUMER DURABLE LOANS IN BAJAJ FINANCE
PROJECT ON CONSUMER DURABLE LOANS IN BAJAJ FINANCEPROJECT ON CONSUMER DURABLE LOANS IN BAJAJ FINANCE
PROJECT ON CONSUMER DURABLE LOANS IN BAJAJ FINANCE
 
summer training project report on bajaj finserv
 summer training project report on bajaj finserv summer training project report on bajaj finserv
summer training project report on bajaj finserv
 
HDFC bank project report
HDFC bank project reportHDFC bank project report
HDFC bank project report
 
Hdfc ppt mba.docx
Hdfc ppt mba.docxHdfc ppt mba.docx
Hdfc ppt mba.docx
 
A Study On Comparative Analysis Of Banks Terms Of Service Quality Project
A Study On Comparative Analysis Of Banks Terms Of Service Quality ProjectA Study On Comparative Analysis Of Banks Terms Of Service Quality Project
A Study On Comparative Analysis Of Banks Terms Of Service Quality Project
 
Comparative analysis of insurance market in india on hdfc-life-1-1
Comparative analysis of insurance market in india on hdfc-life-1-1Comparative analysis of insurance market in india on hdfc-life-1-1
Comparative analysis of insurance market in india on hdfc-life-1-1
 
RESEARCH REPORT ON ICICI
RESEARCH REPORT ON ICICIRESEARCH REPORT ON ICICI
RESEARCH REPORT ON ICICI
 
iifl
iifliifl
iifl
 
Icici bank
Icici bank Icici bank
Icici bank
 
MBA HDFC bank Porject
 MBA HDFC bank Porject MBA HDFC bank Porject
MBA HDFC bank Porject
 
HDFC BANK REPORT
HDFC BANK REPORTHDFC BANK REPORT
HDFC BANK REPORT
 
A Study On Customer Satisfaction Towards HDFC Bank In Agra City
A Study On Customer Satisfaction Towards HDFC Bank In Agra CityA Study On Customer Satisfaction Towards HDFC Bank In Agra City
A Study On Customer Satisfaction Towards HDFC Bank In Agra City
 
Axis Bank
Axis BankAxis Bank
Axis Bank
 
Comparative Study of Housing Loan of HDFC and ICICI Bank
Comparative Study of Housing Loan of HDFC and ICICI BankComparative Study of Housing Loan of HDFC and ICICI Bank
Comparative Study of Housing Loan of HDFC and ICICI Bank
 

Similar to NBFC and Banks

Indian financial system, short report
Indian financial system, short reportIndian financial system, short report
Indian financial system, short reportsaurabh surve
 
Compliance of Indian Banks to Basel III guidelines
Compliance of Indian Banks to Basel III guidelinesCompliance of Indian Banks to Basel III guidelines
Compliance of Indian Banks to Basel III guidelinesAmit Vishwakarma
 
Banking and NBFC - Module 4- NBFC Products Deposit Based.pptx
Banking and NBFC - Module 4- NBFC Products Deposit Based.pptxBanking and NBFC - Module 4- NBFC Products Deposit Based.pptx
Banking and NBFC - Module 4- NBFC Products Deposit Based.pptxnandhini299493
 
1928100581_ BBA_ LAXMI VERMA.pdf
1928100581_ BBA_ LAXMI VERMA.pdf1928100581_ BBA_ LAXMI VERMA.pdf
1928100581_ BBA_ LAXMI VERMA.pdfManishRathore83
 
1928100581_ BBA_ LAXMI VERMA.pdf
1928100581_ BBA_ LAXMI VERMA.pdf1928100581_ BBA_ LAXMI VERMA.pdf
1928100581_ BBA_ LAXMI VERMA.pdfManishRathore83
 
Fundamental Analysis - Banks
Fundamental Analysis - BanksFundamental Analysis - Banks
Fundamental Analysis - BanksLeslie Sequeira
 
Trend analysis of hdfc ltd.
Trend analysis of hdfc ltd.Trend analysis of hdfc ltd.
Trend analysis of hdfc ltd.Monika Kadam
 
ECONOMIC AND FINANCIAL ANALYSIS OF SBI AND BOB
ECONOMIC AND FINANCIAL ANALYSIS OF SBI AND BOB ECONOMIC AND FINANCIAL ANALYSIS OF SBI AND BOB
ECONOMIC AND FINANCIAL ANALYSIS OF SBI AND BOB Jeetu Matta
 
Reserve bank of india
Reserve bank of indiaReserve bank of india
Reserve bank of indiaAravind Raj
 
A Study on Emerging Challenges & Opportunities for Indian Banking Sector
A Study on Emerging Challenges & Opportunities for Indian Banking SectorA Study on Emerging Challenges & Opportunities for Indian Banking Sector
A Study on Emerging Challenges & Opportunities for Indian Banking Sectorinventionjournals
 
Jay davne 67 axis bank
Jay davne 67 axis bankJay davne 67 axis bank
Jay davne 67 axis bankKunalChalke1
 

Similar to NBFC and Banks (20)

wp1707.pdf
wp1707.pdfwp1707.pdf
wp1707.pdf
 
Indian financial system, short report
Indian financial system, short reportIndian financial system, short report
Indian financial system, short report
 
Final Report
Final ReportFinal Report
Final Report
 
Compliance of Indian Banks to Basel III guidelines
Compliance of Indian Banks to Basel III guidelinesCompliance of Indian Banks to Basel III guidelines
Compliance of Indian Banks to Basel III guidelines
 
Banking and NBFC - Module 4- NBFC Products Deposit Based.pptx
Banking and NBFC - Module 4- NBFC Products Deposit Based.pptxBanking and NBFC - Module 4- NBFC Products Deposit Based.pptx
Banking and NBFC - Module 4- NBFC Products Deposit Based.pptx
 
1928100581_ BBA_ LAXMI VERMA.pdf
1928100581_ BBA_ LAXMI VERMA.pdf1928100581_ BBA_ LAXMI VERMA.pdf
1928100581_ BBA_ LAXMI VERMA.pdf
 
1928100581_ BBA_ LAXMI VERMA.pdf
1928100581_ BBA_ LAXMI VERMA.pdf1928100581_ BBA_ LAXMI VERMA.pdf
1928100581_ BBA_ LAXMI VERMA.pdf
 
Fundamental Analysis
Fundamental Analysis Fundamental Analysis
Fundamental Analysis
 
Fundamental Analysis - Banks
Fundamental Analysis - BanksFundamental Analysis - Banks
Fundamental Analysis - Banks
 
Trend analysis of hdfc ltd.
Trend analysis of hdfc ltd.Trend analysis of hdfc ltd.
Trend analysis of hdfc ltd.
 
ECONOMIC AND FINANCIAL ANALYSIS OF SBI AND BOB
ECONOMIC AND FINANCIAL ANALYSIS OF SBI AND BOB ECONOMIC AND FINANCIAL ANALYSIS OF SBI AND BOB
ECONOMIC AND FINANCIAL ANALYSIS OF SBI AND BOB
 
Roja project 2
Roja project 2Roja project 2
Roja project 2
 
Reserve bank of india
Reserve bank of indiaReserve bank of india
Reserve bank of india
 
Project_Report_on_NBFC.pdf
Project_Report_on_NBFC.pdfProject_Report_on_NBFC.pdf
Project_Report_on_NBFC.pdf
 
Banking notes
Banking notesBanking notes
Banking notes
 
A Study on Emerging Challenges & Opportunities for Indian Banking Sector
A Study on Emerging Challenges & Opportunities for Indian Banking SectorA Study on Emerging Challenges & Opportunities for Indian Banking Sector
A Study on Emerging Challenges & Opportunities for Indian Banking Sector
 
A Study on Emerging Challenges & Opportunities for Indian Banking Sector
A Study on Emerging Challenges & Opportunities for Indian Banking SectorA Study on Emerging Challenges & Opportunities for Indian Banking Sector
A Study on Emerging Challenges & Opportunities for Indian Banking Sector
 
Ac 1 bank final
Ac 1 bank finalAc 1 bank final
Ac 1 bank final
 
Indian Financial System
Indian Financial SystemIndian Financial System
Indian Financial System
 
Jay davne 67 axis bank
Jay davne 67 axis bankJay davne 67 axis bank
Jay davne 67 axis bank
 

Recently uploaded

代办国外大学文凭《原版美国UCLA文凭证书》加州大学洛杉矶分校毕业证制作成绩单修改
代办国外大学文凭《原版美国UCLA文凭证书》加州大学洛杉矶分校毕业证制作成绩单修改代办国外大学文凭《原版美国UCLA文凭证书》加州大学洛杉矶分校毕业证制作成绩单修改
代办国外大学文凭《原版美国UCLA文凭证书》加州大学洛杉矶分校毕业证制作成绩单修改atducpo
 
Customer Service Analytics - Make Sense of All Your Data.pptx
Customer Service Analytics - Make Sense of All Your Data.pptxCustomer Service Analytics - Make Sense of All Your Data.pptx
Customer Service Analytics - Make Sense of All Your Data.pptxEmmanuel Dauda
 
Unveiling Insights: The Role of a Data Analyst
Unveiling Insights: The Role of a Data AnalystUnveiling Insights: The Role of a Data Analyst
Unveiling Insights: The Role of a Data AnalystSamantha Rae Coolbeth
 
Delhi Call Girls CP 9711199171 ☎✔👌✔ Whatsapp Hard And Sexy Vip Call
Delhi Call Girls CP 9711199171 ☎✔👌✔ Whatsapp Hard And Sexy Vip CallDelhi Call Girls CP 9711199171 ☎✔👌✔ Whatsapp Hard And Sexy Vip Call
Delhi Call Girls CP 9711199171 ☎✔👌✔ Whatsapp Hard And Sexy Vip Callshivangimorya083
 
VIP Call Girls Service Miyapur Hyderabad Call +91-8250192130
VIP Call Girls Service Miyapur Hyderabad Call +91-8250192130VIP Call Girls Service Miyapur Hyderabad Call +91-8250192130
VIP Call Girls Service Miyapur Hyderabad Call +91-8250192130Suhani Kapoor
 
Saket, (-DELHI )+91-9654467111-(=)CHEAP Call Girls in Escorts Service Saket C...
Saket, (-DELHI )+91-9654467111-(=)CHEAP Call Girls in Escorts Service Saket C...Saket, (-DELHI )+91-9654467111-(=)CHEAP Call Girls in Escorts Service Saket C...
Saket, (-DELHI )+91-9654467111-(=)CHEAP Call Girls in Escorts Service Saket C...Sapana Sha
 
VIP High Class Call Girls Jamshedpur Anushka 8250192130 Independent Escort Se...
VIP High Class Call Girls Jamshedpur Anushka 8250192130 Independent Escort Se...VIP High Class Call Girls Jamshedpur Anushka 8250192130 Independent Escort Se...
VIP High Class Call Girls Jamshedpur Anushka 8250192130 Independent Escort Se...Suhani Kapoor
 
Delhi Call Girls Punjabi Bagh 9711199171 ☎✔👌✔ Whatsapp Hard And Sexy Vip Call
Delhi Call Girls Punjabi Bagh 9711199171 ☎✔👌✔ Whatsapp Hard And Sexy Vip CallDelhi Call Girls Punjabi Bagh 9711199171 ☎✔👌✔ Whatsapp Hard And Sexy Vip Call
Delhi Call Girls Punjabi Bagh 9711199171 ☎✔👌✔ Whatsapp Hard And Sexy Vip Callshivangimorya083
 
FESE Capital Markets Fact Sheet 2024 Q1.pdf
FESE Capital Markets Fact Sheet 2024 Q1.pdfFESE Capital Markets Fact Sheet 2024 Q1.pdf
FESE Capital Markets Fact Sheet 2024 Q1.pdfMarinCaroMartnezBerg
 
Digi Khata Problem along complete plan.pptx
Digi Khata Problem along complete plan.pptxDigi Khata Problem along complete plan.pptx
Digi Khata Problem along complete plan.pptxTanveerAhmed817946
 
VIP High Profile Call Girls Amravati Aarushi 8250192130 Independent Escort Se...
VIP High Profile Call Girls Amravati Aarushi 8250192130 Independent Escort Se...VIP High Profile Call Girls Amravati Aarushi 8250192130 Independent Escort Se...
VIP High Profile Call Girls Amravati Aarushi 8250192130 Independent Escort Se...Suhani Kapoor
 
Market Analysis in the 5 Largest Economic Countries in Southeast Asia.pdf
Market Analysis in the 5 Largest Economic Countries in Southeast Asia.pdfMarket Analysis in the 5 Largest Economic Countries in Southeast Asia.pdf
Market Analysis in the 5 Largest Economic Countries in Southeast Asia.pdfRachmat Ramadhan H
 
定制英国白金汉大学毕业证(UCB毕业证书) 成绩单原版一比一
定制英国白金汉大学毕业证(UCB毕业证书)																			成绩单原版一比一定制英国白金汉大学毕业证(UCB毕业证书)																			成绩单原版一比一
定制英国白金汉大学毕业证(UCB毕业证书) 成绩单原版一比一ffjhghh
 
100-Concepts-of-AI by Anupama Kate .pptx
100-Concepts-of-AI by Anupama Kate .pptx100-Concepts-of-AI by Anupama Kate .pptx
100-Concepts-of-AI by Anupama Kate .pptxAnupama Kate
 
VIP Call Girls in Amravati Aarohi 8250192130 Independent Escort Service Amravati
VIP Call Girls in Amravati Aarohi 8250192130 Independent Escort Service AmravatiVIP Call Girls in Amravati Aarohi 8250192130 Independent Escort Service Amravati
VIP Call Girls in Amravati Aarohi 8250192130 Independent Escort Service AmravatiSuhani Kapoor
 
RA-11058_IRR-COMPRESS Do 198 series of 1998
RA-11058_IRR-COMPRESS Do 198 series of 1998RA-11058_IRR-COMPRESS Do 198 series of 1998
RA-11058_IRR-COMPRESS Do 198 series of 1998YohFuh
 
EMERCE - 2024 - AMSTERDAM - CROSS-PLATFORM TRACKING WITH GOOGLE ANALYTICS.pptx
EMERCE - 2024 - AMSTERDAM - CROSS-PLATFORM  TRACKING WITH GOOGLE ANALYTICS.pptxEMERCE - 2024 - AMSTERDAM - CROSS-PLATFORM  TRACKING WITH GOOGLE ANALYTICS.pptx
EMERCE - 2024 - AMSTERDAM - CROSS-PLATFORM TRACKING WITH GOOGLE ANALYTICS.pptxthyngster
 
Building on a FAIRly Strong Foundation to Connect Academic Research to Transl...
Building on a FAIRly Strong Foundation to Connect Academic Research to Transl...Building on a FAIRly Strong Foundation to Connect Academic Research to Transl...
Building on a FAIRly Strong Foundation to Connect Academic Research to Transl...Jack DiGiovanna
 
dokumen.tips_chapter-4-transient-heat-conduction-mehmet-kanoglu.ppt
dokumen.tips_chapter-4-transient-heat-conduction-mehmet-kanoglu.pptdokumen.tips_chapter-4-transient-heat-conduction-mehmet-kanoglu.ppt
dokumen.tips_chapter-4-transient-heat-conduction-mehmet-kanoglu.pptSonatrach
 

Recently uploaded (20)

代办国外大学文凭《原版美国UCLA文凭证书》加州大学洛杉矶分校毕业证制作成绩单修改
代办国外大学文凭《原版美国UCLA文凭证书》加州大学洛杉矶分校毕业证制作成绩单修改代办国外大学文凭《原版美国UCLA文凭证书》加州大学洛杉矶分校毕业证制作成绩单修改
代办国外大学文凭《原版美国UCLA文凭证书》加州大学洛杉矶分校毕业证制作成绩单修改
 
VIP Call Girls Service Charbagh { Lucknow Call Girls Service 9548273370 } Boo...
VIP Call Girls Service Charbagh { Lucknow Call Girls Service 9548273370 } Boo...VIP Call Girls Service Charbagh { Lucknow Call Girls Service 9548273370 } Boo...
VIP Call Girls Service Charbagh { Lucknow Call Girls Service 9548273370 } Boo...
 
Customer Service Analytics - Make Sense of All Your Data.pptx
Customer Service Analytics - Make Sense of All Your Data.pptxCustomer Service Analytics - Make Sense of All Your Data.pptx
Customer Service Analytics - Make Sense of All Your Data.pptx
 
Unveiling Insights: The Role of a Data Analyst
Unveiling Insights: The Role of a Data AnalystUnveiling Insights: The Role of a Data Analyst
Unveiling Insights: The Role of a Data Analyst
 
Delhi Call Girls CP 9711199171 ☎✔👌✔ Whatsapp Hard And Sexy Vip Call
Delhi Call Girls CP 9711199171 ☎✔👌✔ Whatsapp Hard And Sexy Vip CallDelhi Call Girls CP 9711199171 ☎✔👌✔ Whatsapp Hard And Sexy Vip Call
Delhi Call Girls CP 9711199171 ☎✔👌✔ Whatsapp Hard And Sexy Vip Call
 
VIP Call Girls Service Miyapur Hyderabad Call +91-8250192130
VIP Call Girls Service Miyapur Hyderabad Call +91-8250192130VIP Call Girls Service Miyapur Hyderabad Call +91-8250192130
VIP Call Girls Service Miyapur Hyderabad Call +91-8250192130
 
Saket, (-DELHI )+91-9654467111-(=)CHEAP Call Girls in Escorts Service Saket C...
Saket, (-DELHI )+91-9654467111-(=)CHEAP Call Girls in Escorts Service Saket C...Saket, (-DELHI )+91-9654467111-(=)CHEAP Call Girls in Escorts Service Saket C...
Saket, (-DELHI )+91-9654467111-(=)CHEAP Call Girls in Escorts Service Saket C...
 
VIP High Class Call Girls Jamshedpur Anushka 8250192130 Independent Escort Se...
VIP High Class Call Girls Jamshedpur Anushka 8250192130 Independent Escort Se...VIP High Class Call Girls Jamshedpur Anushka 8250192130 Independent Escort Se...
VIP High Class Call Girls Jamshedpur Anushka 8250192130 Independent Escort Se...
 
Delhi Call Girls Punjabi Bagh 9711199171 ☎✔👌✔ Whatsapp Hard And Sexy Vip Call
Delhi Call Girls Punjabi Bagh 9711199171 ☎✔👌✔ Whatsapp Hard And Sexy Vip CallDelhi Call Girls Punjabi Bagh 9711199171 ☎✔👌✔ Whatsapp Hard And Sexy Vip Call
Delhi Call Girls Punjabi Bagh 9711199171 ☎✔👌✔ Whatsapp Hard And Sexy Vip Call
 
FESE Capital Markets Fact Sheet 2024 Q1.pdf
FESE Capital Markets Fact Sheet 2024 Q1.pdfFESE Capital Markets Fact Sheet 2024 Q1.pdf
FESE Capital Markets Fact Sheet 2024 Q1.pdf
 
Digi Khata Problem along complete plan.pptx
Digi Khata Problem along complete plan.pptxDigi Khata Problem along complete plan.pptx
Digi Khata Problem along complete plan.pptx
 
VIP High Profile Call Girls Amravati Aarushi 8250192130 Independent Escort Se...
VIP High Profile Call Girls Amravati Aarushi 8250192130 Independent Escort Se...VIP High Profile Call Girls Amravati Aarushi 8250192130 Independent Escort Se...
VIP High Profile Call Girls Amravati Aarushi 8250192130 Independent Escort Se...
 
Market Analysis in the 5 Largest Economic Countries in Southeast Asia.pdf
Market Analysis in the 5 Largest Economic Countries in Southeast Asia.pdfMarket Analysis in the 5 Largest Economic Countries in Southeast Asia.pdf
Market Analysis in the 5 Largest Economic Countries in Southeast Asia.pdf
 
定制英国白金汉大学毕业证(UCB毕业证书) 成绩单原版一比一
定制英国白金汉大学毕业证(UCB毕业证书)																			成绩单原版一比一定制英国白金汉大学毕业证(UCB毕业证书)																			成绩单原版一比一
定制英国白金汉大学毕业证(UCB毕业证书) 成绩单原版一比一
 
100-Concepts-of-AI by Anupama Kate .pptx
100-Concepts-of-AI by Anupama Kate .pptx100-Concepts-of-AI by Anupama Kate .pptx
100-Concepts-of-AI by Anupama Kate .pptx
 
VIP Call Girls in Amravati Aarohi 8250192130 Independent Escort Service Amravati
VIP Call Girls in Amravati Aarohi 8250192130 Independent Escort Service AmravatiVIP Call Girls in Amravati Aarohi 8250192130 Independent Escort Service Amravati
VIP Call Girls in Amravati Aarohi 8250192130 Independent Escort Service Amravati
 
RA-11058_IRR-COMPRESS Do 198 series of 1998
RA-11058_IRR-COMPRESS Do 198 series of 1998RA-11058_IRR-COMPRESS Do 198 series of 1998
RA-11058_IRR-COMPRESS Do 198 series of 1998
 
EMERCE - 2024 - AMSTERDAM - CROSS-PLATFORM TRACKING WITH GOOGLE ANALYTICS.pptx
EMERCE - 2024 - AMSTERDAM - CROSS-PLATFORM  TRACKING WITH GOOGLE ANALYTICS.pptxEMERCE - 2024 - AMSTERDAM - CROSS-PLATFORM  TRACKING WITH GOOGLE ANALYTICS.pptx
EMERCE - 2024 - AMSTERDAM - CROSS-PLATFORM TRACKING WITH GOOGLE ANALYTICS.pptx
 
Building on a FAIRly Strong Foundation to Connect Academic Research to Transl...
Building on a FAIRly Strong Foundation to Connect Academic Research to Transl...Building on a FAIRly Strong Foundation to Connect Academic Research to Transl...
Building on a FAIRly Strong Foundation to Connect Academic Research to Transl...
 
dokumen.tips_chapter-4-transient-heat-conduction-mehmet-kanoglu.ppt
dokumen.tips_chapter-4-transient-heat-conduction-mehmet-kanoglu.pptdokumen.tips_chapter-4-transient-heat-conduction-mehmet-kanoglu.ppt
dokumen.tips_chapter-4-transient-heat-conduction-mehmet-kanoglu.ppt
 

NBFC and Banks

  • 1. COMPARITIVE ANALYSIS OF NBFCS AND BANKS i Acknowledgement I express my sincere thanks to my faculty guide, Dr. Ranjan Kumar Dash, Associate Professor, and my director Dr. Jyoti Chandiramani. for guiding me right from the inception till the successful completion of the report. I sincerely acknowledge them for extending their valuable guidance, support for literature, critical reviews of the report and above all the moral support that they had provided to me at all the stages of this report.
  • 2. COMPARITIVE ANALYSIS OF NBFCS AND BANKS ii Abstract Non-banking financial companies (NBFCs) constitute an integral component of the Indian Financial system. They play a significant role in nation building and financial inclusion by complementing the banking sector in reaching extending credit to the unbanked segments of the populace, particularly to the micro, small and medium enterprises (MSMEs), which champions the idea of entrepreneurship and innovation. It is essential to note that NBFCs in India have witnessed a substantial metamorphosis over the past some years and has come to be recognized as one of the systematically crucial element of the financial system. The Banking sector is also functioning in parallel to the NBFCs in financial front providing many other services which NBFCs are not able to offer. Banks has always been highly regulated, however simplified sanction procedures, flexibility and timeliness in meeting the credit needs and low cost operations resulted in the NBFCs getting an edge over banks in providing funding. Since they both hold a key position in the financial system and as mentioned playing an important role in the economic development by expanding their wings in the form of advancing credit to almost all the sectors of the economy and various echelons of population. It is extremely essential that these financial institutions should be sustainable as their financial collapse may possibly trigger uncontrollable financial cataclysm. The purpose of the study is to have financial comparative analysis of NBFCs and Banks as the significant institutions of our financial Economy. Similarly, this study is also conducted to comprehend the comparative growth potential of NBFCs and Banks in India. The main motive is to compare the performances on key financial parameters that is profitability, leverage and liquidity ratio
  • 3. COMPARITIVE ANALYSIS OF NBFCS AND BANKS iii Table of Contents Chapter 1: Introduction .............................................................................................................................1 1.1 Background:................................................................................................................................1 1.1.1 NBFCs: Banking in new areas?....................................................................................................2 1.1.2 Overview of Scheduled Commercial Banks......................................................................5 Significance of the Study ........................................................................................................................7 Objective of the Study..............................................................................................................................9 Data and Methodology ............................................................................................................................9 Hypothesis: ............................................................................................................................................10 Limitations of the study........................................................................................................................10 CHAPTER 2: Literature Review.............................................................................................................11 Theoretical framework...............................................................................................................................17 NBFCs Scenario in India..........................................................................................................................17 NBFCs' Strengths ....................................................................................................................................19 Performance of Scheduled commercial Banks...................................................................................21 Comparison Between Banks and NBFCs in India .............................................................................22 Purpose of the Study.............................................................................................................................25 Data ........................................................................................................................................................25 Methodology..........................................................................................................................................27 Hypothesis: ............................................................................................................................................27 Chapter 5: Analysis...................................................................................................................................31 Profitability Ratios................................................................................................................................31 Leverage Ratios:....................................................................................................................................40 Liquidity Ratio ......................................................................................................................................48 Chapter 6: Conclusion..............................................................................................................................50 References..................................................................................................................................................52 Appendix....................................................................................................................................................53
  • 4. COMPARITIVE ANALYSIS OF NBFCS AND BANKS iv List of figures Figure 1 Credit Growth of NBFCs as a % of Total Credit ..............................................................................3 Figure 2 Number of NBFCs..........................................................................................................................17 Figure 3 Credit and deposits Y-o-Y growth .................................................................................................22
  • 5. COMPARITIVE ANALYSIS OF NBFCS AND BANKS v List of Abbreviations Abbreviations Description NBFC Non-Banking Financial Companies AMC Asset Management Capital AUM Asset Under Management NPA Non-Performing Assets GNPA Gross Non-Performing Assets ALM Asset Liquidity Management PAT Profit After Tax SCB Scheduled Commercial Bank CRAR Capital to Risk weighted Asset Ratio PSB Public Sector Bank OOI Other Operating Income RBI Reserve Bank of India
  • 6. COMPARITIVE ANALYSIS OF NBFCS AND BANKS 1 Chapter 1: Introduction 1.1 Background: Banking in India in more contemporary terms was initiated in the late 18th century with Bank of Hindustan, 1770 and The General Bank of India, 1786. The oldest bank and the largest in operations and still operating still is the State Bank of India, which originated in the Bank of Calcutta in June 1806, which eventually became the Bank of Bengal. There were three presidency banks established under charters from the British East India Company: Bank of Bengal, Bank of Bombay and Bank of Madras. The three banks merged to form the Imperial Bank of India, which eventually, upon India's independence, became the State Bank of India in 1955. The presidency banks continued acting as quasi-central banks for years to come, as did their successors, until the Reserve Bank of India was established in 1935. (Santeshkumar)Reserve Bank of India took the initiative to bring Non-Banking Financial Companies in the economy which was included in Chapter 3B assigning limited authorities to Banks for the regulation of deposit taking companies. In January 1997, the economy witnessed drastic changes in 1934, in the Chapters 3-B, 3-C and 5 of the RBI Act with the vital motive to have a regulatory structure which were introduced to supervise the protection of interests of depositors while keeping in mind the effective functioning of NBFCs. Post the amendment of Act in 1997, the period witnessed the substantial growth of Non- Banking financial companies in the areas of operations, range of market products and instrument offers, sophistication of technology and many more. Furthermore, the paramount significance of NBFCs in broadening the financial sector of the country, generates vital interest of researchers and academicians to examine deep into the onset, growth, and performance Non-Banking Finance Institutions is a constituent of the institutional structure of the organized financial system in India are principally the source of providing funds for a particular activity. Providing or securing finance is an independent functionality of NBFCs resulting in Financial Management Services & Institutions. The Financial System of any country
  • 7. COMPARITIVE ANALYSIS OF NBFCS AND BANKS 2 consists of financial markets, intermediaries and financial instruments or products, which facilitate transfer of funds and are not always independently but in synergy. . 1.1.1 NBFCs: Banking in new areas? Banking in India have seen a lot of major developments in the past few years and NBFC have evidently made an impact on the current system and our persistently making shifts in becoming financial supermarkets. They are coming forth with an array of services focused all around the individual needs and have gradually extended their product portfolio to include asset management companies (AMCs), housing finance firms. In Spite of the growing competition from the established banks and other financial institutions the NBFCs' are extending their lines of business with a more permanent and serious stature. Lately the traditional boundaries between different categories of Financial intermediaries and institutions have vanished and thus, the NBFCs had to go head on with the banks to compete for marketspace. A Non-Banking Financial Company (NBFC) is a company registered under the Companies Act, 1956 engaged in the business of loans and advances, acquisition of shares/stocks/bonds/debentures/securities issued by Government or local authority or other marketable securities of a like nature, leasing, hire-purchase, insurance business, chit business but does not include any institution whose principal business is that of agriculture activity, industrial activity, purchase or sale of any goods (other than securities) or providing any services and sale/purchase/construction of immovable property. Non-Banking Financial Company (NBFC) in India made a humble beginning in the 1960 to serve the need of the saver and investor whose financial need were not adequately covered by the then existing banking system in India. Non-bank financial companies (NBFCs) are financial institutions that provide banking services without meeting the legal definition of a bank, and are typically restricted from taking deposits from the public under some cases but operations of these institutions are covered under countries banking regulations.
  • 8. COMPARITIVE ANALYSIS OF NBFCS AND BANKS 3 The initial phase did not see much traction pouring in for the NBFCs, but however, between 1980s and 1990s the NBFCs with their customer friendly policies and offerings started gaining recognition and acceptance. Some of NBFCs are also engaged in underwriting through subsidiary unit and by offering allied financial services including stock broking, investment banking, assets management and portfolio management. NBFCs have emerged as a substantial contributor to the economic growth by supplementing the effort of banks and other financial institutions The NBFCs began to invite fixed deposit from investor and work out leasing deal for big industrial firms. In the initial years they operated on a limited scale and were unable to make substantial impact on the financial system. However, with the passage of time, their contribution to the economy rose in leaps and bounds. Working capital loans were traditionally disbursed by banks and term lending by financial institutions. Now the stereotypes of these institutions has been radically changed and both moved into retail financing where NBFC had their forte for instance, in terms of financial assets, NBFCs have registered a robust growth, i.e. a compound annual growth rate (CAGR) of 19% past few years, comprising 13% of the total credit and estimated to touch approximately 18% by 2018-19 Figure 1 Credit Growth of NBFCs as a % of Total Credit Source: Reserve Bank of India 13.01% 14% 14.90% 15.90% 17.09% 18.20% 13.00% 14.40% 15.70% 17.30% 19.00% 20.90% 0.00% 5.00% 10.00% 15.00% 20.00% 25.00% 2015 2016 2017 2018E 2019E 2020E 7% CAGR 10% CAGR
  • 9. COMPARITIVE ANALYSIS OF NBFCS AND BANKS 4 NBFCs constitute a significant branch of the finance sector. They witnessed incredible progress during the 1980s and 1990s due to rigorous endeavors of the NBFCs across the globe. These developments also resulted into haziness of demarcating lines between banks and NBFCs with some privileges being reserved for the commercial banks. NBFCs are known for their higher risk absorption capacity than the banks. Despite being an institution of beguiling investors, they have played a crucial role in the financial system. Several specialized services like factoring, venture capital finance, and financing road transport were espoused by these institutions. The success of NBFCs can be assigned to their superior product lines, lower cost, broader and effective reach, sound risk management capabilities to check and control bad debts, and better comprehension of their customer segments. Not only they have displayed success in their conventional citadel, i.e. passenger and commercial vehicle finance but they have also managed to build significant Assets under Management (AUM) in the personal loan and housing finance sector which have been the major source of earnings for retail banks. The rise in urban demand and an enhancement in credit penetration has assisted and will continue to assist in driving the growth of consumer finance. Driven by higher disposable incomes through enhanced effectiveness of governance schemes, the consumer finance segment is going to witness more business activities. It is heartening to note that NBFCs improved their performance on majority of yardsticks during 2015-16, as the banking sector struggled under the weight of soaring non-performing assets (NPAs). According to the Financial Stability Report released by the Reserve Bank of India, NBFCs loans expanded 16.6% in 2015-16, twice as fast as the 8.8% credit growth across the banking industry on an aggregate level. The aggregate balance sheet of NBFCs expanded 15.5% in fiscal 2016 compared with 15.7% in the previous year. The gross non-performing assets (GNPA) ratio or the NBFC sector declined to 4.6% of total advances in March 2016 from 5.1% in September 2015, according to the Financial Stability Report. 1. Classification of NBFC Based on their Liability Structure, NBFCs have been divided into two categories. 1. Category ‘A’ companies (NBFCs accepting public deposits or NBFCs-D), and 2. Category ‘B’ companies (NBFCs not raising public deposits or NBFCs-ND).
  • 10. COMPARITIVE ANALYSIS OF NBFCS AND BANKS 5 NBFCs-D are subject to requirements of Capital adequacy, Liquid assets maintenance, Exposure norms (including restrictions on exposure to investments in land, building and unquoted shares), ALM discipline and reporting requirements; In contrast, until 2006 NBFCs-ND were subject to minimal regulation. Since April 1, 2007, non-deposit taking NBFCs with assets of `1 billion and above are being classified as Systemically Important Non-Deposit taking NBFCs (NBFCs-NDSI), and prudential regulations, such as capital adequacy requirements and exposure norms along with reporting requirements, have been made applicable to them. The asset liability management (ALM) reporting and disclosure norms have also been made applicable to them at different points of time. Depending upon their nature of activities, non- banking finance companies can be classified into the following categories: 1. Development finance institutions 2. Leasing companies 3. Investment companies 4. House finance companies 5. Venture capital companies 1.1.2 Overview of Scheduled Commercial Banks Commercial Banks are divided into two categories 1. Scheduled Commercial Banks (Public Sector) 2. Scheduled Commercial Banks (Private Banks) The scheduled commercial banks are those banks which are included in the second schedule of RBI Act 1934 and which carry out the normal business of banking such as accepting deposits, giving out loans and other banking services. Scheduled commercial banks can be further divided into four groups: Public Sector Banks: This includes SBI and associates, Nationalized Banks and other public Sector Banks; Private Sector Banks, Foreign Banks and Regional Rural Banks
  • 11. COMPARITIVE ANALYSIS OF NBFCS AND BANKS 6 Presently, there are 27 Public Sector Banks in India including SBI and also its five associates and 19 Nationalized Banks. Further, there are two Banks which have be categorized by RBI as “Other Public Sector Banks”. IDBI and Bhartiya Mahila Bank come under this category. SBI and Associates State Bank of India with its around 17,000 branches and around 200 foreign offices, is India’s largest banking and financial services company by assets. With over two lakh employees, SBI is banker to millions of Indians. This got birth in British Era when Bank of Calcutta, bank of Bombay and Bank of Madras merged into one entity and was called “Imperial Bank of India”. Then it got nationalized and was called as State Bank of India which is known as the Oldest Bank of the country. At present SBI has five associates which are State Bank of Bikaner and Jaipur, State Bank of Mysore, State Bank of Hyderabad, State Bank of Patiala and State Bank of Travancore. Apart from these there are 19 Nationalized Banks and two other Public Sector Banks. Scheduled Commercial Banks (Private Banks) In private sector banks, most of the capital is in private hands. There are two types of private sector banks in India that are Old Private Sector Banks and New Private Sector Banks. There are thirteen old private sector banks which were not nationalized at the time other banks were and are closely held by certain communities and their operations are mostly restricted to areas in and place of origin. Their Board of Directors mainly consists of personalities who are prominent and known in their local areas. Out of thirteen Old Private Sector Banks, Nainital Bank which is subsidiary of Bank of Baroda has the highest stake of 98.57% in it. Some other Old Private sector Banks have merged with other Banks. The New Private sector banks were incorporated as per the revised guidelines issued by the RBI regarding the entry of private sector banks in 1993.At present there are seven new private sector banks. Apart from these seven Banks, there are two banks which are yet to commence operation and have already obtained ‘in-principle’ licenses from RBI that are IDFC and Bandhan Bank of Bandhan Financial Services.
  • 12. COMPARITIVE ANALYSIS OF NBFCS AND BANKS 7 Foreign Banks These are the type of banks that are obligated to follow the rules of both home and foreign countries. As foreign branch Banks’ Loan limits are Based on the parent banks capital, so they provide more loans that the subsidiary Banks. There are 43 foreign banks from 26 countries which are operating as branches in India and 46 banks from 22 countries operating as representative offices in India. Most the foreign banks in India are the niche players which means their business is usually focused on trade finance, external commercial borrowings, wholesale lending etc. RBI policy towards the presence of foreign banks in India is based upon two cardinal principles that are reciprocity which means overseas bank are given national treatment only if their home country allows to open branches of Indian Banks there without much restrictions and single mode of presence in which RBI allows either of the Branch mode or wholly owned subsidiary mode in India. Regional Rural Banks Even after nationalization, there were commercial banks which were not able to lend to farmers due to cultural issues even under supervision of government regulation. Therefore, these type of banks were initiated in 1970 in order to protect the interest of farmers and rural people. Each Regional Rural Bank is owned by three entities with their respective share as 50% to Central Government, 15% to State Government and 35% to sponsor Bank and are regulated by NABARD. Significance of the Study According to the Economic Survey 2010-11, it has been reported that NBFCs as a whole account for 11.2 percent of assets of the total financial system. With the growing importance assigned to financial inclusion, NBFCs have come to be regarded as important financial intermediaries particularly for the small-scale and retail sectors. In the multi-tier financial system of India, importance of NBFCs in the Indian financial system is much discussed by various committees appointed by RBI in the past and RBI has been modifying its regulatory and supervising policies from time to time to keep pace with the changes in the system. NBFCs have turned out to be engines of growth and are integral part of the Indian financial system, enhancing
  • 13. COMPARITIVE ANALYSIS OF NBFCS AND BANKS 8 competition and diversification in the financial sector, spreading risks specifically at times of financial distress and have been increasingly recognized as complementary of banking system at competitive prices. In emerging economies like India, Non-Banking Financial Companies often play an important role because of their ability to (a) reach out to inaccessible areas; and (b) act as not just complements but also substitutes to banks when the banks are confronted with stricter regulatory constraints. Customers tend to find the non-banking entities convenient due to their quicker decision-making ability, prompt provision of services and expertise in niche segments. Apart from widening the ambit of and access to financial services, they also enhance the resilience of the financial system by acting as backup institutions when banks come under stress The Banking sector is also functioning in parallel to the NBFCs in financial front providing many other services which NBFCs are not able to offer. Banks has always been highly regulated, however simplified sanction procedures, flexibility and timeliness in meeting the credit needs and low cost operations resulted in the NBFCs getting an edge over banks in providing funding. The purpose of the study is to fill the research Gap of comparative analysis of NBFCs and Banks as the significant institutions of our financial Economy. The objective of the study is to comprehend the comparative growth potential of NBFCs and Banks in India. The main motive is to compare the performances on key financial parameters that is profitability, leverage and liquidity ratio. Both Non-Bank Financial Companies and Banks are not governed by the heterogeneous factors. Therefore, financial implication can differ for different set of services they provide. Moreover, a study by T.S. Harihar9 throws light on the performance of all NBFCs taken together in terms of cost of debt, operating margin, net profit margin, return on net worth, asset turnover ratio etc. The study by Seema Saggar does not reflect the overall performance of NBFCs as it is based on selected 10 companies. The study by Harihar reveals the aggregate performance of NBFCs which does not throw light in parallel to the financial performance of Banks. “Analysis of Financial Performance of Banks in India “by Jeevan Jayant Nagarkar has studied on financial performance of fifteen banks, five from each category that is Public, Private and Foreign banks; and depicted the results of Banking performance on the basis of fifteen Banks. In the light of these
  • 14. COMPARITIVE ANALYSIS OF NBFCS AND BANKS 9 limitations, the present thesis attempts to examine the financial performance of Non-Banking Financial Companies and Banks as in past years no such comparative research has been conducted. The present study attempts to examine the relative financial performance of NBFCs and Banks for the period 1995-2010 in terms of profitability, leverage and liquidity. The reasons of selecting this period for the purpose of study are: a) During this period the number of NBFCs have flourished by leaps and bounds. b) The absolute amount of deposits with NBFCs have gone up from Rs. 4956.6 crores to Rs. 85495.1 crores (increase is almost 17 times). c) The share of deposits with reporting NBFCs have gone up over a period of time from 4.78% to 16.49% (The share is as a percentage of total deposits of Reporting NBFCs Non-financial companies and scheduled commercial banks). Objective of the Study The Main Motive of the study is to examine the comparative performance of Scheduled Commercial Banks and Non-Banking Financial Companies in order to have clear picture of their contribution to the Financial Economy by evaluating their performances. The objective of this study is to comprehend the comparative growth potential of NBFCs and Banks and to compare their performances on the basis of key financial parameters that is profitability, leverage and liquidity ratios. Data and Methodology For the present study secondary data is collected from various issues of RBI Bulletin regarding Financial and Investment companies and for Banks it is collected from articles of Business of Commercial Banks in India of RBI. As mentioned above, the period covered in the study is of fifteen years from 1995 to 2005. The study presents an analysis of the performance of Non-Government Non-Banking Financial and Investment (excluding insurance and banking companies) for fifteen-year period. The data for 282 Scheduled Commercial Banks for fifteen-year period is collected from Annual Balance sheet of Banks.
  • 15. COMPARITIVE ANALYSIS OF NBFCS AND BANKS 10 For the purpose of analysis, various ratios of profitability, leverage and liquidity, average of fifteen years’ ratio i.e. 1995 to 2000 is found for Scheduled Commercial Banks and Non Baking Financial Companies separately. Further, to analyze if there is a significant difference between the performance of NBFCs and Scheduled Commercial Banks, Analysis of Variance (ANOVA) is applied on each ratio. This statistical tool will assist in gauging the financial performance of NBFCs and Scheduled Commercial Banks which have been selected for the study for fifteen-year period. Hypothesis: To analyze the comparative performance of Banking Sector and NBFCs, we will take hypothesis as H0: There is no significant difference between the performance of Banks and Non-bank financial companies. H1: There is a significant difference between the performance Banks and Non-bank financial companies. Limitations of the study 1. The research study is based on secondary data. 2. There may be other statistical and financial tools also to judge the sustainability and performance of NBFCs and Banks but in this research paper only the above mentioned statistical and financial tools have been used. Hence, the conclusions drawn may not reveal the complete picture of NBFCs and Banks as far as their sustainability is concerned. 3. Due to unavailability of data, only fifteen years’ period that is from 1995 to 2000 is considered. Hence, conclusions derived pertaining to comparative Analysis of Non-Banking Financial Company and Scheduled Commercial Banks in India may not reflect the complete scenario of their financial performance.
  • 16. COMPARITIVE ANALYSIS OF NBFCS AND BANKS 11 CHAPTER 2: Literature Review Buddhosev Sinha, has discussed about the current scenario the Non-Banking Financial Companies which have added overall depth to the financial sector and perceived vital significance in the developing economy. It has highlighted the growth pattern of the non-banking financial companies and their classification based on the services they provide. To evaluate the financial performance of selected NBFCs , three ratios are calculated that are a) Net Sales / Net Revenue from Operations; b) Profit / Loss Before Tax and c) Profit After Tax / Profit or Loss for the period and then F test is applied for the further analysis. It is rightly said that for driving the country’s economy to the modern era , it is required to have proper functioning of financial system (Kroszner, 2010) . In every advanced economy, efficient financial structure delivers the variety of financial services and others instruments and act as significant base in contribution to stability of macroeconomic front and sustained growth of the economy. Moreover, in the developed financial structure, there is a mobilization of savings which offers investors and savers a wider choice of instruments and with emergence of the Non-Banking Financial Companies in the financial system, the investors could now make effective choices by parking their funds at more lucrative instrument in comparison to the deposits of banks. In the favor of NBFCs, Greenspan (1999) quoted ‘enhance the resilience of the financial system to economic shocks by providing it with an effective ‘‘spare tyre’’ in times of need’ While the need of short term loans by particular industries and agriculture are fulfilled by banks, the other forms of services and instruments which are require by industries and different segments of the economy are offered by the Non-Banking Financial Companies. S. Kantwala attempts to analyse the financial performance of different categories of NBFCs in terms of profitability, leverage and liquidity ratios for the period 1985-86 and 1994-95. The author has selected this period because of the immense growth of Non-Banking Financial Companies and their absolute amount of deposits which grew by 17 times from 4956.6 crores to Rs.85495.1 crores. The paper has also discussed about the groups for which the maximum number of ratios are similar. To examine, if these ratios differ significantly between the various categories of NBFCs that are Trading in shares and investment holdings (TS+IH), Hire purchase finance (HP), loan finance (LF) and d) leasing (L), one-way Analysis of Variance (ANOVA) is applied. It
  • 17. COMPARITIVE ANALYSIS OF NBFCS AND BANKS 12 was concluded that there is a significant difference in the three ratios mentioned of the various categories of NBFCs. In the The Sustainability Dimension: A Study of Selected NBFCs published by The institute of Company Secretaries of India, the paper has considered selected NBFCs which are listed in BSE and creating their strong impact in terms of performance based on key parameters that is Reported Net Profit After Tax (PAT), Earnings Before Interest and Tax (EBIT), Loans and Advances. The paper is made to ascertain that if there is a significant difference or not between the selected NBFCs based on PAT and EBIT. Furthermore, growth potential of loans and advances of Non-Banking Financial Companies is also examined. To analyze the sustainability of selected Non-Banking Financial Companies, Business valuation method was applied. Gumparthi and Manickavasagam (2010) studied on Risk Assessment Model for Assessing NBFC (Manickavasagm, 2010) (Asset Financing) Customers’. The main motive of this paper is create a Risk Assessment Model for NBFCs which is based on Market forces and also studied 28 parameters to measure the risk related to customer identification out of which 12 parameters proves to be the significant ones. Vadde (2011) studied on performance of Non-Banking Financial Companies in India and its evaluation by examining the financial structure of non-government financial and investment companies for the period April 2008 to March 2009 based of Annual Accounts of 12115 Non- Banking Financial Companies. The data for the study is secondary collected from various issues of RBI Bulletin. The study concluded that income and expenditure growth decelerated during the period but this deceleration was more observed in income growth. Sornaganesh and NavisSoris (2013) investigated on the topic, “A Fundamental Analysis of NBFC in India” to analyse the profitability position of 5 sample NBFC companies, such as, STF, SF, BF, and M&MF for the period from April 2008 to March 2012, using Ratio Analysis of collecting data from the Annual Reports and Balance Sheets of the sample companies. The study revealed that SF has performed better in terms of Earnings Per Share (EPS) followed by STF, BF, CF & M&MF but STF and M&MF were found to be far better than other in NPM (Net Profit Margin).
  • 18. COMPARITIVE ANALYSIS OF NBFCS AND BANKS 13 Perumal and Santheskumar (2013) studied on the topic “Non-Banking Financial Companies” analysing the Balance Sheets and Income Statements of two sample companies, i.e., Sundaram Finance Limited and Lakshmi General Finance Limited for the period 2007-2012 using primary and secondary data. The study was conducted using various statistical tools like, average, standard deviation, co-efficient of variation, trend analysis, index number etc. and concluded that the contribution of NBFCs to economic development is highly significant and there is need to integrate it with the mainstream financial system and RBI should be vested with more power to monitor NBFCs in an effective manner. Kaur and Tanghi (2013) investigated on the topic “Non-Banking Financial Companies, Role and Future Prospects” with a focus to analyse role and importance of NBFCs in India. The paper concluded that NBFCs have to concentrate more on their core strengths and must constantly endeavor to hunt for new products and services in order to survive and grow constantly. Arun Kumar (2014) has made an attempt on the topic “Non-Banking Financial Companies: A Review” and after observing twelve studies of different authors he concluded that due to the regulations of the Reserve Bank of India, still the NBFCs are not foraying into more credit and suggested in the NBFC credit policy for reduction of interest rates. The study observed a research gap which is, evaluation of performance of NBFCs in India. Arora and Kaur (2006) stated that banking sector in India has given a positive and encouraging response to the financial sector reforms. Entry of new private banks and foreign banks has shaken up public sector banks to competition. Changing financial scenario has opened up opportunities for the banks to expand their global presence through self-expansion, strategic alliances, etc. Banks are diverting their focus on retail banking so as to attain access to low-cost funds and to expand into relatively untapped potential growth area. The Travancore Banking Enquiry Commission and Travancore Companies Act (1938) recommended that the banks in the state were prohibited from conducting kuri business. But after Independence following the extension of the Indian Companies Act (1913) to Travancore State, the position changed and banks restarted the kuri business with effect from 1st April 1951.
  • 19. COMPARITIVE ANALYSIS OF NBFCS AND BANKS 14 Banking Companies Act (1949) regarded kuries as an agency business which banks could take up and therefore, chit fund business re-emerged as an essential segment of the operations of several banks in South India. William Logan (1951) mentioned the presence of a flourishing Kuri or lottery system existing in the society. He also described the operation of kuri system among friends known as ‘Changaathi Kuri’. According to S.K.Basu (1961) A Non-Banking Financial Company (NBFC) is a company incorporated under the companies Act, 1956, and conducting the financial business as its principal business. In India, the Non-Banking Financial sector comprises a multiplicity of institutions, which are defined under section 45 I (a) of the Reserve Bank of India Act, 1934. According to R.G. Saraiya (1974) the annual savings mobilization through chit funds is in multiples of 100 crores Though these savings are less comparing with commercial banks, the number of people benefited by chit funds is quite large. He has brought forth the recommendations of the Banking Commission, which has recommended that the State Governments may consider Starting Chit Funds at strategic places as model foremen with the object of offering effective competition to private chit funds and thus acting as a disciplining factor. Nayar (1986) pointed out that Chit Funds have come to stay as a unique non-banking financial intermediary in India especially in South India. He also pointed out that the rationale of an auction Chitty or Business Chitty is that the borrowers and lenders meet to fix the rate of interest and since there is more than one borrower competing for the same amount, a competitive rate of interest is offered. Only the members enjoy the benefits of the scheme. The study highlighted the fact that for the subscribers, the return on subscriptions was not the only consideration. The possibility of getting a lump-sum on easy terms at short notice was a great inducement. Hence, it is advisable to retain these within the frame work of non-banking financial institutions controlled under chit funds act 1982, by the state government. The RBI reports in Trend and Progress of Banking in India (2008) indicates that even after the four decades of banks’ nationalization, country’s 41 per cent adult population remained outside the banking system but is surmised to be covered by the NBFCs wise Chit Funds’.
  • 20. COMPARITIVE ANALYSIS OF NBFCS AND BANKS 15 Ali Akhan (2009) stated that the Non-Banking Financial Companies (NBFCs) have been playing a very significant role in the present day rigorous money-market conditions. They are serving the nation by supporting the economic reconstruction and giving a booster to industrial production. They are engaged into the business of providing loans and advances of small amounts for a short-period to small borrowers. The Non-Banking Financial Companies (NBFCs) play an important role in channelizing these savings into investment. They have supplemented the role played by the banks. According to Bala Bharathi and Sanjoy De (2009) NBFCs are financial entities that provide banking services without meeting the legal definition of a bank. They are typically not allowed to take deposits from general public and hence have to seek other means of funding. These NBFCs have matured a lot and even withstood the recent deadly crisis with a lot of resilience. NBFCs can reach the unorganized segments of society with their ability to provide innovative financial services. These entities play a critical role in disbursing credit to the rural sector, thus preventing the concentration of credit risk in banks. In urban areas too, NBFCs focus on non- salaried individuals, traders, transporters and stock brokers who are neglected by banks. Dr.Amrit Patel and Dr.Gopal Kalkoti (2010) mentioned that according to RBI, the major reason for increase in overall household debt and increase in the share of rural household indebtedness to non-institutional sources was a significant increase in the current farm expenditure and household expenditure for which households found it difficult to obtain loans from banks. In addition to that the cumbersome procedure of submitting various documents with loan applications and documentation process led to an average of 33 weeks taken by commercial banks to approve loans. And this scenario is the niche forchit fund like entities under the banner of NBFCs. Dr. Jatinder Kaur (2010) reveals that, despite the phenomenal growth of banking sector, the extent of rural indebtedness in India has been on a continuous rise. About one-third of the rural credit requirements are still met by non-institutional sources, like moneylenders. The favoring factor of moneylenders is that banks will not sanction loans for consumption purposes and default of repayment of previous loan makes it ineligible for further assistance from banks.
  • 21. COMPARITIVE ANALYSIS OF NBFCS AND BANKS 16 Usha Thorat (2010) states that non-banking entities can be either non-banking non- financial entities or non-banking financial entities. In case of non-banking financial entities, there mare deposit taking and non-deposit taking financial companies is there. Considering the difficulties in ensuring the effective supervision of large number of small deposit-taking entities, fresh approvals to NBFCs for accepting deposits are not considered.
  • 22. COMPARITIVE ANALYSIS OF NBFCS AND BANKS 17 CHAPTER 3: Theoretical framework NBFCs Scenario in India Indian Economy has a huge hidden credit demand stoked by a huge self-Employed population that is underserved by banks due to insufficient income proof. With public sector banks under As of March 2016, there were 11,682 non-banking financial companies (NBFCs) registered with the Reserve Bank of India, of which 202 were deposit-accepting (NBFCs D) and 11,480 were non-deposit-accepting NBFCs (NBFCs- ND). There were 220 systematically important non- deposit accepting NBFCs (NBFCs-ND-SI). All NBFCs-D and NBFCs-ND-SI are subject to prudential regulations like capital adequacy requirements and provisioning norms along with reporting requirements. As far as financial performance is concerned the aggregated balance sheet of the NBFC sector expanded by 15.5 percent on a y-o-y basis in March 2016 in comparison to 15.7 percent in 2015. Loans and advances enhanced by 16.6 percent, while, total borrowings increased by 15.3 percent in March 2016. Figure 2 Number of NBFCs Source: Reserve Bank of India 11200 11400 11600 11800 12000 12200 12400 FY 2013 FY 2014 FY 2015 FY 2016 FY 2017
  • 23. COMPARITIVE ANALYSIS OF NBFCS AND BANKS 18 It is quite interesting to note that the financial performance of NBFC sector has remained constant for the last two years. Net profit as a percentage of total income remained at 18.3 percent between March 2015 and March 2016 and ROA stood at 2.2 percent during the same period. ROE enhanced to 10.6 percent from 10.3 percent While the regulatory norms for the NBFC sector are sought to be brought closer to those applicable to schedule commercial banks, the performance of this sector (ROE and ROA) seems to be much better as compared to that of banks. GNPAs of the NBFC sector as a percentage of total advances reduced to 4.6 percent in March 2016 from 5.1 percent in September 2015. NPAs as a percentage of total advances also fell to 2.5 percent from 2.9 percent during the same period. Stress test on credit risk for the NBFC sector as a whole for the period ended March 2016 was conducted under three situations: a) GNPA increase by 0.5 SD, b) GNPA increase by 1 SD and c) GNPA increase by 3 SD. The results indicate that in the first and second scenarios, the CRAR of the sector was marginally affected while in the third scenario, it reduced to 23.3 percent from 24.3 percent. This however, was much above the regulatory minimum needed level of 15 percent. With public sector banks under severe stress due to soaring non-performing assets, the appetite to lend is expected to be weak in the medium term till a proper resolution is found. Consequently, it will result into yawning of gap in the market which will create immense opportunities for NBFCs. Further, the recent developments in deepening of wholesale debt markets also bode well for liquidity and funding of NBFCs. Looking into the operational angle of NBFCs, they operate at higher yields as majority of them operate in underserved markets. Despite the cost of funds disadvantage, they operate at higher NIM (Net Interest Margin). Their operational costs and bad debt expenditure is lower as compared to banks resulting into much higher Return on Assets (ROA). Even being at a lower leverage in comparison to banks, NBFCs deliver higher ROE. This became a reality on account of extremely focused business model designed around a product, i.e. customer segment. This approach has assisted the NBFCs to function with better response times and service levels, resulting into faster growth as compared to banks. Despite, such prodigious growth and impressive story of NBFCs, a blizzard also exist, i.e. nearly 200 non-banking financial companies (NBFCs) are facing the threat of closure due to non- adherence to Reserve Bank of India's mandated requirement of minimum investment grade credit
  • 24. COMPARITIVE ANALYSIS OF NBFCS AND BANKS 19 rating to accept deposits. These NBFCs comprise mostly of localized small-time lenders who have knocked the doors of the regulator seeking relaxation in rating norms, citing the reason that they are being treated in the same way like a big NBFC is treated. Going by the Financial Stability Report, December 2016 and the Report of Trend and Progress of Banking in India, 2015-16, published by RBI, the picture appears to be gloomy. The number of NBFCs in 2013 stood at 12225 which declined to 11555 by H1 FY 2017 (please refer exhibit 4). Another worrying scenario of NBFCs is regarding GNPA (Gross Non-Performing Assets). During the first half of FY16-17, the NBFCs reported GNPA of 4.9% which was 4.6% at the end of FY15- 16. A non-linearity in GNPA and NNPA of NBFCs can be observed during the period March 2013 to September 2016. In case of GNPA it was 3.6% in March 2013 which rose to the highest at 5.1% for two years, i.e. September 2014 and September 2015. The scenario improved a little in March 2016, as GNPA was registered at 4.6% but the situation aggravated in September 2016, as GNPA stood at 4.9%. On the other hand, NNPA was at its lowest in March 2013, i.e. 1.6% which after witnessing ups and downs touched 2.7% in September 2016. In case of NNPA also, the situation has worsened. Even comparing the NNPAs of March 2016- 2.5% and September 2016- 2.7%, i.e. a rise of 0.2% can be observed (please refer exhibit 5). The deterioration in the asset quality of NBFCs can be attributed to the interconnectedness of the NBFC sector with the banking sector and appalling performance of the banking sector in terms of asset quality. But the silver lining is that despite the mentioned bottlenecks, NBFCs are gradually making their way into balance sheet of companies, particularly those in the small and medium size category and in the real estate business irrespective of size. Reserve Bank of India formulated a new category of NBFCs as NBFC-account aggregators (AAs) in September 2016 aimed at facilitating a consolidated view of individual investors' financial asset holdings, especially when the entities fall under the purview of different financial sector regulators. NBFCs' Strengths NBFCs have their competitive advantage over banks by their ability to contain risk, adapt to dynamic market changes and tap demand in markets ay an individual level which results in making them successful over bigger institutions.
  • 25. COMPARITIVE ANALYSIS OF NBFCS AND BANKS 20 Risk assessment is the most crucial factor in the financial sector. NBFC cater to the relatively riskier category and most of them found way at containing risks. In the late 1990 during the market slowdown, the NPAs increased sharply in the portfolio of banks and financial institutions. Top-rung NBFCs managed to hold on better risk profile than banks by keeping Lower proportion of loans to corporate and a more effective recovery mechanism. The corporate loans which are usually of higher amount means that a single default has a bigger impact. NBFCs that were into commercial lending were perhaps facilitating low proportion of loan to each customer vis-a-vis the total disbursement which in case of a default would have limited impact. The small size of the loans coupled with a better collection mechanism resulted in effective risk containment by the NBFCs. This was further aided by the greater flexibility of the NBFC structure, which also enables the NBFCs to act with dispatch when they sense an opportunity. The BFCs also have an edge in accessing fixed deposits which gives them access to the database and leverage on the same. Lack of reliable data has often tripped big names in the corporate world. The top NBFCs have adapted themselves for the dynamically changing. The top-rung NBFCs have equipped themselves for the fast-changing environment where all intermediaries are competing for retail finance. An outcome of the increased competition is that profit margins of the NBFCs will decline. Moreover, with a huge resources committed to such areas as insurance, which may take years to attain profitability, profit levels are unlikely to be as high as they were. Last year, the share price of quite a few NBFCs rose sharply only to fall rapidly. Share prices are unlikely to witness any significant, sustained rise this year in the light of the low premium the stock market attaches to financial services, in general, and especially with the prospect of a decline in returns on investment in the near term. Investors with exposures in such top-rung NBFCs as Sundaram Finance, Tata Finance or Kotak Mahindra may stay invested as there are possibilities of moderate gains in the medium term. However, fresh exposures may be avoided.
  • 26. COMPARITIVE ANALYSIS OF NBFCS AND BANKS 21 Performance of Scheduled commercial Banks The credit growth of Scheduled Commercial Banks declined on y-o-y basis, across the bank-groups, whereas, deposit growth increased between September 2016 and March 2017. SCBs’ capital to risk-weighted assets ratio (CRAR) improved from 13.4 per cent to 13.6 per cent between September 2016 and March 2017. However, the Tier-1 leverage ratio at the system level declined marginally during the same period. SCBs’ annual profit after tax (PAT) expanded by 48.0 per cent in 2016-17 as against a decline of 61.6 per cent in 2015-16, mainly due to higher increase in other operating income (OOI) and lower rise in risk provisions. However, public sector banks (PSBs) once again recorded negative returns on their assets. The share of OOI in total operating income increased sharply from 30.7 per cent in 2015-16 to 36.2 per cent in 2016-17, mostly contributed by profit on securities trading. Continuing deceleration in the growth of assets of SCBs along with deterioration in their asset quality resulted in a secular decline in the share of net interest income (NII) in total operating incomeThe gross non-performing advances (GNPAs) ratio of SCBs rose from 9.2 per cent in September 2016 to 9.6 per cent in March 2017. The net nonperforming advances (NNPAs) ratio of SCBs increased marginally from 5.4 per cent in September 2016 to 5.5 per cent in March 2017. The stressed advances7 ratio declined from 12.3 per cent to 12.0 per cent due to fall in restructured standard advances. While there is a fall in stressed advances ratio in agriculture, services and retail sectors, the stressed advances ratio in industry sector, however, rose from 22.3 per cent to 23.0 per cent mainly on account of subsectors such as cement, vehicle, mining & quarrying and basic metals. Accretion of new NPAs from restructured standard advances declined in 2016-17
  • 27. COMPARITIVE ANALYSIS OF NBFCS AND BANKS 22 Figure 3 Credit and deposits Y-o-Y growth SOURCE: Reserve Bank of India Large borrowers account for 56 per cent of gross advances and 86.5 per cent of GNPAs of SCBs, whereas, top 100 large exposures account for 15.2 per cent of gross advances. Non- performing accounts within top 100 exposures contribute to 25.6 per cent of GNPAs of SCBs. While the level of GNPAs of large borrowers increased between September 2016 and March 2017, their restructured standard advances declined during the same period resulting in reduction of total stressed advances by 1.8 per cent. Comparison Between Banks and NBFCs in India A) Incorporation: The regulatory Bodies are determined by the Act under which each of these financial institutions is set up. It is important to know under whose purview these institutions fall in case of any irregularities or legal problem. Banks are incorporated under the Banking Regulation Act, 1949 whereas NBFCs are incorporated under the Companies Act 1956. B) Services Provided Majority of the services are the same, but the major points of difference in services make these two entities significantly unique 1. Demand Deposits: We can withdraw our deposits from Banks on demand but this facility is not available with NBFCs.
  • 28. COMPARITIVE ANALYSIS OF NBFCS AND BANKS 23 2. Payment and settlement system: This system involves transfers from one financial institution to another. While the banks are an integral part of this economic system, Non-Banking Financial Companies are not. 3. Deposit Insurance- Varying as per Banks, deposits of the common public are insured up to a certain value with the banks. This makes Banks more dependable. Deposits with the NBFCs are not insured. C) Foreign Investment: Foreign Investment up to 100 % is permitted in case of a NBFC but this limit is earmarked at 74% for Private Banks. D) Fixed Deposits: Both NBFCs and Banks accept fixed deposits. Yet, there is a difference between the two. Fixed Deposits of Non-Banking Financial Companies are generally rated by the rating agencies in the country. While, the Fixed Deposits of Banks are not rated by rating agencies. If NBFCs default on its payment, you would lose your principal and insurance amount, which is why it is not recommendable to go for highly rated safe fixed deposits. Also, Non-Banking Financial Companies tend to offer higher interest rates compared to Banks. E) Maintenance of Reserve Ratio: It is mandatory for banks, both Private and Public to maintain the interest rates that RBI dictates as per the Banking Regulation Act, 1949 but NBFCs are not under such an obligation as they are registered under Companies Act 1956. F) Transaction Services: These are services which are carried out for money transfer, typically for corporates by the Banks. It includes commercial banking products, domestic and cross border payments and professional risk mitigation for international trade. These type of services are provided by banks but not by NBFCs. G) Lending: Banks tends to target corporates as well as retailers. While, NBFCs generally targets for retail sectors but not usually to big power projects. For instance, they would rather go for vehicle finance, consumer loans etc. Also banks, offers different types of credit cards according to the needs of customer. On the other hand, Non Baking Financial Companies do not offer such services. F) Rating: Deposits of NBFCs are rated, while the deposits of banks are not and deposits of banks are considered safe, while deposit of NBFCs are not considered same. Also, deposits of NBFCs
  • 29. COMPARITIVE ANALYSIS OF NBFCS AND BANKS 24 are not guaranteed while that of banks are. Ratings of Non-Banking Finance Companies are usually check before investment. In general, AAA rated are considered safe as it ensures timely payments of interest and principal amount.
  • 30. COMPARITIVE ANALYSIS OF NBFCS AND BANKS 25 CHAPTER 4: Research and Procedure Purpose of the Study The Purpose of the study is to examine the comparative performance of Banking sector and Non-Banking Financial Companies in order to have a clear picture of their contribution to the Financial Economy. Since they both hold a key position in the financial system and as mentioned playing an important role in the economic development by expanding their wings in the form of advancing credit to almost all the sectors of the economy and various echelons of population it is extremely essential that these financial institutions should be sustainable as their financial collapse may possibly trigger uncontrollable financial cataclysm. The objective of this study is to comprehend the comparative growth potential of NBFCs and Banks and to have comparison of their performances on the basis of key financial parameters that is profitability, leverage and liquidity ratios. This study is conducted to have better understanding of financial institutions and their significance in the financial structure of the country. Data For the present study secondary data is collected from various issues of RBI Bulletin regarding Financial and Investment companies and for Banks it is collected from articles of Business of Commercial Banks in India of RBI. As mentioned above, the period covered in the study is of fifteen years from 1995 to 2005. The study presents an analysis of the performance of Non-Government Non-Banking Financial and Investment (excluding insurance and banking companies) for fifteen-year period based on the audited annual accounts data of 18,225 companies, out of which 17,636 company’s data are based on the Ministry of Corporate Affairs(MCA) which mainly covers four categories of NBFCs that are a) Trading in shares and investment holdings (TS+IH), b) Hire purchase finance (HP), c) loan finance (LF) and d) leasing (L).
  • 31. COMPARITIVE ANALYSIS OF NBFCS AND BANKS 26 This thesis attempts to have comparative analysis of financial performance of Banks with NBFCs. The data for 282 Scheduled Commercial Banks for fifteen-year period is collected from Annual Balance sheet of Banks which covers all the categories that are a) Public Sector Banks b) Private Sector Banks, c) Foreign Banks and d) Regional Rural Banks For the purpose of analysis, various ratios of profitability, leverage and liquidity, average of fifteen years’ ratio i.e. 1995 to 2000 is found for Scheduled Commercial Banks and Non Baking Financial Companies separately. three broad group: viz. profitability ratios, leverage ratios and liquidity ratios. The ratios under study are
  • 32. COMPARITIVE ANALYSIS OF NBFCS AND BANKS 27 Methodology To analyze the financial performance of Banks and Non-Banking Financial Companies, first financial ratios that are profitability, Leverage and Liquidity Ratios are evaluated for each year of fifteen-year period. Profitability Ratios are taken in order to assess a business’s ability to generate earnings compared to its expenses and other relevant costs incurred during a specific period of time. High Profitability ratio means high efficiency of organization due to which it turns business activities into profits. Leverage Ratio is one of the several financial measure that looks how much capital comes in the form of Debt and assesses the ability of a company to meet its financial obligation. Highly leveraged means that organization has more debt than equity. Liquidity Ratio is taken into consideration in order to measure company’s ability to pay Debt obligation and which is calculated as Company’s Assets by its Liabilities. High current ratio means organization is more likely to meet its liabilities which are due over the next twelve months. Further, to analyze if there is a significant difference between the performance of NBFCs and Scheduled Commercial Banks, Analysis of Variance (ANOVA) is applied on each ratio. This statistical tool will assist in gauging the financial performance of NBFCs and Scheduled Commercial Banks which have been selected for the study for fifteen-year period. Hypothesis: To analyze the comparative performance of Banking Sector and NBFCs, we will take hypothesis as H0: There is no significant difference between the performance of Banks and Non-bank financial companies. H1: There is a significant difference between the performance Banks and Non-bank financial companies.
  • 33. COMPARITIVE ANALYSIS OF NBFCS AND BANKS 28 Design of the Study As, the main motive of this study is to examine the comparative performance of Scheduled Commercial Banks and Non-Banking Financial Companies, in order to have clear picture of their contribution to the Financial Economy by evaluating their performances. The objective of this study is to accomplished by comparing their performances on the basis of key financial parameters that is profitability, leverage and liquidity ratios. In profitability ratio, seven Indicators are taken which will define business’s ability to generate earnings compared to its expenses. In leverage ratio, six Indicators are taken which measures the amount of capital that comes in the form of Debt and assesses the ability of a company to meet its financial obligation. To measure the liquidity of Banks and NBFCs, current ratio is measured which is calculated as current assets by current ratio. RATIO DESCRIPTION INCOME/ASSET Return on Assets (ROA) Return on assets (ROA) is a financial ratio that shows the percentage of profit a company earns in relation to its overall resources. OPERATING PROFIT / TOTAL ASSET The return on total assets (ROTA) is a ratio that measures a company's earnings before interest and taxes (EBIT) against its total net assets. The ratio is considered to be an indicator of how effectively a company is using its assets to generate earnings before contractual obligations must be paid. PROFIT AFTER TAX /NET WORTH The ratio is determined by a formula that divides net profit after taxes by shareholder investment plus retained earnings. Retained earnings are a percentage of net earnings not paid out as dividends but that are retained to reinvest in the company or pay down debt.
  • 34. COMPARITIVE ANALYSIS OF NBFCS AND BANKS 29 RATIO DESCRIPTION TAX PROVISION /PROFIT BEFORE TAX A provision for income taxes is the estimated amount that a business or individual taxpayer expects to pay in income taxes for the current year. RETURN ON NET WORTH Return on equity (ROE) is a measure of profitability that calculates how many dollars of profit a company generates with each dollar of shareholders' equity. The formula for ROE is: ROE = Net Income/Shareholders' Equity. ROE is sometimes called "return on net worth." PROFIT BEFORE TAX TO TOTAL INCOME Before-tax profit margin is a financial performance ratio, calculated by dividing net profit before taxes by revenue. A company's before-tax profit margin is important because it tells investors the percentage of money a company actually earns per dollar of revenue. Borrowings to Total assets The debt to total assets ratio is an indicator of financial leverage. It tells you the percentage of total assets that were financed by creditors, liabilities, debt. The debt to total assets ratio is calculated by dividing a corporation's total liabilities by its total assets. Bank borrowing to total asset For investment banks, the average debt/equity is higher, about 3.1. The debt/equity ratio is a leverage ratio that represents what amount of debt and equity is being used to finance a company's assets. It is calculated as total liabilities divided by total shareholders' equity. Net worth to total assets Net worth of an individual is the difference between his/her total assets and total liabilities. Net worth is positive if the accumulated assets are worth more than the liabilities. This ratio indicates the ability of an
  • 35. COMPARITIVE ANALYSIS OF NBFCS AND BANKS 30 RATIO DESCRIPTION individual to repay all his/her existing debts using existing assets in case of unforeseen events Bank Borrowing to total borrowing For example, if the leverage ratio is 2, the company was able to obtain in debt double of what they have as equity. In that way, the more a business has money invested by the shareholders and / or the profits of the company, the more it is able to borrow at the bank, which explains the use of the term “leverage”. Debt Equity The debt-to-equity ratio (D/E) is a financial ratio indicating the relative proportion of shareholders' equity and debt used to finance a company's assets. Closely related to leveraging, the ratio is also known as risk, gearing or leverage. Loans to current Assets The loans to assets ratio measures the total loans outstanding as a percentage of Current assets. The higher this ratio indicates a bank is loaned up and its liquidity is low. The higher the ratio, the more risky a bank may be to higher defaults. Current Asset/ Current Liabilities Current Assets divided by Current Liabilities, measuring current assets available to cover current liabilities, a test of near-term solvency. The ratio indicates to what extent cash on hand and disposable assets are enough to pay off near term liabilities.
  • 36. COMPARITIVE ANALYSIS OF NBFCS AND BANKS 31 Chapter 5: Analysis After calculating fourteen indicators for both the Financial Institutions, Anova is applied on each of the indicator to do comparative analysis. Profitability Ratios  Income by Assets Ratio Descriptives IA N Mean Std. Deviation Std. Error 95% Confidence Interval for Mean MinimumLower Bound Upper Bound Rank 15 7599 .32209 . 08316 .5815 .9382 . 01 N NBFC 15 1171 .02026 . 00523 .1059 .1283 . 09 T Total 30 4385 .39638 . 07237 .2905 .5865 . 01 ANOVA IA Sum of Squares Df Mean Square F Sig. Between Groups 3.098 1 3.098 59.496 .000 Within Groups 1.458 28 .052 Total 4.557 29
  • 37. COMPARITIVE ANALYSIS OF NBFCS AND BANKS 32 It is evident that there is a significant difference between the performance of Banks and Non-bank financial companies which concludes performance of Banks is better than performance of NBFCs in terms of Income by Asset Ratio. As from the Anova table, it is clear that Test Statistic: F = 59.496 For v1 = 1 and v2 = 28 and for α = 0.05, the table value of F is F0.05 =4.20 Since the calculated value of F=59.46 which is greater than the tabulated value of F = 4.20, hence null hypothesis is rejected.  Operating Profits to Total Assets Descriptives OPTA N Mean Std. Deviation Std. Error 95% Confidence Interval for Mean M inimum Lowe r Bound Uppe r Bound B ank 15 1.9433 .35981 . 09290 1.7441 2.142 6 1 .44 N BFC 15 2.8467 1.71125 . 44184 1.8990 3.794 3 . 10 T otal 30 2.3950 1.29894 . 23715 1.9100 2.880 0 . 10
  • 38. COMPARITIVE ANALYSIS OF NBFCS AND BANKS 33 ANOVA OPTA Sum of Squares D f Mean Square F S ig. Between Groups 6.120 1 6.120 4. 003 .0 55 Within Groups 42.810 2 8 1.529 Total 48.930 2 9 It is evident that there is no significant difference between the performance of Banks and Non-bank financial companies in terms of Operating Profit to Total Assets. As from the Anova table, it is clear that Test Statistic: F = 4.003 For v1 = 1 and v2 = 28 and for α = 0.05, the table value of F is F0.05 =4.20 Since the tabulated value of F=4.20 is greater than the calculated value of F = 4.003, hence null hypothesis is accepted  Profit After Tax to Net Worth
  • 39. COMPARITIVE ANALYSIS OF NBFCS AND BANKS 34 Descriptives PATNW N Mean Std . Deviation S td. Error 95% Confidence Interval for Mean Mini mum Lower Bound Upper Bound Bank 15 .1172 .04 433 . 01144 .0927 .1418 .01 NBFC 15 .1085 .14 069 . 03633 .0306 .1864 .02 Total 30 .1129 .10 259 . 01873 .0746 .1512 .01 ANOVA PATNW Sum of Squares df Mean Square F S ig. Between Groups .001 1 .001 .0 52 .8 21 Within Groups .305 2 8 .011 Total .305 2 9
  • 40. COMPARITIVE ANALYSIS OF NBFCS AND BANKS 35 It is evident that there is no significant difference between the performance of Banks and Non-bank financial companies in terms of Profit After Tax to Net Worth. As from Anova table, it is clear that Test Statistic: F = 0.052 For v1 = 1 and v2 = 28 and for α = 0.05, the table value of F is F0.05 =4.20 Since the tabulated value of F=4.20 is greater than the calculated value of F = 0.052, hence null hypothesis is accepted.  Tax Provision to Profit Before Tax Descriptives TPPBT N Mean Std. Deviation Std. Error 95% Confidence Interval for Mean Minimum Lower Bound Upper Bound Bank 15 .2248 .15389 .03974 .1395 .3100 .12 NBFC 15 .4931 .63049 .16279 .1440 .8423 .13 Total 30 .3589 .47113 .08602 .1830 .5349 .12 ANOVA TPPBT Sum of Squares df Mean Square F S ig. Between Groups .540 1 .540 2. 565 .1 20 Within Groups 5.897 2 8 .211 Total 6.437 2 9
  • 41. COMPARITIVE ANALYSIS OF NBFCS AND BANKS 36 It is evident that there is no significant difference between the performance of Banks and Non-bank financial companies in terms of Tax Provision to Profit Before Tax As from Anova table, it is clear that the Test Statistic: F = 2.565 For v1 = 1 and v2 = 28 and for α = 0.05, the table value of F is F0.05 =4.20 Since the tabulated value of F=4.20 is greater than the calculated value of F = 2.565, hence null hypothesis is accepted.  Profit After Tax to Total Assets Descriptives PATTA N M ean Std. Deviation S td. Error 95% Confidence Interval for Mean M inimum Lowe r Bound Uppe r Bound B ank 1 5 . 0073 .002 88 . 00074 .0057 .0089 . 00 N BFC 1 5 2 .2542 1.38 487 . 35757 1.487 3 3.021 1 . 13 T otal 3 0 1 .1307 1.49 382 . 27273 .5729 1.688 5 . 00
  • 42. COMPARITIVE ANALYSIS OF NBFCS AND BANKS 37 ANOVA PATTA Sum of Squares D f Mean Square F S ig. Between Groups 37.863 1 37.863 3 9.484 .0 00 Within Groups 26.850 2 8 .959 Total 64.714 2 9 It is evident that there is a significant difference between the performance of Banks and Non-bank financial companies which concludes performance of NBFCs is better than banks in terms of Profit After Tax to Total Assets As from Anova table, it is clear that the Test Statistic: F = 39.484 For v1 = 1 and v2 = 28 and for α = 0.05, the table value of F is F0.05 =4.20 Since the calculated value of F=39.484 is greater than the tabulated value of F = 4.20, hence null hypothesis is rejected.  Return on Net Worth
  • 43. COMPARITIVE ANALYSIS OF NBFCS AND BANKS 38 Descriptives RNW N Mean Std. Deviation Std. Error 95% Confidence Interval for Mean Minimum Lower Bound Uppe r Bound Bank 15 12.2820 4.74178 1.22432 9.6561 14.90 79 1.27 NBFC 15 6.8760 4.25693 1.09913 4.5186 9.233 4 .02 Total 30 9.5790 5.21162 .95151 7.6329 11.52 51 .02 ANOVA RNW Sum of Squares df Mean Square F S ig. Between Groups 219.186 1 219.186 10.796 . 003 Within Groups 568.482 28 20.303 Total 787.668 29 It is evident that there is a significant difference between the performance Banks and Non- bank financial companies which concludes performance of Banks is better than performance of NBFCs in terms of Return on Net Worth As from Anova table it is clear that the Test Statistic: F = 10.796 For v1 = 1 and v2 = 28 and for α = 0.05, the table value of F is F0.05 =4.20 Since the calculated value of F=10.796 is greater than the tabulated value of F = 4.20, hence null hypothesis is rejected.
  • 44. COMPARITIVE ANALYSIS OF NBFCS AND BANKS 39  Profit Before Tax to Total Income Descriptives PBTTI N Mean Std. Deviation Std. Error 95% Confidence Interval for Mean MinimumLower Bound Upper Bound Bank 15 .0965 .03536 .00913 .0769 .1161 .02 NBFC 15 25.8327 16.44746 4.24672 16.7244 34.9410 4.04 Total 30 12.9646 17.37510 3.17224 6.4766 19.4526 .02 ANOVA PBTTI Sum of Squares df Mean Square F Sig. Between Groups 4967.641 1 4967.641 36.727 .000 Within Groups 3787.284 28 135.260 Total 8754.925 29 It is evident that there is a significant difference between the performance Banks and Non- bank financial companies which concludes performance of NBFCs is better than performance of Banks in terms of Profit Before Tax to Total Income As from Anova Table it is clear that the Test Statistic: F = 36.727 For v1 = 1 and v2 = 28 and for α = 0.05, the table value of F is F0.05 =4.20 Since the calculated value of F=36.727 is greater than the tabulated value of F = 4.20, hence null hypothesis is rejected.
  • 45. COMPARITIVE ANALYSIS OF NBFCS AND BANKS 40 Leverage Ratios:  Borrowings to Total Assets Descriptives BTA N Mean Std. Deviation Std. Error 95% Confidence Interval for Mean MinimumLower Bound Upper Bound Bank 15 .0585 .01649 .00426 .0493 .0676 .04 NBFC 15 .6671 .23859 .06160 .5350 .7992 .07 Total 30 .3628 .35130 .06414 .2316 .4940 .04 ANOVA BTA Sum of Squares df Mean Square F Sig. Between Groups 2.778 1 2.778 97.141 .000 Within Groups .801 28 .029 Total 3.579 29 It is evident that there is a significant difference between the performance Banks and Non- bank financial companies which concludes performance of Banks is better than performance of NBFCs in terms of Borrowings to Total Assets. As from Anova table, it is clear Test Statistic: F = 97.141
  • 46. COMPARITIVE ANALYSIS OF NBFCS AND BANKS 41 For v1 = 1 and v2 = 28 and for α = 0.05, the table value of F is F0.05 =4.20 Since the calculated value of F=97.141 is greater than the tabulated value of F = 4.20, hence null hypothesis is rejected.  Bank Borrowings to Total Assets Descriptives BBTA N Mean Std. Deviation Std. Error 95% Confidence Interval for Mean MinimumLower Bound Upper Bound Bank 15 .0155 .00748 .00193 .0114 .0197 . 01 NBFC 15 .2617 .16744 .04323 .1690 .3545 . 09 Total 30 .1386 .17099 .03122 .0748 .2025 . 01 ANOVA BBTA Sum of Squares df Mean Square F Sig. Between Groups .455 1 .455 32.367 .000 Within Groups .393 28 .014 Total .848 29
  • 47. COMPARITIVE ANALYSIS OF NBFCS AND BANKS 42 It is evident that there is a significant difference between the performance Banks and Non- bank financial companies which concludes performance of Banks is better than performance of NBFCs in terms of Income by Asset Ratio. As from Anova Table it is clear that the Test Statistic: F = 32.367 For v1 = 1 and v2 = 28 and for α = 0.05, the table value of F is F0.05 =4.20 Since the calculated value of F=32.367 is greater than the tabulated value of F = 4.20, hence null hypothesis is rejected.  Net Worth to Total Assets Descriptives NWTA N Mean Std. Deviation Std. Error 95% Confidence Interval for Mean MinimumLower Bound Upper Bound Bank 15 .0620 .00547 .00141 .0590 .0651 . 05 NBFC 15 .8163 .18623 .04808 .7132 .9195 . 27 Total 30 .4392 .40485 .07392 .2880 .5904 . 05
  • 48. COMPARITIVE ANALYSIS OF NBFCS AND BANKS 43  ANOVA NWTA Sum of Squares df Mean Square F Sig. Between Groups 4.267 1 4.267 245.878 .000 Within Groups .486 28 .017 Total 4.753 29 It is evident that there is a significant difference between the performance Banks and Non- bank financial companies which concludes performance of NBFCs is better than performance of Banks in terms of Net Worth to Total Assets. As from Anova Table it is clear that the Test Statistic: F = 245.878 For v1 = 1 and v2 = 28 and for α = 0.05, the table value of F is F0.05 =4.20 Since the calculated value of F= 245.878 is greater than the tabulated value of F = 4.20, hence null hypothesis is rejected.  Loans to Current Asset Descriptives LCA N Mean Std. Deviation Std. Error 95% Confidence Interval for Mean MinimumLower Bound Upper Bound Bank 15 . 4558 .07045 . 01819 .4168 .4948 . 39 NBFC 15 . 3630 .14731 . 03804 .2814 .4446 . 09 Total 30 . 4094 .12288 . 02243 .3635 .4553 . 09
  • 49. COMPARITIVE ANALYSIS OF NBFCS AND BANKS 44 ANOVA LCA Sum of Squares df Mean Square F Sig. Between Groups .065 1 .065 4.844 .036 Within Groups .373 28 .013 Total .438 29 It is evident that there is a significant difference between the performance Banks and Non- bank financial companies which concludes performance of NBFCs is better than performance of Banks in terms of Loans to Current Assets. As from Anova Table , it is clear that the Test Statistic: F = 4.844 For v1 = 1 and v2 = 28 and for α = 0.05, the table value of F is F0.05 =4.20 Since the calculated value of F=4.844 is greater than the tabulated value of F = 4.20, hence null hypothesis is rejected. there
  • 50. COMPARITIVE ANALYSIS OF NBFCS AND BANKS 45  Bank Borrowings to Total Assets Descriptives BBTA N Mean Std. Deviation Std. Error 95% Confidence Interval for Mean MinimumLower Bound Upper Bound Bank 15 .0155 .00748 .00193 .0114 .0197 . 01 NBFC 15 .6671 .23859 .06160 .5350 .7992 . 07 Total 30 .3413 .37054 .06765 .2029 .4797 . 01 ANOVA BBTA Sum of Squares df Mean Square F Sig. Between Groups 3.184 1 3.184 111.753 .000 Within Groups .798 28 .028 Total 3.982 29 It is evident that there is a significant difference between the performance Banks and Non- bank financial companies which concludes performance of Banks is better than performance of NBFCs in terms of Bank Borrowings to Total Asset As from Anova Table it is clear that the Test Statistic: F = 111.753 For v1 = 1 and v2 = 28 and for α = 0.05, the table value of F is F0.05 =4.20
  • 51. COMPARITIVE ANALYSIS OF NBFCS AND BANKS 46 Since the calculated value of F=111.753 is greater than the tabulated value of F = 4.20, hence null hypothesis is rejected.  Bank Borrowings to Total Borrowings Descriptives BBTB N Mean Std. Deviation Std. Error 95% Confidence Interval for Mean MinimumLower Bound Upper Bound Bank 15 .2830 .13393 .03458 .2088 .3571 . 07 NBFC 15 .3805 .30837 .07962 .2097 .5512 . 16 Total 30 .3317 .23880 .04360 .2425 .4209 . 07 ANOVA BBTB Sum of Squares df Mean Square F Sig. Between Groups .071 1 .071 1.261 .271 Within Groups 1.582 28 .057 Total 1.654 29 It is evident that there is no significant difference between the performance Banks and Non- bank financial companies in terms of Bank Borrowings to Total Borrowings. As from Anova Table, it is clear that the Test Statistic: F = 1.261
  • 52. COMPARITIVE ANALYSIS OF NBFCS AND BANKS 47 For v1 = 1 and v2 = 28 and for α = 0.05, the table value of F is F0.05 =4.20 Since the calculated value of F=1.261 is less than the tabulated value of F = 4.20, hence null hypothesis is accepted.  Debt by Equity Ratio Descriptives DE N Mean Std. Deviation Std. Error 95% Confidence Interval for Mean MinimumLower Bound Upper Bound Bank 15 132.7856 58.48476 15.10070 100.3979 165.1734 11.79 NBFC 15 90.1453 14.75270 3.80913 81.9756 98.3151 76.05 Total 30 111.4655 47.18635 8.61501 93.458 129.0852 11.79 ANOVA DE Sum of Squares df Mean Square F Sig. Between Groups 13636.467 1 13636.467 7.496 .011 Within Groups 50933.535 28 1819.055 Total 64570.002 29
  • 53. COMPARITIVE ANALYSIS OF NBFCS AND BANKS 48 It is evident that there is a significant difference between the performance Banks and Non- bank financial companies which concludes performance of NBFCs is better than performance of Banks in terms of Income by Asset Ratio. As from Anova Table, it is clear that the Test Statistic: F = 7.496 For v1 = 1 and v2 = 28 and for α = 0.05, the table value of F is F0.05 =4.20 Since the calculated value of F=7.496 is greater than the tabulated value of F = 4.20, hence null hypothesis is rejected Liquidity Ratio  Current Ratio Descriptives CR N Mean Std. Deviation Std. Error 95% Confidence Interval for Mean MinimumLower Bound Upper Bound Bank 15 1.3784 4.64870 1.20029 8.4156 13.5644 3.29 NBFC 15 10.9900 1.20307 .31063 .7122 2.0447 .17 Total 30 6.1842 5.9806 1.08048 3.9744 8.3940 .17 ANOVA CR Sum of Squares df Mean Square F Sig. Between Groups 692.869 1 692.89 60.098 .000 Within Groups 322.809 28 11.529 Total 1015.679 29
  • 54. COMPARITIVE ANALYSIS OF NBFCS AND BANKS 49 It is evident that there is a significant difference between the performance Banks and Non- bank financial companies which concludes performance of NBFCs is better than performance of Banks in terms of Current Ratio that is Current Assets by Current Liabilities. As from Anova Table, it is clear Test Statistic: F = 60.098 For v1 = 1 and v2 = 28 and for α = 0.05, the table value of F is F0.05 =4.20 Since the calculated value of F=60.098 is greater than the tabulated value of F = 4.20, hence null hypothesis is rejected.
  • 55. COMPARITIVE ANALYSIS OF NBFCS AND BANKS 50 Chapter 6: Conclusion Green = Profitability Ratios Blue = Leverage Ratio Grey = Liquidity Ratio Indicators Non-Baking Finance Companies Scheduled Commercial Banks Income to Asset Ratio Operating Profit to Total Assets Profit After Tax to Net Worth Total Profits to Profit Before Tax Profit After Tax to Total Assets Return on Net Worth Profit Before Tax to Total Income Borrowings to Total Assets Bank Borrowings to Total Assets Net Worth to Total Assets Loans to Current Assets
  • 56. COMPARITIVE ANALYSIS OF NBFCS AND BANKS 51 On comparing the performances of two major financial institutions that is Banks and NBFC’s we understand that in profitability ratios, banks have an upper hand, On Leverage ratio they stand equal and Liquidity ratio NBFCs perform better. This comparative analysis on accounting ratios shows that there is not much significant difference on the performance of both the institutes. The major difference between the two lies on the Regulation body under which they operate, Banks under RBI regulations and NBFC’s under Companies Act. There might be some difference on the area of interest for investment. They might aim for different sectors and Investment Amount. But, they both play an important role in the overall growth of the economy. Banks generally finance Large institutions and Corporate while NBFC’s target for retail sector. Rating is another key difference between banks and NBFCs. For example, the deposits of NBFCs are rated, while the deposits of banks are not. The latter is considered as very safe, while the former is not. Since they both hold a key position in the financial system and as mentioned playing an important role in the economic development by expanding their wings in the form of advancing credit to almost all the sectors of the economy and various echelons of population it is extremely essential that these financial institutions should be sustainable as their financial collapse may possibly trigger uncontrollable financial cataclysm. For Further research I would like to suggest that more financial ratios shall be considered in context of Capital, Assets Under Management and Efficiency and for a longer period of time . Bank Borrowings to Total Assets Bank Borrowings to Total Borrowings Debt Equity Current Ratio
  • 57. COMPARITIVE ANALYSIS OF NBFCS AND BANKS 52 References Ahn, C. a. Kyes and Mujin-Financial Intermediaries in South Korea. Ardener. The Evolution of an Informal Financial Institution. Basu, S. Non- Banking Financial Intermediaries and Monetary Policy. CMIE. Monthly Review of Indian Economy. De, B. B. (2009). Study on NBFCs and Banks. Greenspan. (2011). financial effectiveness of NBFCs. Higuchi, S. a. (2000.). A Continuum of Informality of Credit: What Can Informal. Joshi, M. (1999.). “Financial Intermediaries in India. Kantawala, A. S. (1992.). Financial Performance of Non Banking Finance Companies. Khan, D. A. (2009). Role of Banking Sector. Kothari, D. A. (2010). Overall Household Debt-NBFCs role. MachirajuH.R. (n.d.). Indian Financial System. Manickavasagm, G. a. (2010). Risk Assesment Model for Assesing NBFC. Menon, S. K.A.Schemes for starting Chitties under State Auspecies. Nagarkar, J. Analysis of Financial Performance of Banks in India. Reserve Bank Of India Bulletin . Saggar, S. Financial Performance of Leasing Companies, During the Quinquennium Ending. Santeshkumar, P. Non-Banking Financial Companies. Simcox. Primitive Civilization or Outlines of the History of Ownership in Archaic. Sinha, A. B. Non-Banking Financial Institutions of India- Their Onset, Growth and Performance of Selected NBFCs. V.Krishnan. (1995). Indigenous Banking in South India. Vadde. (2011). Non-Banking Financial Companies-An Evaluation.
  • 58. COMPARITIVE ANALYSIS OF NBFCS AND BANKS 53 Appendix Paid up Capital for Banks and NBFC’s Income for Banks and NBFC’s 0 12500 25000 37500 50000 1995-96 1997-98 1999-00 2001-02 2003-04 2005-06 2007-08 2009-10 2011-12 Paid up Capital (Crore)
NBFC'S Paid up Capital
 Banks 0 125000 250000 375000 500000 1995-96 1997-98 1999-00 2001-02 2003-04 2005-06 2007-08 2009-10 Income (Crore) for NBFC's TOTAL INCOME for Banks
  • 59. COMPARITIVE ANALYSIS OF NBFCS AND BANKS 54 Accounting Ratio’s of NBFC’s Years Return on Net Worth Tax Provisi on to Profit Operati ng Profits to Profits after Tax to Net Debt to equity Borrow ingsto total assets Bank borrowi ngsto total Current Ratio Total Income /Total Assets PBT/T otal Income Loans to Current Assets PAT/N et Worth PAT/T otal Assets Bank Borowi ngs/To tal Net worth /Total Assets 1995-96 11.9 0.126 4 0.119 76.05 0.386 0.244 0.749 0.143 28.06 0.271 4.164 3.496 0.094 0.839 1996-97 3.6 0.331 2.1 0.051 78.41 0.474 0.221 1.106 0.145 11.94 0.236 1.18 1.008 0.105 0.855 1997-98 5.2 0.331 2.1 0.052 79.38 0.689 0.167 1.153 0.153 13.86 0.284 1.664 1.414 0.115 0.85 1998-99 0.02 2.702 0.1 0.02 81.04 0.592 0.158 1.006 0.132 5.44 0.283 0.144 0.125 0.094 0.872 1999-00 6 0.368 2.6 0.06 82.4 0.575 0.189 1.033 0.13 4.036 0.302 0.421 0.372 0.109 0.883 2000-01 0.02 0.506 1.8 0.036 82.5 0.07 1.432 3.713 0.111 5.297 0.092 2.621 2.548 0.1 0.972 2001-02 2.9 0.785 0.4 0.6 86.9 0.912 0.227 0.75 0.098 21.72 0.511 2.007 1.662 0.207 0.828 2002-03 4.9 0.426 1.2 0.029 87.4 0.58 0.29 0.691 0.095 22.19 0.405 1.505 1.311 0.214 0.871 2003-04 7.4 0.337 1.9 0.049 98.4 0.65 0.294 0.605 0.096 30.45 0.475 2.295 2.055 0.247 0.895 2004-05 10.2 0.219 3.3 0.102 93.8 0.7 0.362 0.398 0.095 38.22 0.408 3.096 2.793 0.28 0.902 2005-06 13.2 0.189 5.3 0.132 81.5 0.76 0.426 3.17 0.119 54.25 0.37 5.927 5.412 0.396 0.913 2006-07 13.3 0.25 5.9 0.133 81.8 0.85 0.422 3.53 0.119 30.06 0.354 2.916 2.667 0.437 0.915 2007-08 9.5 0.263 4.6 0.095 105.6 0.9 0.432 2.374 0.108 45.41 0.745 3.979 3.564 0.489 0.896 2008-09 7.8 0.281 4 0.078 106.2 0.92 0.447 0.226 0.091 52.6 0.404 7.089 3.425 0.501 0.483 2009-10 7.2 0.283 3.4 0.072 130.8 0.95 0.396 0.174 0.122 23.97 0.305 7.234 1.959 0.539 0.271
  • 60. COMPARITIVE ANALYSIS OF NBFCS AND BANKS 55 Accounting Ratios for Banks Years Return onNet Worth Debt/ Equity liabilit ies/As sets Incom e/Tota l Assets Bank borro wings to total borro wings Opera ting Profit/ total Assets Borrwi ngsto total Assets PBT/T oatal Incom e PAT/N et worth PAT/T otal Assets Tax/PBT Bank Borro wings /Total Assets Net worth /Total Assets Loans/ Assets Opera ting Profits to Total net Assets 1995-96 5.71 57.848 18.14 0.35 0.3473 1.44 0.0523 0.0547 0.0569 0.0034 0.3621 0.0182 0.0605 0.4054 1.44 1996-97 1.27 11.791 16.15 0.008 0.4894 1.63 0.0726 0.025 0.0126 0.0008 0.718 0.0355 0.0603 0.4198 1.63 1997-98 8.29 73.739 14.74 0.54 0.2743 1.77 0.0379 0.0643 0.0821 0.0053 0.2726 0.0104 0.0641 0.4067 1.77 1998-99 12.01 111.82 12.47 0.8 0.2606 1.82 0.0353 0.092 0.1185 0.0079 0.1998 0.0092 0.0667 0.4044 1.82 1999-00 8.72 83.138 14.67 0.5 0.4121 1.48 0.0445 0.0647 0.0857 0.0049 0.271 0.0183 0.0577 0.3854 1.48 2000-01 12.22 117.83 12.13 0.69 0.4667 1.68 0.0427 0.0823 0.1196 0.0068 0.2071 0.0199 0.0566 0.3955 1.68 2001-02 10.22 100.35 15.03 0.54 0.4842 1.55 0.0442 0.0686 0.0998 0.0053 0.2442 0.0214 0.0529 0.4022 1.55 2002-03 13.96 141.95 8.12 0.78 0.3278 1.96 0.0702 0.0943 0.1364 0.0077 0.1745 0.023 0.0561 0.4167 1.96 2003-04 17.3 171.04 5.25 1.02 0.2586 2.39 0.0519 0.115 0.1692 0.01 0.1397 0.0134 0.0592 0.4321 2.39 2004-05 19.31 207.88 3.29 1.15 0.1692 2.67 0.0492 0.1381 0.1888 0.0113 0.1221 0.0083 0.0596 0.4345 2.67 2005-06 14.21 176.08 10.65 0.91 0.1405 2.16 0.0715 0.1289 0.1393 0.0089 0.1431 0.01 0.064 0.486 2.16 2006-07 14.51 184.38 13.37 0.94 0.16 2.08 0.0732 0.1291 0.1321 0.0087 0.1421 0.0117 0.066 0.5409 2.08 2007-08 15.24 192.58 10.64 0.98 0.212 2.09 0.0709 0.1296 0.14 0.0089 0.1328 0.015 0.0635 0.5689 2.09 2008-09 15.89 187 6 1.09 0.1671 2.13 0.0706 0.1316 0.135 0.0098 0.1209 0.0118 0.0728 0.5694 2.13 2009-10 15.37 174.35 4.2 1.1 0.0746 2.3 0.0902 0.1294 0.1426 0.01 0.1216 0.0067 0.0703 0.5686 2.3