SlideShare a Scribd company logo
Introduction
Depression, long stigmatized as a complaint of the merely idle or a “case of the blues,” is
increasingly accepted in the medical community as a serious and possibly fatal disease if left
untreated, but one that can be managed with psychiatric care. For this reason, as well as for the
general preservation of the happiness of the patient, it is worthwhile to investigate what factors
contribute to a primary care physician diagnosing depression in a patient during a visit. Such an
investigation could have all sorts of benefits, such as exposing bias on the part of physicians to
under- or over-diagnose depression in particular demographic groups, the level of trust
physicians put in various metrics (such as the Beck depression score and the SF-36 self-
administered test of mental and physical wellness, both of which are included in the dataset I will
be using for this paper). The data is of particular importance as depression in primary care can
lead to complications in treatment down the road.
Material and Methods
This paper will seek to explore the relationships between six explanatory variables (PCS and MCS,
the physical and mental components of the SF-36 tests measuring physical and mental health of
the patient; BECK, the Beck depression score; PGEND, the patient’s gender; AGE, the patient’s
age; and EDUCAT, the number of years of formal schooling) and the binary response variable
DAV, where 1 represents a diagnosis of depression. A handful of multivariate techniques
immediately suggest themselves when examining the structure of the data, particularly due to
the heterogeneity of types of data in the set (DAV, EDUCAT and PGEND are factors, while PCS,
MCS, AGE, and BECK are continuous numerical variables). Methods used were Hotelling’s T2 and
Wilks’ Lambda tests of the equality of mean vectors, multivariate linear regression, principal
component analysis, and a linear discriminant analysis.
Results
Equality of Means
Using Hotelling’s T2 test, I established that at a significance level α=0.95, there was significant
evidence (P-value = 1.727e-10) to reject equality of mean vectors between those who had been
diagnosed with depression (m1 = 64) and those who had not (m2=336). Using Wilks’ Lambda test,
I was further able to establish inequality of mean vectors (p-value = 2.557e-06) across the three
education groups (years educated, with factor levels Less than 12 years (n1=61), 12 to 14 years
(n2=241), and More than 14 years (n3=90) ). Mean vectors and comparison of results are given
below.
group: no | group: yes | Hotelling's T^2
vars n mean sd median | vars n mean sd median | --------------------
pcs 1 336 41.54 11.44 41.85 | pcs 1 64 38.77 12.04 38.46 | Test stat: 13.725
mcs 2 336 46.41 11.92 48.81 | mcs 2 64 35.00 13.31 34.63 | Numerator df: 4
beck 3 336 4.66 5.04 3.00 | beck 3 64 9.36 7.15 7.00 | Denominator df: 395
age 4 336 41.89 15.74 38.00 | age 4 64 43.66 13.15 42.00 | P-value: 1.727e-10
---------------------------------------------------------------------------------------
group: Less than 12 years | group: 12-14 years | group: More than 14yr |
vars n mean sd median | n mean sd median | n mean sd median |
pcs 1 61 39.30 11.00 37.40 | 249 40.60 11.39 40.75 | 90 43.67 12.15 46.42 |
mcs 2 61 42.38 13.33 42.74 | 249 44.79 12.48 46.91 | 90 45.50 13.45 48.30 |
beck 3 61 7.57 7.59 5.00 | 249 5.13 5.23 4.00 | 90 4.73 5.10 3.50 |
age 4 61 50.77 15.48 53.00 | 249 40.58 15.29 36.00 | 90 40.76 13.55 39.00 |
---------------------------------------------------------------------------------------
One-way MANOVA (Bartlett Chi2)
Wilks' Lambda = 0.90261, Chi2-Value = 40.525, DF = 8.000, p-value = 2.557e-06
sample estimates:
pcs mcs beck age
12-14 40.60370 44.79197 5.128514 40.58233
Less than 12 39.29652 42.37531 7.573770 50.77049
More than 14 43.67233 45.49755 4.733333 40.75556
Multivariate Regression
Using R, I fit a multivariate regression model to 𝒀𝒀� = 𝑿𝑿𝜷𝜷� + 𝜺𝜺 such that
𝒀𝒀 = �
𝑌𝑌1,1 𝑌𝑌1,2
⋮ ⋮
𝑌𝑌400,1 𝑌𝑌400,2
� , 𝑿𝑿 = �
1 𝑋𝑋1,1 𝑋𝑋1,2 𝑋𝑋1,3
⋮ ⋮
1 𝑋𝑋400,1
⋮ ⋮
𝑋𝑋400,2 𝑋𝑋400,3
� , 𝜷𝜷� =
⎣
⎢
⎢
⎡
𝛽𝛽0,1
𝛽𝛽1,1
𝛽𝛽0,2
𝛽𝛽1,2
𝛽𝛽2,1
𝛽𝛽3,1
𝛽𝛽2,2
𝛽𝛽3,2⎦
⎥
⎥
⎤
, 𝜺𝜺 ~ 𝑁𝑁(𝟎𝟎, 𝚺𝚺)
Where Yi1 and Yi2 are MCS and BECK respectively; Xi1 , Xi2 , and Xi3 are the values of PCS, AGE,
and PGEND at a given i, 𝛽𝛽̂𝑖𝑖𝑖𝑖 are the values of the parameter estimates, and 𝜺𝜺 is a (400 x 2) noise
matrix. After carrying out Type I and Type II MANOVA tests, however, it would appear that AGE
is not doing much of the heavy predictive lifting:
Df Hotelling-Lawley approx F num Df den Df Pr(>F)
pcs 1 0.088653 17.5089 2 395 5.18e-08 ***
age 1 0.003401 0.6717 2 395 0.5113978
pgend 1 0.036114 7.1325 2 395 0.0009057 ***
Residuals 396
Type II MANOVA Tests: Pillai test statistic
Df test stat approx F num Df den Df Pr(>F)
pcs 1 0.079172 16.9808 2 395 8.419e-08 ***
age 1 0.002663 0.5274 2 395 0.5905750
pgend 1 0.034855 7.1325 2 395 0.0009057 ***
Removal of AGE from the model has very little effect on RSE, R2 or parameter estimates:
mcs beck
(Intercept) 40.256259297 11.55878014
pcs 0.055235813 -0.11995336
age 0.002945113 -0.01477639
pgend1 4.953358482 -1.52212099
mcs beck
(Intercept) 40.40822220 10.7963433
pcs 0.05446585 -0.1160902
pgend1 4.96332993 -1.5721503
Given that this is the case, I felt it reasonable to omit AGE from the final model:
𝒀𝒀� = �
1 𝑥𝑥1,1 𝑥𝑥1,2
⋮ ⋮ ⋮
1 𝑥𝑥400,1 𝑥𝑥400,2
� �
40.41 10.80
0.05 −0.12
4.96 −1.57
� + 𝜺𝜺
Principal Component Analysis
A principal component analysis was mildly successful; after standardizing the three variables PCS,
MCS and BECK to be centered at 0 with a standard deviation of 1, principal component analysis
was able to explain ~90% of the variation between samples using two linear combinations P1 and
P2; this analysis was, however, not particularly useful for classifying diagnosis or failure to
diagnose in primary care.
A biplot of the data projected on P1 and P2 confirms that there is not much differentiation
between higher or lower values of each component depending upon the group to which a subject
belongs. The loadings and cumulative contribution to variance for P1, P2 and P3 are given in the
output below.
Rotation: PC1 PC2 PC3
pcs -0.2994318 -0.93485239 -0.1907659
mcs -0.6552573 0.34681932 -0.6710844
beck 0.6935261 -0.07594322 -0.7164176
[sd] 1.3199826 0.9761081 0.5521403
Importance of components:
PC1 PC2 PC3
Standard deviation 1.3200 0.9761 0.5521
Proportion of Variance 0.5808 0.3176 0.1016
Cumulative Proportion 0.5808 0.8984 1.0000
Linear Discriminant Analysis
Results from LDA were similarly
underwhelming; as is evident from the
histogram and the scores/classes plots,
not very much separation between
factor levels could be achieved. The
highest density for the group not
diagnosed with depression is clearly
centered around LDA = -1, but there is
no clear highest density for the group
diagnosed, and it meanders into the
LDA = -1 region as well.
Values for the LDA coefficients are given below.
lda(dav ~ pcs + mcs + beck + age, data = f.lda)
Group means:
pcs mcs beck age
no 41.53721 46.40679 4.660714 41.89286
yes 38.77215 35.00299 9.359375 43.65625
Coefficients of linear discriminants:
LD1
pcs -0.007293228
mcs -0.054224639
beck 0.076986186
age 0.008000076
IV. Discussion
The tools of multivariate analysis are quite powerful, though it is clear from some of the results
that the utility of these techniques is largely dependent upon the nature of the data being
analyzed and the response variable being modeled. Clear differences in mean vectors were
demonstrated for two different classification groups (diagnosis and level of education), but the
high variability of the continuous predictor variables in the data made PCA and LDA less useful
than I might have liked. Still, some separation was achieved, and it was a powerful illustration
of how useful these techniques can be.

More Related Content

What's hot

Collaborative research on Dyslexia as at 6th Jan 2015
Collaborative research on Dyslexia as at 6th Jan 2015Collaborative research on Dyslexia as at 6th Jan 2015
Collaborative research on Dyslexia as at 6th Jan 2015
Nancy Doyle
 
Non parametric relationship - practice problems
Non parametric relationship - practice problemsNon parametric relationship - practice problems
Non parametric relationship - practice problems
Ken Plummer
 
Non parametric relationship (names) - practice problems
Non parametric relationship (names) - practice problemsNon parametric relationship (names) - practice problems
Non parametric relationship (names) - practice problems
Ken Plummer
 
Parametric or non parametric relationship practice problems
Parametric or non parametric relationship   practice problemsParametric or non parametric relationship   practice problems
Parametric or non parametric relationship practice problems
Ken Plummer
 
Single or multiple linear practice problems
Single or multiple linear   practice problemsSingle or multiple linear   practice problems
Single or multiple linear practice problems
Ken Plummer
 
Aspr 2009 Presentation (Tony Machin)
Aspr 2009 Presentation (Tony Machin)Aspr 2009 Presentation (Tony Machin)
Aspr 2009 Presentation (Tony Machin)
guestaedf29
 
Lutterbie_SGCP_2010
Lutterbie_SGCP_2010Lutterbie_SGCP_2010
Lutterbie_SGCP_2010
sjlutterbie
 
Parametric or non parametric relationship practice problems
Parametric or non parametric relationship   practice problemsParametric or non parametric relationship   practice problems
Parametric or non parametric relationship practice problems
Ken Plummer
 
What is the Mode?
What is the Mode?What is the Mode?
What is the Mode?
Ken Plummer
 
Srf deanna barch
Srf deanna barchSrf deanna barch
Srf deanna barch
wef
 

What's hot (10)

Collaborative research on Dyslexia as at 6th Jan 2015
Collaborative research on Dyslexia as at 6th Jan 2015Collaborative research on Dyslexia as at 6th Jan 2015
Collaborative research on Dyslexia as at 6th Jan 2015
 
Non parametric relationship - practice problems
Non parametric relationship - practice problemsNon parametric relationship - practice problems
Non parametric relationship - practice problems
 
Non parametric relationship (names) - practice problems
Non parametric relationship (names) - practice problemsNon parametric relationship (names) - practice problems
Non parametric relationship (names) - practice problems
 
Parametric or non parametric relationship practice problems
Parametric or non parametric relationship   practice problemsParametric or non parametric relationship   practice problems
Parametric or non parametric relationship practice problems
 
Single or multiple linear practice problems
Single or multiple linear   practice problemsSingle or multiple linear   practice problems
Single or multiple linear practice problems
 
Aspr 2009 Presentation (Tony Machin)
Aspr 2009 Presentation (Tony Machin)Aspr 2009 Presentation (Tony Machin)
Aspr 2009 Presentation (Tony Machin)
 
Lutterbie_SGCP_2010
Lutterbie_SGCP_2010Lutterbie_SGCP_2010
Lutterbie_SGCP_2010
 
Parametric or non parametric relationship practice problems
Parametric or non parametric relationship   practice problemsParametric or non parametric relationship   practice problems
Parametric or non parametric relationship practice problems
 
What is the Mode?
What is the Mode?What is the Mode?
What is the Mode?
 
Srf deanna barch
Srf deanna barchSrf deanna barch
Srf deanna barch
 

Similar to Multivariate models for the diagnosis of depression in primary care

Measures of Dispersion
Measures of DispersionMeasures of Dispersion
Measures of Dispersion
Birinder Singh Gulati
 
Affect of Metabolic Obesity and Body Mass Index in Coronary Artery Diseases
Affect of Metabolic Obesity and Body Mass Index in Coronary Artery DiseasesAffect of Metabolic Obesity and Body Mass Index in Coronary Artery Diseases
Affect of Metabolic Obesity and Body Mass Index in Coronary Artery Diseases
Nikhil Gupta
 
Chapter 9Multivariable MethodsObjectives• .docx
Chapter 9Multivariable MethodsObjectives• .docxChapter 9Multivariable MethodsObjectives• .docx
Chapter 9Multivariable MethodsObjectives• .docx
spoonerneddy
 
Measures of dispersion
Measures of dispersionMeasures of dispersion
Measures of dispersion
Jagdish Powar
 
Metanalysis Lecture
Metanalysis LectureMetanalysis Lecture
Metanalysis Lecture
drmomusa
 
1PPTs-Handout One-An Overview of Descriptive Statistics-Chapter 1_2.pptx
1PPTs-Handout One-An Overview of Descriptive Statistics-Chapter 1_2.pptx1PPTs-Handout One-An Overview of Descriptive Statistics-Chapter 1_2.pptx
1PPTs-Handout One-An Overview of Descriptive Statistics-Chapter 1_2.pptx
AbdulHananSheikh1
 
1 Statistical analysis HypothesisAs mentio
1  Statistical analysis  HypothesisAs mentio1  Statistical analysis  HypothesisAs mentio
1 Statistical analysis HypothesisAs mentio
MartineMccracken314
 
1 Statistical analysis HypothesisAs mentio
1  Statistical analysis  HypothesisAs mentio1  Statistical analysis  HypothesisAs mentio
1 Statistical analysis HypothesisAs mentio
AbbyWhyte974
 
Measure of dispersion by Neeraj Bhandari ( Surkhet.Nepal )
Measure of dispersion by Neeraj Bhandari ( Surkhet.Nepal )Measure of dispersion by Neeraj Bhandari ( Surkhet.Nepal )
Measure of dispersion by Neeraj Bhandari ( Surkhet.Nepal )
Neeraj Bhandari
 
Quantitative Analysis
Quantitative AnalysisQuantitative Analysis
Quantitative Analysis
unmgrc
 
Looking at data
Looking at dataLooking at data
Looking at data
pcalabri
 
MEASURES OF DISPERSION NOTES.pdf
MEASURES OF DISPERSION NOTES.pdfMEASURES OF DISPERSION NOTES.pdf
MEASURES OF DISPERSION NOTES.pdf
LSHERLEYMARY
 
Bateman eq5 d_for uk rasch user group 2014
Bateman eq5 d_for uk rasch user group 2014Bateman eq5 d_for uk rasch user group 2014
Bateman eq5 d_for uk rasch user group 2014
Andrew Bateman
 
Diabetes Presentation updated 12.10.13
Diabetes Presentation updated 12.10.13Diabetes Presentation updated 12.10.13
Diabetes Presentation updated 12.10.13
Cedric Melhy
 
Modelling & Forecasting Project Wenjun Wu
Modelling & Forecasting Project Wenjun WuModelling & Forecasting Project Wenjun Wu
Modelling & Forecasting Project Wenjun Wu
Wu Wenjun
 
Measures of dispersion range qd md
Measures of dispersion range qd mdMeasures of dispersion range qd md
Measures of dispersion range qd md
RekhaChoudhary24
 
Analysis of EQ-VAS and EQ-5D profile data from PROMs
Analysis of EQ-VAS and EQ-5D profile data from PROMsAnalysis of EQ-VAS and EQ-5D profile data from PROMs
Analysis of EQ-VAS and EQ-5D profile data from PROMs
Office of Health Economics
 
sas final presentation delgado (1)
sas final presentation delgado (1)sas final presentation delgado (1)
sas final presentation delgado (1)
Gustavo Delgado
 
What is Binary Logistic Regression Classification and How is it Used in Analy...
What is Binary Logistic Regression Classification and How is it Used in Analy...What is Binary Logistic Regression Classification and How is it Used in Analy...
What is Binary Logistic Regression Classification and How is it Used in Analy...
Smarten Augmented Analytics
 
Digital Wellbeing in Medical Students
Digital Wellbeing in Medical StudentsDigital Wellbeing in Medical Students
Digital Wellbeing in Medical Students
Steve Gallagher
 

Similar to Multivariate models for the diagnosis of depression in primary care (20)

Measures of Dispersion
Measures of DispersionMeasures of Dispersion
Measures of Dispersion
 
Affect of Metabolic Obesity and Body Mass Index in Coronary Artery Diseases
Affect of Metabolic Obesity and Body Mass Index in Coronary Artery DiseasesAffect of Metabolic Obesity and Body Mass Index in Coronary Artery Diseases
Affect of Metabolic Obesity and Body Mass Index in Coronary Artery Diseases
 
Chapter 9Multivariable MethodsObjectives• .docx
Chapter 9Multivariable MethodsObjectives• .docxChapter 9Multivariable MethodsObjectives• .docx
Chapter 9Multivariable MethodsObjectives• .docx
 
Measures of dispersion
Measures of dispersionMeasures of dispersion
Measures of dispersion
 
Metanalysis Lecture
Metanalysis LectureMetanalysis Lecture
Metanalysis Lecture
 
1PPTs-Handout One-An Overview of Descriptive Statistics-Chapter 1_2.pptx
1PPTs-Handout One-An Overview of Descriptive Statistics-Chapter 1_2.pptx1PPTs-Handout One-An Overview of Descriptive Statistics-Chapter 1_2.pptx
1PPTs-Handout One-An Overview of Descriptive Statistics-Chapter 1_2.pptx
 
1 Statistical analysis HypothesisAs mentio
1  Statistical analysis  HypothesisAs mentio1  Statistical analysis  HypothesisAs mentio
1 Statistical analysis HypothesisAs mentio
 
1 Statistical analysis HypothesisAs mentio
1  Statistical analysis  HypothesisAs mentio1  Statistical analysis  HypothesisAs mentio
1 Statistical analysis HypothesisAs mentio
 
Measure of dispersion by Neeraj Bhandari ( Surkhet.Nepal )
Measure of dispersion by Neeraj Bhandari ( Surkhet.Nepal )Measure of dispersion by Neeraj Bhandari ( Surkhet.Nepal )
Measure of dispersion by Neeraj Bhandari ( Surkhet.Nepal )
 
Quantitative Analysis
Quantitative AnalysisQuantitative Analysis
Quantitative Analysis
 
Looking at data
Looking at dataLooking at data
Looking at data
 
MEASURES OF DISPERSION NOTES.pdf
MEASURES OF DISPERSION NOTES.pdfMEASURES OF DISPERSION NOTES.pdf
MEASURES OF DISPERSION NOTES.pdf
 
Bateman eq5 d_for uk rasch user group 2014
Bateman eq5 d_for uk rasch user group 2014Bateman eq5 d_for uk rasch user group 2014
Bateman eq5 d_for uk rasch user group 2014
 
Diabetes Presentation updated 12.10.13
Diabetes Presentation updated 12.10.13Diabetes Presentation updated 12.10.13
Diabetes Presentation updated 12.10.13
 
Modelling & Forecasting Project Wenjun Wu
Modelling & Forecasting Project Wenjun WuModelling & Forecasting Project Wenjun Wu
Modelling & Forecasting Project Wenjun Wu
 
Measures of dispersion range qd md
Measures of dispersion range qd mdMeasures of dispersion range qd md
Measures of dispersion range qd md
 
Analysis of EQ-VAS and EQ-5D profile data from PROMs
Analysis of EQ-VAS and EQ-5D profile data from PROMsAnalysis of EQ-VAS and EQ-5D profile data from PROMs
Analysis of EQ-VAS and EQ-5D profile data from PROMs
 
sas final presentation delgado (1)
sas final presentation delgado (1)sas final presentation delgado (1)
sas final presentation delgado (1)
 
What is Binary Logistic Regression Classification and How is it Used in Analy...
What is Binary Logistic Regression Classification and How is it Used in Analy...What is Binary Logistic Regression Classification and How is it Used in Analy...
What is Binary Logistic Regression Classification and How is it Used in Analy...
 
Digital Wellbeing in Medical Students
Digital Wellbeing in Medical StudentsDigital Wellbeing in Medical Students
Digital Wellbeing in Medical Students
 

Recently uploaded

一比一原版(CU毕业证)卡尔顿大学毕业证如何办理
一比一原版(CU毕业证)卡尔顿大学毕业证如何办理一比一原版(CU毕业证)卡尔顿大学毕业证如何办理
一比一原版(CU毕业证)卡尔顿大学毕业证如何办理
bmucuha
 
Module 1 ppt BIG DATA ANALYTICS_NOTES FOR MCA
Module 1 ppt BIG DATA ANALYTICS_NOTES FOR MCAModule 1 ppt BIG DATA ANALYTICS_NOTES FOR MCA
Module 1 ppt BIG DATA ANALYTICS_NOTES FOR MCA
yuvarajkumar334
 
writing report business partner b1+ .pdf
writing report business partner b1+ .pdfwriting report business partner b1+ .pdf
writing report business partner b1+ .pdf
VyNguyen709676
 
一比一原版(harvard毕业证书)哈佛大学毕业证如何办理
一比一原版(harvard毕业证书)哈佛大学毕业证如何办理一比一原版(harvard毕业证书)哈佛大学毕业证如何办理
一比一原版(harvard毕业证书)哈佛大学毕业证如何办理
taqyea
 
原版一比一利兹贝克特大学毕业证(LeedsBeckett毕业证书)如何办理
原版一比一利兹贝克特大学毕业证(LeedsBeckett毕业证书)如何办理原版一比一利兹贝克特大学毕业证(LeedsBeckett毕业证书)如何办理
原版一比一利兹贝克特大学毕业证(LeedsBeckett毕业证书)如何办理
wyddcwye1
 
DATA COMMS-NETWORKS YR2 lecture 08 NAT & CLOUD.docx
DATA COMMS-NETWORKS YR2 lecture 08 NAT & CLOUD.docxDATA COMMS-NETWORKS YR2 lecture 08 NAT & CLOUD.docx
DATA COMMS-NETWORKS YR2 lecture 08 NAT & CLOUD.docx
SaffaIbrahim1
 
一比一原版(UCSB文凭证书)圣芭芭拉分校毕业证如何办理
一比一原版(UCSB文凭证书)圣芭芭拉分校毕业证如何办理一比一原版(UCSB文凭证书)圣芭芭拉分校毕业证如何办理
一比一原版(UCSB文凭证书)圣芭芭拉分校毕业证如何办理
nuttdpt
 
4th Modern Marketing Reckoner by MMA Global India & Group M: 60+ experts on W...
4th Modern Marketing Reckoner by MMA Global India & Group M: 60+ experts on W...4th Modern Marketing Reckoner by MMA Global India & Group M: 60+ experts on W...
4th Modern Marketing Reckoner by MMA Global India & Group M: 60+ experts on W...
Social Samosa
 
一比一原版(Unimelb毕业证书)墨尔本大学毕业证如何办理
一比一原版(Unimelb毕业证书)墨尔本大学毕业证如何办理一比一原版(Unimelb毕业证书)墨尔本大学毕业证如何办理
一比一原版(Unimelb毕业证书)墨尔本大学毕业证如何办理
xclpvhuk
 
Population Growth in Bataan: The effects of population growth around rural pl...
Population Growth in Bataan: The effects of population growth around rural pl...Population Growth in Bataan: The effects of population growth around rural pl...
Population Growth in Bataan: The effects of population growth around rural pl...
Bill641377
 
A presentation that explain the Power BI Licensing
A presentation that explain the Power BI LicensingA presentation that explain the Power BI Licensing
A presentation that explain the Power BI Licensing
AlessioFois2
 
Challenges of Nation Building-1.pptx with more important
Challenges of Nation Building-1.pptx with more importantChallenges of Nation Building-1.pptx with more important
Challenges of Nation Building-1.pptx with more important
Sm321
 
一比一原版南十字星大学毕业证(SCU毕业证书)学历如何办理
一比一原版南十字星大学毕业证(SCU毕业证书)学历如何办理一比一原版南十字星大学毕业证(SCU毕业证书)学历如何办理
一比一原版南十字星大学毕业证(SCU毕业证书)学历如何办理
slg6lamcq
 
原版一比一弗林德斯大学毕业证(Flinders毕业证书)如何办理
原版一比一弗林德斯大学毕业证(Flinders毕业证书)如何办理原版一比一弗林德斯大学毕业证(Flinders毕业证书)如何办理
原版一比一弗林德斯大学毕业证(Flinders毕业证书)如何办理
a9qfiubqu
 
DSSML24_tspann_CodelessGenerativeAIPipelines
DSSML24_tspann_CodelessGenerativeAIPipelinesDSSML24_tspann_CodelessGenerativeAIPipelines
DSSML24_tspann_CodelessGenerativeAIPipelines
Timothy Spann
 
End-to-end pipeline agility - Berlin Buzzwords 2024
End-to-end pipeline agility - Berlin Buzzwords 2024End-to-end pipeline agility - Berlin Buzzwords 2024
End-to-end pipeline agility - Berlin Buzzwords 2024
Lars Albertsson
 
Predictably Improve Your B2B Tech Company's Performance by Leveraging Data
Predictably Improve Your B2B Tech Company's Performance by Leveraging DataPredictably Improve Your B2B Tech Company's Performance by Leveraging Data
Predictably Improve Your B2B Tech Company's Performance by Leveraging Data
Kiwi Creative
 
Experts live - Improving user adoption with AI
Experts live - Improving user adoption with AIExperts live - Improving user adoption with AI
Experts live - Improving user adoption with AI
jitskeb
 
原版制作(unimelb毕业证书)墨尔本大学毕业证Offer一模一样
原版制作(unimelb毕业证书)墨尔本大学毕业证Offer一模一样原版制作(unimelb毕业证书)墨尔本大学毕业证Offer一模一样
原版制作(unimelb毕业证书)墨尔本大学毕业证Offer一模一样
ihavuls
 
Monthly Management report for the Month of May 2024
Monthly Management report for the Month of May 2024Monthly Management report for the Month of May 2024
Monthly Management report for the Month of May 2024
facilitymanager11
 

Recently uploaded (20)

一比一原版(CU毕业证)卡尔顿大学毕业证如何办理
一比一原版(CU毕业证)卡尔顿大学毕业证如何办理一比一原版(CU毕业证)卡尔顿大学毕业证如何办理
一比一原版(CU毕业证)卡尔顿大学毕业证如何办理
 
Module 1 ppt BIG DATA ANALYTICS_NOTES FOR MCA
Module 1 ppt BIG DATA ANALYTICS_NOTES FOR MCAModule 1 ppt BIG DATA ANALYTICS_NOTES FOR MCA
Module 1 ppt BIG DATA ANALYTICS_NOTES FOR MCA
 
writing report business partner b1+ .pdf
writing report business partner b1+ .pdfwriting report business partner b1+ .pdf
writing report business partner b1+ .pdf
 
一比一原版(harvard毕业证书)哈佛大学毕业证如何办理
一比一原版(harvard毕业证书)哈佛大学毕业证如何办理一比一原版(harvard毕业证书)哈佛大学毕业证如何办理
一比一原版(harvard毕业证书)哈佛大学毕业证如何办理
 
原版一比一利兹贝克特大学毕业证(LeedsBeckett毕业证书)如何办理
原版一比一利兹贝克特大学毕业证(LeedsBeckett毕业证书)如何办理原版一比一利兹贝克特大学毕业证(LeedsBeckett毕业证书)如何办理
原版一比一利兹贝克特大学毕业证(LeedsBeckett毕业证书)如何办理
 
DATA COMMS-NETWORKS YR2 lecture 08 NAT & CLOUD.docx
DATA COMMS-NETWORKS YR2 lecture 08 NAT & CLOUD.docxDATA COMMS-NETWORKS YR2 lecture 08 NAT & CLOUD.docx
DATA COMMS-NETWORKS YR2 lecture 08 NAT & CLOUD.docx
 
一比一原版(UCSB文凭证书)圣芭芭拉分校毕业证如何办理
一比一原版(UCSB文凭证书)圣芭芭拉分校毕业证如何办理一比一原版(UCSB文凭证书)圣芭芭拉分校毕业证如何办理
一比一原版(UCSB文凭证书)圣芭芭拉分校毕业证如何办理
 
4th Modern Marketing Reckoner by MMA Global India & Group M: 60+ experts on W...
4th Modern Marketing Reckoner by MMA Global India & Group M: 60+ experts on W...4th Modern Marketing Reckoner by MMA Global India & Group M: 60+ experts on W...
4th Modern Marketing Reckoner by MMA Global India & Group M: 60+ experts on W...
 
一比一原版(Unimelb毕业证书)墨尔本大学毕业证如何办理
一比一原版(Unimelb毕业证书)墨尔本大学毕业证如何办理一比一原版(Unimelb毕业证书)墨尔本大学毕业证如何办理
一比一原版(Unimelb毕业证书)墨尔本大学毕业证如何办理
 
Population Growth in Bataan: The effects of population growth around rural pl...
Population Growth in Bataan: The effects of population growth around rural pl...Population Growth in Bataan: The effects of population growth around rural pl...
Population Growth in Bataan: The effects of population growth around rural pl...
 
A presentation that explain the Power BI Licensing
A presentation that explain the Power BI LicensingA presentation that explain the Power BI Licensing
A presentation that explain the Power BI Licensing
 
Challenges of Nation Building-1.pptx with more important
Challenges of Nation Building-1.pptx with more importantChallenges of Nation Building-1.pptx with more important
Challenges of Nation Building-1.pptx with more important
 
一比一原版南十字星大学毕业证(SCU毕业证书)学历如何办理
一比一原版南十字星大学毕业证(SCU毕业证书)学历如何办理一比一原版南十字星大学毕业证(SCU毕业证书)学历如何办理
一比一原版南十字星大学毕业证(SCU毕业证书)学历如何办理
 
原版一比一弗林德斯大学毕业证(Flinders毕业证书)如何办理
原版一比一弗林德斯大学毕业证(Flinders毕业证书)如何办理原版一比一弗林德斯大学毕业证(Flinders毕业证书)如何办理
原版一比一弗林德斯大学毕业证(Flinders毕业证书)如何办理
 
DSSML24_tspann_CodelessGenerativeAIPipelines
DSSML24_tspann_CodelessGenerativeAIPipelinesDSSML24_tspann_CodelessGenerativeAIPipelines
DSSML24_tspann_CodelessGenerativeAIPipelines
 
End-to-end pipeline agility - Berlin Buzzwords 2024
End-to-end pipeline agility - Berlin Buzzwords 2024End-to-end pipeline agility - Berlin Buzzwords 2024
End-to-end pipeline agility - Berlin Buzzwords 2024
 
Predictably Improve Your B2B Tech Company's Performance by Leveraging Data
Predictably Improve Your B2B Tech Company's Performance by Leveraging DataPredictably Improve Your B2B Tech Company's Performance by Leveraging Data
Predictably Improve Your B2B Tech Company's Performance by Leveraging Data
 
Experts live - Improving user adoption with AI
Experts live - Improving user adoption with AIExperts live - Improving user adoption with AI
Experts live - Improving user adoption with AI
 
原版制作(unimelb毕业证书)墨尔本大学毕业证Offer一模一样
原版制作(unimelb毕业证书)墨尔本大学毕业证Offer一模一样原版制作(unimelb毕业证书)墨尔本大学毕业证Offer一模一样
原版制作(unimelb毕业证书)墨尔本大学毕业证Offer一模一样
 
Monthly Management report for the Month of May 2024
Monthly Management report for the Month of May 2024Monthly Management report for the Month of May 2024
Monthly Management report for the Month of May 2024
 

Multivariate models for the diagnosis of depression in primary care

  • 1. Introduction Depression, long stigmatized as a complaint of the merely idle or a “case of the blues,” is increasingly accepted in the medical community as a serious and possibly fatal disease if left untreated, but one that can be managed with psychiatric care. For this reason, as well as for the general preservation of the happiness of the patient, it is worthwhile to investigate what factors contribute to a primary care physician diagnosing depression in a patient during a visit. Such an investigation could have all sorts of benefits, such as exposing bias on the part of physicians to under- or over-diagnose depression in particular demographic groups, the level of trust physicians put in various metrics (such as the Beck depression score and the SF-36 self- administered test of mental and physical wellness, both of which are included in the dataset I will be using for this paper). The data is of particular importance as depression in primary care can lead to complications in treatment down the road. Material and Methods This paper will seek to explore the relationships between six explanatory variables (PCS and MCS, the physical and mental components of the SF-36 tests measuring physical and mental health of the patient; BECK, the Beck depression score; PGEND, the patient’s gender; AGE, the patient’s age; and EDUCAT, the number of years of formal schooling) and the binary response variable DAV, where 1 represents a diagnosis of depression. A handful of multivariate techniques immediately suggest themselves when examining the structure of the data, particularly due to the heterogeneity of types of data in the set (DAV, EDUCAT and PGEND are factors, while PCS, MCS, AGE, and BECK are continuous numerical variables). Methods used were Hotelling’s T2 and Wilks’ Lambda tests of the equality of mean vectors, multivariate linear regression, principal component analysis, and a linear discriminant analysis. Results Equality of Means Using Hotelling’s T2 test, I established that at a significance level α=0.95, there was significant evidence (P-value = 1.727e-10) to reject equality of mean vectors between those who had been diagnosed with depression (m1 = 64) and those who had not (m2=336). Using Wilks’ Lambda test, I was further able to establish inequality of mean vectors (p-value = 2.557e-06) across the three education groups (years educated, with factor levels Less than 12 years (n1=61), 12 to 14 years (n2=241), and More than 14 years (n3=90) ). Mean vectors and comparison of results are given below. group: no | group: yes | Hotelling's T^2 vars n mean sd median | vars n mean sd median | -------------------- pcs 1 336 41.54 11.44 41.85 | pcs 1 64 38.77 12.04 38.46 | Test stat: 13.725 mcs 2 336 46.41 11.92 48.81 | mcs 2 64 35.00 13.31 34.63 | Numerator df: 4 beck 3 336 4.66 5.04 3.00 | beck 3 64 9.36 7.15 7.00 | Denominator df: 395 age 4 336 41.89 15.74 38.00 | age 4 64 43.66 13.15 42.00 | P-value: 1.727e-10 --------------------------------------------------------------------------------------- group: Less than 12 years | group: 12-14 years | group: More than 14yr | vars n mean sd median | n mean sd median | n mean sd median | pcs 1 61 39.30 11.00 37.40 | 249 40.60 11.39 40.75 | 90 43.67 12.15 46.42 | mcs 2 61 42.38 13.33 42.74 | 249 44.79 12.48 46.91 | 90 45.50 13.45 48.30 | beck 3 61 7.57 7.59 5.00 | 249 5.13 5.23 4.00 | 90 4.73 5.10 3.50 | age 4 61 50.77 15.48 53.00 | 249 40.58 15.29 36.00 | 90 40.76 13.55 39.00 | ---------------------------------------------------------------------------------------
  • 2. One-way MANOVA (Bartlett Chi2) Wilks' Lambda = 0.90261, Chi2-Value = 40.525, DF = 8.000, p-value = 2.557e-06 sample estimates: pcs mcs beck age 12-14 40.60370 44.79197 5.128514 40.58233 Less than 12 39.29652 42.37531 7.573770 50.77049 More than 14 43.67233 45.49755 4.733333 40.75556 Multivariate Regression Using R, I fit a multivariate regression model to 𝒀𝒀� = 𝑿𝑿𝜷𝜷� + 𝜺𝜺 such that 𝒀𝒀 = � 𝑌𝑌1,1 𝑌𝑌1,2 ⋮ ⋮ 𝑌𝑌400,1 𝑌𝑌400,2 � , 𝑿𝑿 = � 1 𝑋𝑋1,1 𝑋𝑋1,2 𝑋𝑋1,3 ⋮ ⋮ 1 𝑋𝑋400,1 ⋮ ⋮ 𝑋𝑋400,2 𝑋𝑋400,3 � , 𝜷𝜷� = ⎣ ⎢ ⎢ ⎡ 𝛽𝛽0,1 𝛽𝛽1,1 𝛽𝛽0,2 𝛽𝛽1,2 𝛽𝛽2,1 𝛽𝛽3,1 𝛽𝛽2,2 𝛽𝛽3,2⎦ ⎥ ⎥ ⎤ , 𝜺𝜺 ~ 𝑁𝑁(𝟎𝟎, 𝚺𝚺) Where Yi1 and Yi2 are MCS and BECK respectively; Xi1 , Xi2 , and Xi3 are the values of PCS, AGE, and PGEND at a given i, 𝛽𝛽̂𝑖𝑖𝑖𝑖 are the values of the parameter estimates, and 𝜺𝜺 is a (400 x 2) noise matrix. After carrying out Type I and Type II MANOVA tests, however, it would appear that AGE is not doing much of the heavy predictive lifting: Df Hotelling-Lawley approx F num Df den Df Pr(>F) pcs 1 0.088653 17.5089 2 395 5.18e-08 *** age 1 0.003401 0.6717 2 395 0.5113978 pgend 1 0.036114 7.1325 2 395 0.0009057 *** Residuals 396 Type II MANOVA Tests: Pillai test statistic Df test stat approx F num Df den Df Pr(>F) pcs 1 0.079172 16.9808 2 395 8.419e-08 *** age 1 0.002663 0.5274 2 395 0.5905750 pgend 1 0.034855 7.1325 2 395 0.0009057 *** Removal of AGE from the model has very little effect on RSE, R2 or parameter estimates: mcs beck (Intercept) 40.256259297 11.55878014 pcs 0.055235813 -0.11995336 age 0.002945113 -0.01477639 pgend1 4.953358482 -1.52212099 mcs beck (Intercept) 40.40822220 10.7963433 pcs 0.05446585 -0.1160902 pgend1 4.96332993 -1.5721503 Given that this is the case, I felt it reasonable to omit AGE from the final model: 𝒀𝒀� = � 1 𝑥𝑥1,1 𝑥𝑥1,2 ⋮ ⋮ ⋮ 1 𝑥𝑥400,1 𝑥𝑥400,2 � � 40.41 10.80 0.05 −0.12 4.96 −1.57 � + 𝜺𝜺
  • 3. Principal Component Analysis A principal component analysis was mildly successful; after standardizing the three variables PCS, MCS and BECK to be centered at 0 with a standard deviation of 1, principal component analysis was able to explain ~90% of the variation between samples using two linear combinations P1 and P2; this analysis was, however, not particularly useful for classifying diagnosis or failure to diagnose in primary care. A biplot of the data projected on P1 and P2 confirms that there is not much differentiation between higher or lower values of each component depending upon the group to which a subject belongs. The loadings and cumulative contribution to variance for P1, P2 and P3 are given in the output below. Rotation: PC1 PC2 PC3 pcs -0.2994318 -0.93485239 -0.1907659 mcs -0.6552573 0.34681932 -0.6710844 beck 0.6935261 -0.07594322 -0.7164176 [sd] 1.3199826 0.9761081 0.5521403 Importance of components: PC1 PC2 PC3 Standard deviation 1.3200 0.9761 0.5521 Proportion of Variance 0.5808 0.3176 0.1016 Cumulative Proportion 0.5808 0.8984 1.0000
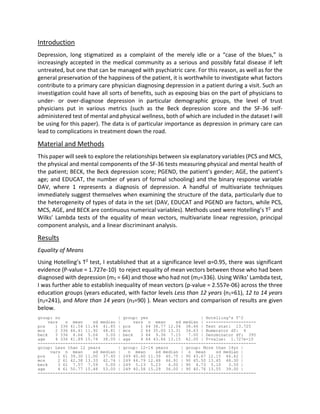
  • 4. Linear Discriminant Analysis Results from LDA were similarly underwhelming; as is evident from the histogram and the scores/classes plots, not very much separation between factor levels could be achieved. The highest density for the group not diagnosed with depression is clearly centered around LDA = -1, but there is no clear highest density for the group diagnosed, and it meanders into the LDA = -1 region as well.
  • 5. Values for the LDA coefficients are given below. lda(dav ~ pcs + mcs + beck + age, data = f.lda) Group means: pcs mcs beck age no 41.53721 46.40679 4.660714 41.89286 yes 38.77215 35.00299 9.359375 43.65625 Coefficients of linear discriminants: LD1 pcs -0.007293228 mcs -0.054224639 beck 0.076986186 age 0.008000076 IV. Discussion The tools of multivariate analysis are quite powerful, though it is clear from some of the results that the utility of these techniques is largely dependent upon the nature of the data being analyzed and the response variable being modeled. Clear differences in mean vectors were demonstrated for two different classification groups (diagnosis and level of education), but the high variability of the continuous predictor variables in the data made PCA and LDA less useful than I might have liked. Still, some separation was achieved, and it was a powerful illustration of how useful these techniques can be.