Download as PDF, PPTX

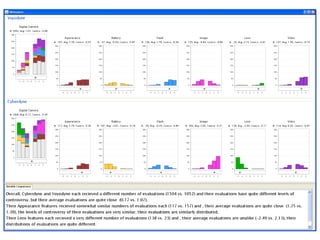


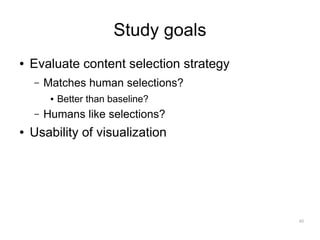
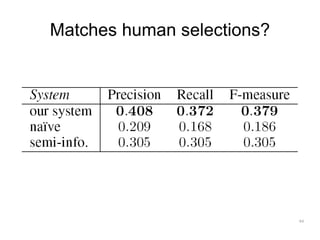
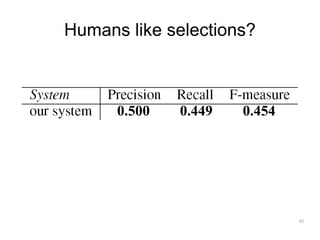
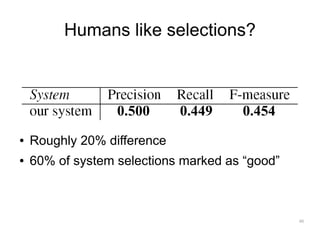
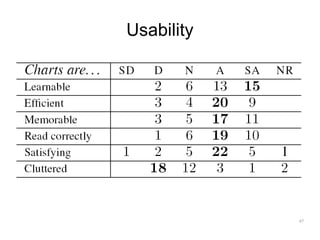
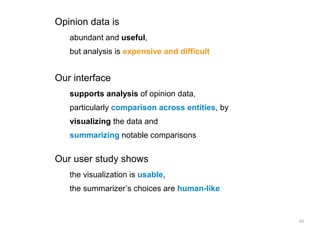

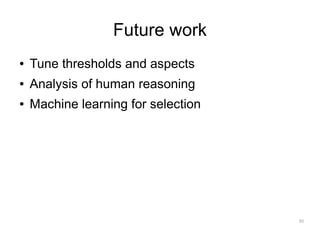
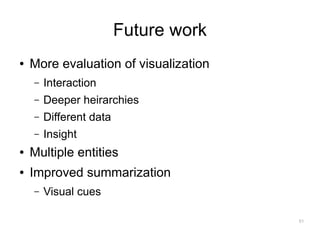
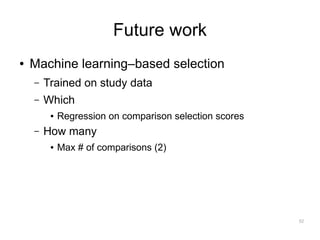
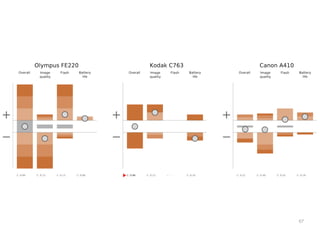
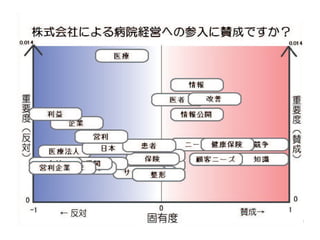
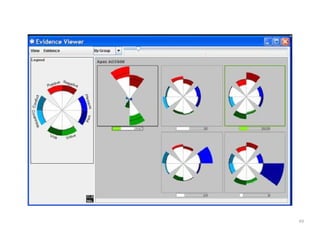
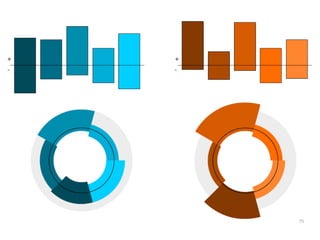
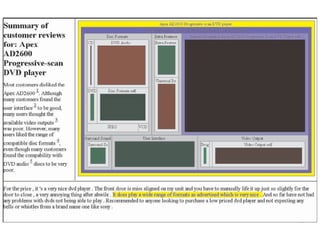

The document discusses a multimedia interface designed to facilitate the analysis and comparison of opinion data across various entities. It highlights the effectiveness of the interface through user studies, indicating that its visualizations are usable and its summarization resembles human-like choices. Future work includes enhancements such as machine learning for selection and deeper evaluations of the visualization aspects.