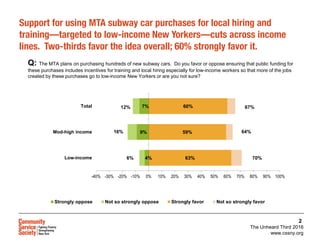
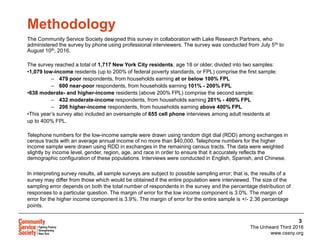
MTA Procurement
and Local Hiring and Training
Nancy Rankin, Vice President for Policy Research and Advocacy
August 2016
The Unheard Third 2016
www.cssny.org
2
4%
9%
7%
6%
16%
12%
63%
59%
60%
70%
64%
67%
-40% -30% -20% -10% 0% 10% 20% 30% 40% 50% 60% 70% 80% 90% 100%
Low-income
Mod-high income
Total
Strongly oppose Not so strongly oppose Strongly favor Not so strongly favor
Q: The MTA plans on purchasing hundreds of new subway cars. Do you favor or oppose ensuring that public funding for
these purchases includes incentives for training and local hiring especially for low-income workers so that more of the jobs
created by these purchases go to low-income New Yorkers or are you not sure?
Support for using MTA subway car purchases for local hiring and
training—targeted to low-income New Yorkers—cuts across income
lines. Two-thirds favor the idea overall; 60% strongly favor it.
The Unheard Third 2016
www.cssny.org
3
The Community Service Society designed this survey in collaboration with Lake Research Partners, who
administered the survey by phone using professional interviewers. The survey was conducted from July 5th to
August 10th, 2016.
The survey reached a total of 1,717 New York City residents, age 18 or older, divided into two samples:
•1,079 low-income residents (up to 200% of federal poverty standards, or FPL) comprise the first sample:
– 479 poor respondents, from households earning at or below 100% FPL
– 600 near-poor respondents, from households earning 101% - 200% FPL
•638 moderate- and higher-income residents (above 200% FPL) comprise the second sample:
– 432 moderate-income respondents, from households earning 201% - 400% FPL
– 206 higher-income respondents, from households earning above 400% FPL
•This year’s survey also included an oversample of 655 cell phone interviews among adult residents at
up to 400% FPL.
Telephone numbers for the low-income sample were drawn using random digit dial (RDD) among exchanges in
census tracts with an average annual income of no more than $40,000. Telephone numbers for the higher
income sample were drawn using RDD in exchanges in the remaining census tracts. The data were weighted
slightly by income level, gender, region, age, and race in order to ensure that it accurately reflects the
demographic configuration of these populations. Interviews were conducted in English, Spanish, and Chinese.
In interpreting survey results, all sample surveys are subject to possible sampling error; that is, the results of a
survey may differ from those which would be obtained if the entire population were interviewed. The size of the
sampling error depends on both the total number of respondents in the survey and the percentage distribution of
responses to a particular question. The margin of error for the low income component is 3.0%. The margin of
error for the higher income component is 3.9%. The margin of error for the entire sample is +/- 2.36 percentage
points.
Methodology

MTA Procurement and Local Hiring and Training

  • 1.
    MTA Procurement and LocalHiring and Training Nancy Rankin, Vice President for Policy Research and Advocacy August 2016
  • 2.
    The Unheard Third2016 www.cssny.org 2 4% 9% 7% 6% 16% 12% 63% 59% 60% 70% 64% 67% -40% -30% -20% -10% 0% 10% 20% 30% 40% 50% 60% 70% 80% 90% 100% Low-income Mod-high income Total Strongly oppose Not so strongly oppose Strongly favor Not so strongly favor Q: The MTA plans on purchasing hundreds of new subway cars. Do you favor or oppose ensuring that public funding for these purchases includes incentives for training and local hiring especially for low-income workers so that more of the jobs created by these purchases go to low-income New Yorkers or are you not sure? Support for using MTA subway car purchases for local hiring and training—targeted to low-income New Yorkers—cuts across income lines. Two-thirds favor the idea overall; 60% strongly favor it.
  • 3.
    The Unheard Third2016 www.cssny.org 3 The Community Service Society designed this survey in collaboration with Lake Research Partners, who administered the survey by phone using professional interviewers. The survey was conducted from July 5th to August 10th, 2016. The survey reached a total of 1,717 New York City residents, age 18 or older, divided into two samples: •1,079 low-income residents (up to 200% of federal poverty standards, or FPL) comprise the first sample: – 479 poor respondents, from households earning at or below 100% FPL – 600 near-poor respondents, from households earning 101% - 200% FPL •638 moderate- and higher-income residents (above 200% FPL) comprise the second sample: – 432 moderate-income respondents, from households earning 201% - 400% FPL – 206 higher-income respondents, from households earning above 400% FPL •This year’s survey also included an oversample of 655 cell phone interviews among adult residents at up to 400% FPL. Telephone numbers for the low-income sample were drawn using random digit dial (RDD) among exchanges in census tracts with an average annual income of no more than $40,000. Telephone numbers for the higher income sample were drawn using RDD in exchanges in the remaining census tracts. The data were weighted slightly by income level, gender, region, age, and race in order to ensure that it accurately reflects the demographic configuration of these populations. Interviews were conducted in English, Spanish, and Chinese. In interpreting survey results, all sample surveys are subject to possible sampling error; that is, the results of a survey may differ from those which would be obtained if the entire population were interviewed. The size of the sampling error depends on both the total number of respondents in the survey and the percentage distribution of responses to a particular question. The margin of error for the low income component is 3.0%. The margin of error for the higher income component is 3.9%. The margin of error for the entire sample is +/- 2.36 percentage points. Methodology