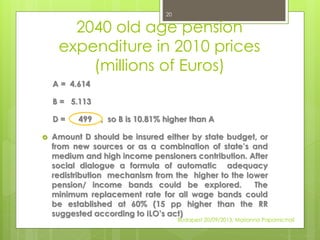
Measurements of
Adequacy and
Sustainability.
Mechanisms of
redistribution and
financing against
poverty
Adequacy:
“As long as no reliable prospective income
indicators exist, which allow one to one to evaluate
the effect of more structural changes on future
benefits, the rather short term policy-making process
may favour the principal of financial sustainability.”
Eckart 2005
2
Budapest 20/09/2013, Marianna Papamichail
Sustainability:
Financial sustainability after crisis has proclaimed
as the major issue in the European Union.
Unfortunately citizens and politicians were unwilling
to deal with the matter before head contributing to
inflating its final austerity impact.
3
Budapest 20/09/2013, Marianna Papamichail
Measurements of Adequacy
Pros and Cons
4
Budapest 20/09/2013, Marianna Papamichail
Advantages Disadvantages Greece
Theoretical Replacement
Ratio,
TRR
Numerous cases can be
examined e.g. wage profile,
career profile, age profile
cases are data
sensitive, lack of
data
isolated cases
static
Benefit Ratio, BR global indice too compact
serves also as sustainability
measurement
General Average
Replacement Ratio, GARR
global indice
poverty issues not
captured
35%**
Net Pension Wealth/Net
Pension Wealth Requirement
to remain out of risk of
poverty (1)
poverty issues well captured case sensitive
sustainability issues can be
examined
fully comparable between
countries
not representative,
e.g. Greece
100%*
40%**
72%***
(1) Net pension wealth
Budapest 20/09/2013, Marianna
Papamichail
5
Net Pension Wealth =
Net Pension Wealth requirement to
remain out of the risk of poverty =
o The net pension wealth is measured at age a values
a : active’s current age
h : retirement age
W : termination age of life table
Bs(h) : pension expected at age (s) attributed for the first time at
age h
Povs(h) : amount of poverty threshold expected at ages (s)
i.e. after retirement
: probability of an individual aged a to survive until the age s
Budapest 20/09/2013, Marianna Papamichail
6
o Assumptions for the calculation of the net pension wealth:
 Average age of active in 2010 = 36
 Average retirement age in 2040 = 66
 Termination age of life table =100
 Net pension = 90% of gross pension
 Density = 80%
Bs(h) is indexed by the pension indexation while Povs(h) is indexed
by the wage indexation. So in 2040, when the individual retires, the
ratio of initial pension to poverty threshold is 94% while the final
ratio over the long run capturing all pensionable life of pension
wealth drops to 72%
Budapest 20/09/2013, Marianna Papamichail
7
Observed inequalities between
Genders: Males and females
Generations: Individuals employed
before 1993 and after 1992
Ages: People of different ages
Income Inequality between
employees in 2010
8
Budapest 20/09/2013, Marianna Papamichail
For any particular group the gap between the
poorer and the wealthier of each group is
defined here as the ratio of the wage of
earners belonging to the 10% highest
percentile to that of the lowest 10%
percentile. The bigger the inequality gap
between the poorer and the wealthier
employees the more significant the
adequacy issue between future pensioners.
Income Inequality between
employees in 2010
9
Budapest 20/09/2013, Marianna Papamichail
Figures from examined groups:
1. Men pre 1993, wage gap =9
10
-5000
0
5000
10000
15000
20000
25000
15-25
26-35
36-45
46-55
56-65
66-76
Gross salary distribution Males Pre 1993Gross salary distribution Males Pre 1993Gross salary distribution Males Pre 1993
Average salary = 16.000,00 euros
Budapest 20/09/2013, Marianna Papamichail
Figures from examined groups:
2. Women pre 1993, wage gap = 7,8
11
0
2000
4000
6000
8000
10000
12000
15-25 26-35
36-45 46-55
56-65 66-76
Gross salary distribution Females Pre 1993
16.000,00 euros
Budapest 20/09/2013, Marianna Papamichail
Figures from examined groups:
3. Men post 1992, wage gap = 10
12
0
5000
10000
15000
20000
25000
15-25 26-35
36-45 46-55
56-65 66-76
Males Post 1992Gross salary distribution Males Post 1992
13.300,00 euros
Budapest 20/09/2013, Marianna Papamichail
Figures from examined groups:
4. Women post 1992, wage gap = 8
13
0
5000
10000
15000
20000
25000
30000
35000
15-25 26-35
36-45 46-55
56-65 66-76
Gross salary distribution Females Post 1992
13.300,00 euros
Budapest 20/09/2013, Marianna Papamichail
Poverty threshold in 2010 =
= 60% of Median Income = 6.591 Euros
Median Income is 10.985 Euros
Poor income earners: of income* below 6.591 Euros
Medium income earners: of income between 6.591 and
10.985 Euros (median income)
High income earners: of income higher than 10.985 Euros
Measuring poverty between
employees and pensioners
14
Budapest 20/09/2013, Marianna Papamichail
Poverty between employees
in 2010
15
males pre females pre males post females post
Active population at
risk of poverty
percentages
5 % 12 % 31 % 38 %
Average gross annual
wage of poor
employees
3.600,00 € 3.700,00 € 3.315,00 € 3.460,00 €
Budapest 20/09/2013, Marianna Papamichail
Poverty between pensioners in
2040
16
males pre females pre males post females post
Pensioners’
population at risk of
poverty percentages
42 % 40 % 67 % 87 %
Average gross annual
pension of poor
pensioners in 2010
prices
5.960,00 € 5.902,00 € 5.869,00 € 5.887,00 €
Budapest 20/09/2013, Marianna Papamichail
 Mandatory measure also adequacy in in
sustainability studies by using common indicators
 Develop representative replacement ratios
weighed according to groups of people
included
 Explore possibilities to tackle poverty and
quantify amounts required
 Explore the potential use of redistribution
mechanisms from high to low come earners
How to overcome
constraints in measuring adequacy
along with sustainability
17
Budapest 20/09/2013, Marianna Papamichail
Example: The exercise
 Establish three (or more) wage bands reflecting
actual poverty thresholds (indigence etc.) as
follows
 Low: Below poverty threshold
 Medium: Of median income
 High: Over median income
18
Budapest 20/09/2013, Marianna Papamichail
19
 Two pension old age expenditure results in 2040 are compared
1. Without any change, A
2. By shifting poor pensions to poverty line, B
 Quantified additional amount required for poverty alleviation in
2040 is the difference of the pension expenditures: D = B-A
 Propose an automatic adequacy redistribution from the
higher to the lower pension/ income bands according to the
replacement ratio. The upper limit could be established at 60%
(15 pp more than the suggested RR according to ILO’s act)
Methodological approach
Budapest 20/09/2013, Marianna Papamichail
20
A = 4.614
B = 5.113
D = 499 , so B is 10.81% higher than A
 Amount D should be insured either by state budget, or
from new sources or as a combination of state’s and
medium and high income pensioners contribution. After
social dialogue a formula of automatic adequacy
redistribution mechanism from the higher to the lower
pension/ income bands could be explored. The
minimum replacement rate for all wage bands could
be established at 60% (15 pp higher than the RR
suggested according to ILO’s act)
2040 old age pension
expenditure in 2010 prices
(millions of Euros)
Budapest 20/09/2013, Marianna Papamichail
21
Budapest 20/09/2013, Marianna Papamichail
Comparison of
pensioners'
income zones
2010-2040
Numberof
pensioners
Amount of icome
zone benefits in
millions Euros
Average icome
zone benefit
Income zone
population
percentage
Ratio of
income zone
benefits to
total
2010 1.363 8,58€ 6.296,08€ 0,34% 0,27%
2040 341.043 2.012,91€ 5.902,23€ 55,20% 43,62%
2010 12.497 94,10€ 7.529,61€ 3,10% 2,96%
2040 210.792 1.875,61€ 8.044,15€ 34,12% 40,65%
2010 389.841 3.071,42€ 7.878,67€ 96,57% 96,77%
2040 66.045 725,62€ 10.986,73€ 10,69% 15,73%
POOR, up to 6.591,00Euros (poverty line)
MEDIUM, from 6.592,00Euros to 10.985,00Euros
HIGH, from 10.986,00Euros and over
prices are in 2010 values
Sustainability or adequacy?
ADQ more reliable
measurements
should start being
developed
SUSTAINABILITY
should focus on
income and on
adequacy
22
sustainadequacy
Budapest 20/09/2013, Marianna Papamichail
References:
 How best to measure pension adequacy
Aaron George Grech, April 2013
 The 2012 Ageing Report,
European Commission 2/2012
 Pension Adequacy in the European
Union 2010-2050
Budapest 20/09/2013, Marianna
Papamichail
23
Thank you
24
Budapest 20/09/2013, Marianna Papamichail

M_PAPAMICHAIL

  • 1.
    Measurements of Adequacy and Sustainability. Mechanismsof redistribution and financing against poverty
  • 2.
    Adequacy: “As long asno reliable prospective income indicators exist, which allow one to one to evaluate the effect of more structural changes on future benefits, the rather short term policy-making process may favour the principal of financial sustainability.” Eckart 2005 2 Budapest 20/09/2013, Marianna Papamichail
  • 3.
    Sustainability: Financial sustainability aftercrisis has proclaimed as the major issue in the European Union. Unfortunately citizens and politicians were unwilling to deal with the matter before head contributing to inflating its final austerity impact. 3 Budapest 20/09/2013, Marianna Papamichail
  • 4.
    Measurements of Adequacy Prosand Cons 4 Budapest 20/09/2013, Marianna Papamichail Advantages Disadvantages Greece Theoretical Replacement Ratio, TRR Numerous cases can be examined e.g. wage profile, career profile, age profile cases are data sensitive, lack of data isolated cases static Benefit Ratio, BR global indice too compact serves also as sustainability measurement General Average Replacement Ratio, GARR global indice poverty issues not captured 35%** Net Pension Wealth/Net Pension Wealth Requirement to remain out of risk of poverty (1) poverty issues well captured case sensitive sustainability issues can be examined fully comparable between countries not representative, e.g. Greece 100%* 40%** 72%***
  • 5.
    (1) Net pensionwealth Budapest 20/09/2013, Marianna Papamichail 5 Net Pension Wealth = Net Pension Wealth requirement to remain out of the risk of poverty =
  • 6.
    o The netpension wealth is measured at age a values a : active’s current age h : retirement age W : termination age of life table Bs(h) : pension expected at age (s) attributed for the first time at age h Povs(h) : amount of poverty threshold expected at ages (s) i.e. after retirement : probability of an individual aged a to survive until the age s Budapest 20/09/2013, Marianna Papamichail 6
  • 7.
    o Assumptions forthe calculation of the net pension wealth:  Average age of active in 2010 = 36  Average retirement age in 2040 = 66  Termination age of life table =100  Net pension = 90% of gross pension  Density = 80% Bs(h) is indexed by the pension indexation while Povs(h) is indexed by the wage indexation. So in 2040, when the individual retires, the ratio of initial pension to poverty threshold is 94% while the final ratio over the long run capturing all pensionable life of pension wealth drops to 72% Budapest 20/09/2013, Marianna Papamichail 7
  • 8.
    Observed inequalities between Genders:Males and females Generations: Individuals employed before 1993 and after 1992 Ages: People of different ages Income Inequality between employees in 2010 8 Budapest 20/09/2013, Marianna Papamichail
  • 9.
    For any particulargroup the gap between the poorer and the wealthier of each group is defined here as the ratio of the wage of earners belonging to the 10% highest percentile to that of the lowest 10% percentile. The bigger the inequality gap between the poorer and the wealthier employees the more significant the adequacy issue between future pensioners. Income Inequality between employees in 2010 9 Budapest 20/09/2013, Marianna Papamichail
  • 10.
    Figures from examinedgroups: 1. Men pre 1993, wage gap =9 10 -5000 0 5000 10000 15000 20000 25000 15-25 26-35 36-45 46-55 56-65 66-76 Gross salary distribution Males Pre 1993Gross salary distribution Males Pre 1993Gross salary distribution Males Pre 1993 Average salary = 16.000,00 euros Budapest 20/09/2013, Marianna Papamichail
  • 11.
    Figures from examinedgroups: 2. Women pre 1993, wage gap = 7,8 11 0 2000 4000 6000 8000 10000 12000 15-25 26-35 36-45 46-55 56-65 66-76 Gross salary distribution Females Pre 1993 16.000,00 euros Budapest 20/09/2013, Marianna Papamichail
  • 12.
    Figures from examinedgroups: 3. Men post 1992, wage gap = 10 12 0 5000 10000 15000 20000 25000 15-25 26-35 36-45 46-55 56-65 66-76 Males Post 1992Gross salary distribution Males Post 1992 13.300,00 euros Budapest 20/09/2013, Marianna Papamichail
  • 13.
    Figures from examinedgroups: 4. Women post 1992, wage gap = 8 13 0 5000 10000 15000 20000 25000 30000 35000 15-25 26-35 36-45 46-55 56-65 66-76 Gross salary distribution Females Post 1992 13.300,00 euros Budapest 20/09/2013, Marianna Papamichail
  • 14.
    Poverty threshold in2010 = = 60% of Median Income = 6.591 Euros Median Income is 10.985 Euros Poor income earners: of income* below 6.591 Euros Medium income earners: of income between 6.591 and 10.985 Euros (median income) High income earners: of income higher than 10.985 Euros Measuring poverty between employees and pensioners 14 Budapest 20/09/2013, Marianna Papamichail
  • 15.
    Poverty between employees in2010 15 males pre females pre males post females post Active population at risk of poverty percentages 5 % 12 % 31 % 38 % Average gross annual wage of poor employees 3.600,00 € 3.700,00 € 3.315,00 € 3.460,00 € Budapest 20/09/2013, Marianna Papamichail
  • 16.
    Poverty between pensionersin 2040 16 males pre females pre males post females post Pensioners’ population at risk of poverty percentages 42 % 40 % 67 % 87 % Average gross annual pension of poor pensioners in 2010 prices 5.960,00 € 5.902,00 € 5.869,00 € 5.887,00 € Budapest 20/09/2013, Marianna Papamichail
  • 17.
     Mandatory measurealso adequacy in in sustainability studies by using common indicators  Develop representative replacement ratios weighed according to groups of people included  Explore possibilities to tackle poverty and quantify amounts required  Explore the potential use of redistribution mechanisms from high to low come earners How to overcome constraints in measuring adequacy along with sustainability 17 Budapest 20/09/2013, Marianna Papamichail
  • 18.
    Example: The exercise Establish three (or more) wage bands reflecting actual poverty thresholds (indigence etc.) as follows  Low: Below poverty threshold  Medium: Of median income  High: Over median income 18 Budapest 20/09/2013, Marianna Papamichail
  • 19.
    19  Two pensionold age expenditure results in 2040 are compared 1. Without any change, A 2. By shifting poor pensions to poverty line, B  Quantified additional amount required for poverty alleviation in 2040 is the difference of the pension expenditures: D = B-A  Propose an automatic adequacy redistribution from the higher to the lower pension/ income bands according to the replacement ratio. The upper limit could be established at 60% (15 pp more than the suggested RR according to ILO’s act) Methodological approach Budapest 20/09/2013, Marianna Papamichail
  • 20.
    20 A = 4.614 B= 5.113 D = 499 , so B is 10.81% higher than A  Amount D should be insured either by state budget, or from new sources or as a combination of state’s and medium and high income pensioners contribution. After social dialogue a formula of automatic adequacy redistribution mechanism from the higher to the lower pension/ income bands could be explored. The minimum replacement rate for all wage bands could be established at 60% (15 pp higher than the RR suggested according to ILO’s act) 2040 old age pension expenditure in 2010 prices (millions of Euros) Budapest 20/09/2013, Marianna Papamichail
  • 21.
    21 Budapest 20/09/2013, MariannaPapamichail Comparison of pensioners' income zones 2010-2040 Numberof pensioners Amount of icome zone benefits in millions Euros Average icome zone benefit Income zone population percentage Ratio of income zone benefits to total 2010 1.363 8,58€ 6.296,08€ 0,34% 0,27% 2040 341.043 2.012,91€ 5.902,23€ 55,20% 43,62% 2010 12.497 94,10€ 7.529,61€ 3,10% 2,96% 2040 210.792 1.875,61€ 8.044,15€ 34,12% 40,65% 2010 389.841 3.071,42€ 7.878,67€ 96,57% 96,77% 2040 66.045 725,62€ 10.986,73€ 10,69% 15,73% POOR, up to 6.591,00Euros (poverty line) MEDIUM, from 6.592,00Euros to 10.985,00Euros HIGH, from 10.986,00Euros and over prices are in 2010 values
  • 22.
    Sustainability or adequacy? ADQmore reliable measurements should start being developed SUSTAINABILITY should focus on income and on adequacy 22 sustainadequacy Budapest 20/09/2013, Marianna Papamichail
  • 23.
    References:  How bestto measure pension adequacy Aaron George Grech, April 2013  The 2012 Ageing Report, European Commission 2/2012  Pension Adequacy in the European Union 2010-2050 Budapest 20/09/2013, Marianna Papamichail 23
  • 24.

Editor's Notes

  • #5 Sources: *Adequacy Report 2012 ** Ageing Report 2012 *** Own calculation of an average career individual weighed between two genders (1)
  • #13 Remove entrenched perceptions of competent authorities HARMONIZATION 1ST PILLAR, SOCIAL AND LABOUR LAWS
  • #15 *Income is considered the amount of salary or pension respectively
  • #17 All these previously active people in 2010 finally received a little over the minimum pension in 2040 ie 5.300 euros
  • #21 Remark: the wider the projection horizon the higher the additional amount required to alleviate poverty risk due to the indexation
  • #23 DC Most from balance sheets, individual accounts, DB (Are they really a good veichle for CB activity… No), pension pooling, benefits do not depend on return, employer contribution rate increase due to poor market returns