Mount polley tailings dam failure, BC, Canada, Aug. 4th 2014
•
1 like•990 views

Some rational considerations on Mount Polley Tailings Dam Failure. Discussion on foreseeability of dams failures, long term care, corporate and social risk tolerability.

Recommended
More Related Content
Viewers also liked
Viewers also liked (16)
More from Oboni Riskope Associates Inc.
More from Oboni Riskope Associates Inc. (20)
Recently uploaded
Recently uploaded (20)
Mount polley tailings dam failure, BC, Canada, Aug. 4th 2014
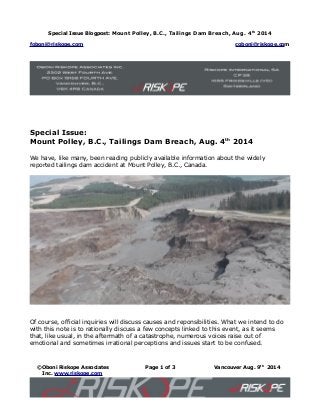
- 1. Special Issue Blogpost: Mount Polley, B.C., Tailings Dam Breach, Aug. 4th 2014 foboni@riskope.com coboni@riskope.com Special Issue: Mount Polley, B.C., Tailings Dam Breach, Aug. 4th 2014 We have, like many, been reading publicly available information about the widely reported tailings dam accident at Mount Polley, B.C., Canada. Of course, official inquiries will discuss causes and reponsibilities. What we intend to do with this note is to rationally discuss a few concepts linked to this event, as it seems that, like usual, in the aftermath of a catastrophe, numerous voices raise out of emotional and sometimes irrational perceptions and issues start to be confused. ©Oboni Riskope Associates Inc. www.riskope.com Page 1 of 3 Vancouver Aug. 9th 2014
- 2. Special Issue Blogpost: Mount Polley, B.C., Tailings Dam Breach, Aug. 4th 2014 foboni@riskope.com coboni@riskope.com In a paper we wrote in 2012 (see our blog http://www.riskope.com/2014/01/09/aspects- of-risk-tolerability-manageable-vs-unmanageable-risks-in-relation-to-critical-decisions- perpetuity-projects-public-opposition/ and download the paper http://www.riskope.com/wp-content/uploads/2013/06/Factual-and-Foreseeable- Reliability-of-Tailings-Dams-and-Nuclear-Reactors-a-Societal-Acceptability-Perspective.pdf ) we evaluated the world-wide rate of failures (major accidents only) of tailings dams and nuclear reactors. We used published records and statistics from reputable sources. We noted that “major tailings accidents” are/were only fuzzily defined (generally it seems that the bigger the outflow of material from the breached dam, the bigger the mediatic impact), contrary to other hazardous industries (nuclear, for example). On a portfolio of approximately 3,500 tailings dams world-wide we evaluated that in the decade around 1979 (1974-1984) the rate of failure was 10-3 (one dam in one thousand per annum on average) and the decade around 1999 (1994-2004) the rate of failure was 2*10-4 (two dams in ten thousand per annum on average). Those numbers mean respectively 3.5 major dams breach in average per year (1974-1984), 0.7 major dams breach in average per year (1994-2004). With those averages one could easily evaluate the probability of having more failures in one year, but we will leave this aside, for the moment. Again, we do not know if 3,500 is still correct, but we assume it is for the sake of the discussion, and there is no clear definition of what a major breach is, so we assume these are the most widely reported failures, that reach even non expert public through media exposure. The validity of the 3.5-0.7 range can easily be “verified” by looking at the Chronology of major tailings dam failures as published, for example, by Wise-Uranium in their website. As such, the decrease from 3.5 to 0.7 can be seen as an indicator of the mining industry performing overall a better job today than it did in the past, but we will also leave this discussion to another time. Many hazardous industries (chemical, electrical, for example) around the world consider the limit of credibility for an accident at a probability in the range of 10-5 to 10-6 (one in hundred thousand to one in a million). By the way, hydro dams have historic record of failure floating around the credibility threshold. Thus tailings dams are to be considered more hazardous than hydro dams, and they unfortunately cannot be breached at the end of service life: they have to stay there “forever”. Obviously, with the estimated values of the prior paragraph, major tailings dams breaches are to be considered way above credibility now, and more so, in the longer run, although long term consolidation may help a bit. ©Oboni Riskope Associates Inc. www.riskope.com Page 2 of 3 Vancouver Aug. 9th 2014
- 3. Special Issue Blogpost: Mount Polley, B.C., Tailings Dam Breach, Aug. 4th 2014 foboni@riskope.com coboni@riskope.com There are, of course, ways to build and manage dams at levels of care that would reduce the probability of major failures to the credibility threshold and we have already demonstrated how this is possible in the short term. For the long term, including perpetual care, we are publishing a paper and presenting a short course at the next Tailings and Mine Waste 2014 conference in Keystone, Colorado with our friend Jack Caldwell. Finally we would like to touch on the theme of risk tolerability (tolerance) both from the social and from the corporate point of view. Understanding social and corporate tolerability (tolerance) to risk is an essential skill for governance and effective leadership (http://www.riskope.com/wp-content/uploads/2013/06/Riskope-Aspects-of-Risk- Tolerability-Manageable-vs.-Unmanageable-Risks-in-Relation-to-Governance-and- Effective-Leadership.pdf ), one that effectively reduces knee-jerk reactions and crisis potential in the aftermath of an accident. Unfortunately, common practice approaches in the risk assessment/management arena use misleading tools such as Probability Impact Graphs (PIGs, FMEA) that mask the reality of tolerance thresholds behind binning exercises with multicoloured (and arbitrary) matrices. Misleading risk assessments (http://www.riskope.com/wp-content/uploads/Can-We-Stop-Misrepresenting-Reality-to- the-Public.pdf ) lead to wrong decisions, improper allotment of mitigative funds and anger the public. Proper tools exist, rational concepts have been laid out by many. It is possible to get out of the rut of obsolete and misleading methods, avoiding future routs! ©Oboni Riskope Associates Inc. www.riskope.com Page 3 of 3 Vancouver Aug. 9th 2014