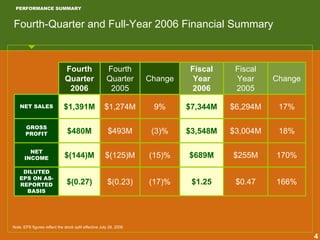
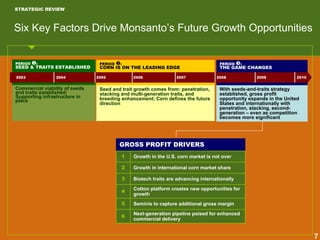
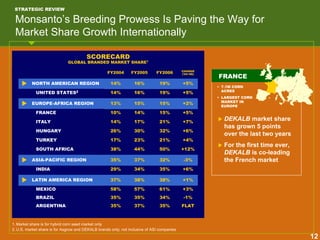
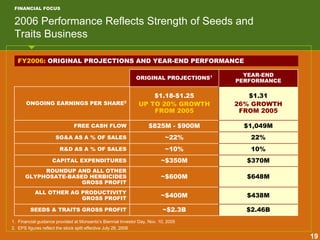
This document provides a financial summary and strategic review for Monsanto for the fourth quarter and full year of 2006. Some key points:
- Net sales for Q4 2006 were $1.39 billion, up 9% from Q4 2005. Full year 2006 net sales were $7.34 billion, up 17% from 2005.
- Reported EPS for Q4 2006 was $-0.27 per share, down 17% from Q4 2005. Full year 2006 reported EPS was $1.25 per share, up 166% from 2005.
- The company achieved market share gains in key crops like US corn and soybeans as well as international markets like France and Italy.
- Opportunities for continued
how to sell pi coins at high rate quickly.DOT TECH
Where can I sell my pi coins at a high rate.
Pi is not launched yet on any exchange. But one can easily sell his or her pi coins to investors who want to hold pi till mainnet launch.
This means crypto whales want to hold pi. And you can get a good rate for selling pi to them. I will leave the telegram contact of my personal pi vendor below.
A vendor is someone who buys from a miner and resell it to a holder or crypto whale.
Here is the telegram contact of my vendor:
@Pi_vendor_247
how to sell pi coins effectively (from 50 - 100k pi)DOT TECH
Anywhere in the world, including Africa, America, and Europe, you can sell Pi Network Coins online and receive cash through online payment options.
Pi has not yet been launched on any exchange because we are currently using the confined Mainnet. The planned launch date for Pi is June 28, 2026.
Reselling to investors who want to hold until the mainnet launch in 2026 is currently the sole way to sell.
Consequently, right now. All you need to do is select the right pi network provider.
Who is a pi merchant?
An individual who buys coins from miners on the pi network and resells them to investors hoping to hang onto them until the mainnet is launched is known as a pi merchant.
debuts.
I'll provide you the Telegram username
@Pi_vendor_247
Exploring Abhay Bhutada’s Views After Poonawalla Fincorp’s Collaboration With...beulahfernandes8
The financial landscape in India has witnessed a significant development with the recent collaboration between Poonawalla Fincorp and IndusInd Bank.
The launch of the co-branded credit card, the IndusInd Bank Poonawalla Fincorp eLITE RuPay Platinum Credit Card, marks a major milestone for both entities.
This strategic move aims to redefine and elevate the banking experience for customers.
Empowering the Unbanked: The Vital Role of NBFCs in Promoting Financial Inclu...Vighnesh Shashtri
In India, financial inclusion remains a critical challenge, with a significant portion of the population still unbanked. Non-Banking Financial Companies (NBFCs) have emerged as key players in bridging this gap by providing financial services to those often overlooked by traditional banking institutions. This article delves into how NBFCs are fostering financial inclusion and empowering the unbanked.
How to get verified on Coinbase Account?_.docxBuy bitget
t's important to note that buying verified Coinbase accounts is not recommended and may violate Coinbase's terms of service. Instead of searching to "buy verified Coinbase accounts," follow the proper steps to verify your own account to ensure compliance and security.
when will pi network coin be available on crypto exchange.DOT TECH
There is no set date for when Pi coins will enter the market.
However, the developers are working hard to get them released as soon as possible.
Once they are available, users will be able to exchange other cryptocurrencies for Pi coins on designated exchanges.
But for now the only way to sell your pi coins is through verified pi vendor.
Here is the telegram contact of my personal pi vendor
@Pi_vendor_247
BYD SWOT Analysis and In-Depth Insights 2024.pptxmikemetalprod
Indepth analysis of the BYD 2024
BYD (Build Your Dreams) is a Chinese automaker and battery manufacturer that has snowballed over the past two decades to become a significant player in electric vehicles and global clean energy technology.
This SWOT analysis examines BYD's strengths, weaknesses, opportunities, and threats as it competes in the fast-changing automotive and energy storage industries.
Founded in 1995 and headquartered in Shenzhen, BYD started as a battery company before expanding into automobiles in the early 2000s.
Initially manufacturing gasoline-powered vehicles, BYD focused on plug-in hybrid and fully electric vehicles, leveraging its expertise in battery technology.
Today, BYD is the world’s largest electric vehicle manufacturer, delivering over 1.2 million electric cars globally. The company also produces electric buses, trucks, forklifts, and rail transit.
On the energy side, BYD is a major supplier of rechargeable batteries for cell phones, laptops, electric vehicles, and energy storage systems.
how to sell pi coins in all Africa Countries.DOT TECH
Yes. You can sell your pi network for other cryptocurrencies like Bitcoin, usdt , Ethereum and other currencies And this is done easily with the help from a pi merchant.
What is a pi merchant ?
Since pi is not launched yet in any exchange. The only way you can sell right now is through merchants.
A verified Pi merchant is someone who buys pi network coins from miners and resell them to investors looking forward to hold massive quantities of pi coins before mainnet launch in 2026.
I will leave the telegram contact of my personal pi merchant to trade with.
@Pi_vendor_247
Falcon stands out as a top-tier P2P Invoice Discounting platform in India, bridging esteemed blue-chip companies and eager investors. Our goal is to transform the investment landscape in India by establishing a comprehensive destination for borrowers and investors with diverse profiles and needs, all while minimizing risk. What sets Falcon apart is the elimination of intermediaries such as commercial banks and depository institutions, allowing investors to enjoy higher yields.
Currently pi network is not tradable on binance or any other exchange because we are still in the enclosed mainnet.
Right now the only way to sell pi coins is by trading with a verified merchant.
What is a pi merchant?
A pi merchant is someone verified by pi network team and allowed to barter pi coins for goods and services.
Since pi network is not doing any pre-sale The only way exchanges like binance/huobi or crypto whales can get pi is by buying from miners. And a merchant stands in between the exchanges and the miners.
I will leave the telegram contact of my personal pi merchant. I and my friends has traded more than 6000pi coins successfully
Tele-gram
@Pi_vendor_247
USDA Loans in California: A Comprehensive Overview.pptxmarketing367770
USDA Loans in California: A Comprehensive Overview
If you're dreaming of owning a home in California's rural or suburban areas, a USDA loan might be the perfect solution. The U.S. Department of Agriculture (USDA) offers these loans to help low-to-moderate-income individuals and families achieve homeownership.
Key Features of USDA Loans:
Zero Down Payment: USDA loans require no down payment, making homeownership more accessible.
Competitive Interest Rates: These loans often come with lower interest rates compared to conventional loans.
Flexible Credit Requirements: USDA loans have more lenient credit score requirements, helping those with less-than-perfect credit.
Guaranteed Loan Program: The USDA guarantees a portion of the loan, reducing risk for lenders and expanding borrowing options.
Eligibility Criteria:
Location: The property must be located in a USDA-designated rural or suburban area. Many areas in California qualify.
Income Limits: Applicants must meet income guidelines, which vary by region and household size.
Primary Residence: The home must be used as the borrower's primary residence.
Application Process:
Find a USDA-Approved Lender: Not all lenders offer USDA loans, so it's essential to choose one approved by the USDA.
Pre-Qualification: Determine your eligibility and the amount you can borrow.
Property Search: Look for properties in eligible rural or suburban areas.
Loan Application: Submit your application, including financial and personal information.
Processing and Approval: The lender and USDA will review your application. If approved, you can proceed to closing.
USDA loans are an excellent option for those looking to buy a home in California's rural and suburban areas. With no down payment and flexible requirements, these loans make homeownership more attainable for many families. Explore your eligibility today and take the first step toward owning your dream home.
Even tho Pi network is not listed on any exchange yet.
Buying/Selling or investing in pi network coins is highly possible through the help of vendors. You can buy from vendors[ buy directly from the pi network miners and resell it]. I will leave the telegram contact of my personal vendor.
@Pi_vendor_247
2. Forward-Looking Statements
Certain statements contained in this release are quot;forward-looking statements,quot; such as statements
concerning the company's anticipated financial results, current and future product performance,
regulatory approvals, business and financial plans and other non-historical facts. These statements are
based on current expectations and currently available information. However, since these statements are
based on factors that involve risks and uncertainties, the company's actual performance and results may
differ materially from those described or implied by such forward-looking statements. Factors that could
cause or contribute to such differences include, among others: continued competition in seeds, traits and
agricultural chemicals; the company's exposure to various contingencies, including those related to
intellectual property protection, regulatory compliance and the speed with which approvals are received,
and public acceptance of biotechnology products; the success of the company's research and
development activities; the outcomes of major lawsuits, including proceedings related to Solutia Inc.;
developments related to foreign currencies and economies; successful completion and operation of
recent and proposed acquisitions; fluctuations in commodity prices; compliance with regulations affecting
our manufacturing; the accuracy of the company's estimates related to distribution inventory levels; the
company's ability to fund its short-term financing needs and to obtain payment for the products that it
sells; the effect of weather conditions, natural disasters and accidents on the agriculture business or the
company's facilities; and other risks and factors detailed in the company's filings with the SEC. Undue
reliance should not be placed on these forward-looking statements, which are current only as of the date
of this release. The company disclaims any current intention or obligation to update any forward-looking
statements or any of the factors that may affect actual results.
2
4. PERFORMANCE SUMMARY
Fourth-Quarter and Full-Year 2006 Financial Summary
Fourth Fourth Fiscal Fiscal
Change Change
Quarter Quarter Year Year
2006 2005 2006 2005
NET SALES $1,391M $1,274M 9% $7,344M $6,294M 17%
GROSS
$480M $493M (3)% $3,548M $3,004M 18%
PROFIT
NET
$(144)M $(125)M (15)% $689M $255M 170%
INCOME
DILUTED
EPS ON AS-
$(0.27) $(0.23) (17)% $1.25 $0.47 166%
REPORTED
BASIS
Note: EPS figures reflect the stock split effective July 28, 2006
4
5. PERFORMANCE SUMMARY
Items Included in Reported Earnings
Fourth Quarter 2006:
$(0.04) per share charge for tax on dividend repatriation
$(0.01) per share loss on discontinued operations
$(0.01) per share charge for accounting change
Fourth Quarter 2005:
$0.01 per share income on discontinued operations
$0.01 per share tax benefit associated with certain liabilities in
connection with the Solutia bankruptcy
Note: EPS figures reflect the stock split effective July 28, 2006
5
6. PERFORMANCE SUMMARY
Items Included in Reported Earnings
Full Year 2006:
$(0.04) per share charge for tax on dividend repatriation
$(0.01) per share loss on discontinued operations
$(0.01) per share charge for accounting change
Full Year 2005:
$(0.45) per share in-process R&D write-off related to the Seminis
and Stoneville acquisitions
$(0.32) per share for Solutia-related charge
$0.19 per share tax benefit from loss incurred on European wheat
and barley business
$(0.01) per share net restructuring charges
$0.02 per share income on discontinued operations
Note: EPS figures reflect the stock split effective July 28, 2006
6
7. STRATEGIC REVIEW
Six Key Factors Drive Monsanto’s Future Growth Opportunities
PERIOD : PERIOD : PERIOD :
SEED & TRAITS ESTABLISHED CORN IS ON THE LEADING EDGE THE GAME CHANGES
2003 2004 2005 2006 2007 2008 2009 2010
Commercial viability of seeds With seeds-and-traits strategy
Seed and trait growth comes from: penetration,
and traits established; established, gross profit
stacking and multi-generation traits, and
Supporting infrastructure in opportunity expands in the United
breeding enhancement; Corn defines the future
place
States and internationally with
direction
penetration, stacking, second-
generation – even as competition
becomes more significant
GROSS PROFIT DRIVERS
1 Growth in the U.S. corn market is not over
2 Growth in international corn market share
3 Biotech traits are advancing internationally
Cotton platform creates new opportunities for
4
growth
5 Seminis to capture additional gross margin
Next-generation pipeline poised for enhanced
6
commercial delivery
7
8. STRATEGIC REVIEW
Demonstrated Product Leadership Translates to Recognized
Brand Leadership
MARKET RESEARCH: TOP 3 CITED SEED PURCHASE DRIVERS
Based on a sample of 1,909 respondents representing farmers who use seed from
the largest suppliers in the U.S. corn seed market1
RANKED ORDER OF FARMER RESPONSES
OTHER NATIONAL Top 3 purchase
CORN SEED drivers for farmers
PROVIDER(S) buying DEKALB
corn seed all relate
Good Yield 35% Good Yield 41%
1
to performance
Good Stand/ benefits – reflecting
Top 2 of 3 Lower Cost 27% 16%
2
Strong Stalks 68% of the reasons
purchase drivers
cited
related to price Discount/ Test Plot
10% 11%
3
Rebates Results
MARKET SHARE PERFORMANCE The positive view by
farmers of
MARKET SHARE GAIN
DEKALB’s brand
2005 to 2006
performance is
reflected in its
+3 points
Asgrow and DEKALB brands
market share
growth year-to-year
1.Monsanto research; Survey question: “What one factor most influenced your decision to plant more acres of [brand] corn seed in 2006 than you did
this past season in 2005?
8
9. STRATEGIC REVIEW
Corn Market Share Gains Still To Fully Reflect Power of
Molecular Breeding Application
20% 6%
2006 BRANDED U.S.
MOLECULAR-BREEDING HYBRIDS
MARKET SHARE: 19%
AS A PERCENT OF BRANDED
UNITS SOLD IN COMMERCIAL
5%
CORN PORTFOLIO
IN COMMERCIAL CORN PORTFOLIO
PERCENT OF BRANDED UNITS SOLD
15%
4%
U.S. MARKET SHARE
3%
10% DEKALB AND ASGROW
U.S. BRAND MARKET
SHARE
2%
5%
1%
0% 0%
2001 2002 2003 2004 2005 2006 2007F 2008F
CYCLE 1: CYCLE 2: CYCLE 3:
PROGRESSION
INTEGRATION OF APPLICATION OF MOLECULAR SELECTION POWER OF
OF BREEDING GLOBAL GERMPLASM BREEDING TO SELECTION MOLECULAR BREEDING
TECHNOLOGY
IN THE • MOLECULAR BREEDING
• ASSEMBLED 36 MAJOR CORN • PREDICTIVE COMBINATIONS
COMMERCIAL IMPROVES GENETIC POTENTIAL
BREEDING PROGRAMS IN 12 ALLOW MORE EFFICIENT
PORTFOLIO BY 2X VERSUS CONVENTIONAL
COUNTRIES BREEDING
BREEDING
• FIRST INTRA-COMPANY • MOLECULAR BREEDING
• BY 2006, FIRST MOLECULAR
CROSSES; BY CYCLE 3, >50% ACCELERATES TRAIT
BREEDING HYBRIDS ENTER
OF HYBRIDS IN THE U.S. INTEGRATION BY
COMMERCIAL PORTFOLIO
PORTFOLIO MADE THROUGH SHORTENING ‘BACKCROSSING’
INTRA-COMPANY CROSSES CYCLES
9
10. STRATEGIC REVIEW
Another Strong Year of Trait Adoption Moves Penetration of
U.S. Corn Traits Toward 2010 Targets
U.S. PENETRATION OF CORN TRAITS: 2006
PENETRATION OF CORN TRAITS IN 2006 AS
A PERCENT OF 2010 TOTAL MARKET OPPORTUNITY1
YieldGard Corn Borer
Roundup Ready Corn 2
YieldGard Rootworm
Triple-Stack Acres
0% 20% 40% 60% 80% 100%
2010
2005 2006
OPPORTUNITY
ACRES IN MILLIONS
32.1 32.3 50-60
U.S. YieldGard Corn Borer Acres
24.3 32.7 60
U.S. Roundup Ready Corn 2 Acres
4.1 10.0 25-30
U.S. YieldGard Rootworm Acres
1.3 6.0 25-30
U.S. Triple-Stack Acres
1. Percent of total market opportunity reflects the ratio of number of actual acres planted to total trait-acre opportunity identified for each particular trait
10
11. STRATEGIC REVIEW
With the Corn Trait Technology in Hand Today, There’s
Opportunity to Double Penetration By End of Decade
U.S. CORN TRAIT OPPORTUNITY
FOCUS: OPPORTUNITY
TOTAL MARKET OPPORTUNITY IN 2010
U.S. TRAIT ACRE
OPPORTUNITY: CURRENT
RELATIVE RETAIL VALUE PER ACRE
YIELDGARD COMMERCIAL CORN
ROOTWORM
TRAITS
2006F:
YIELDGARD
Only 50%
CORN BORER
penetrated to
date
ROUNDUP
READY CORN
60
40 50
30
10 20
U.S. TRAIT-ACRE OPPORTUNITY
(ACRES IN MILLIONS)
OPPORTUNITY
DOUBLE SINGLE
TRIPLE
20-25M ACRES
STACKED
~10M ACRES
25-30M ACRES
Above triple stack, Acres exclusively using
Because YieldGard Rootworm
remaining YieldGard Roundup Ready, which would
has the lowest market
Corn Borer forms include “refuge” acres
opportunity of the 3 traits, its
double-stack required for other acres using
market potential is the proxy for
opportunity insect-protected traits
total potential for triple stack
11
12. STRATEGIC REVIEW
Monsanto’s Breeding Prowess Is Paving the Way for
Market Share Growth Internationally
SCORECARD
GLOBAL BRANDED MARKET SHARE1
CHANGE
FY2004 FY2005 FY2006
FRANCE
(’04-’06)
NORTH AMERICAN REGION 14% 16% 19% +5%
• 7.1M CORN
ACRES
UNITED STATES2 14% 16% 19% +5%
• LARGEST CORN
MARKET IN
EUROPE-AFRICA REGION 13% 15% 15% +2%
EUROPE
FRANCE 10% 14% 15% +5%
DEKALB market share
ITALY 14% 17% 21% +7%
has grown 5 points
HUNGARY 26% 30% 32% +6%
over the last two years
TURKEY 17% 23% 21% +4%
For the first time ever,
SOUTH AFRICA 38% 44% 50% +12%
DEKALB is co-leading
ASIA-PACIFIC REGION 35% 37% 32% -3% the French market
INDIA 29% 34% 35% +6%
LATIN AMERICA REGION 37% 38% 38% +1%
MEXICO 58% 57% 61% +3%
BRAZIL 35% 35% 34% -1%
ARGENTINA 35% 37% 35% FLAT
1. Market share is for hybrid corn seed market only
2. U.S. market share is for Asgrow and DEKALB brands only; not inclusive of ASI companies
12
13. STRATEGIC REVIEW
Global Seed Business Creates Platform for Growth in Traits
in Key Markets
GROWTH TARGETS FOR SELECTED TRAITS
PAST-YEAR CURRENT-YEAR END-OF-DECADE
ACRES IN MILLIONS
PLANTED ACRES PLANTED ACRES MARKET POTENTIAL
(2005) (2006) (2010F)
CORN
24.3 32.7 60
U.S. ROUNDUP READY CORN 2 ACRES
4.1 10.0 25-30
U.S. YIELDGARD ROOTWORM
1.3 6.0 25-30
U.S. TRIPLE-STACK ACRES
COTTON
N/A 2.1 10-15
U.S. ROUNDUP READY FLEX COTTON
3.1 8.4 10-15
INDIAN BOLLGARD COTTON
0.6 0.7 0.5-0.8
COTTON TRAITS IN AUSTRALIA
SOYBEANS
BRAZILIAN ROUNDUP READY
12.3 19.4 50
SOYBEANS1
1. Brazilian Roundup Ready soybean acres include acres representing both new-seed sales and point-of-delivery value sharing.
13
14. STRATEGIC REVIEW
Focus on Brazilian Roundup Ready Soybean System is to
Encourage Further Penetration
FOCUS: ROUNDUP READY SOYBEANS IN BRAZIL
ACREAGE
2010 MARKET
2004 2005 2006
POTENTIAL
7.4M 12.3M 19M 50M
VALUE CAPTURE
Dual system in place for new seed sales and point-of-delivery
value capture
NORTH: PRIMARILY
In FY2006, weighted average retail price was ~$3.50 per acre
NEW SEED
40 MILLION For FY2007, Monsanto expects weighted average price to be
PLANTED in the range of $2.50-$3.00 per acre
SOYBEAN ACRES
Final weighted price will depend on farmer enrollment in
payment options (in order of lowest to highest):
SOUTH: PRIMARILY Fresh seed with upfront payment
SAVED SEED Fresh seed paid at harvest point-of-delivery
10 MILLION PLANTED
Saved seed paid at harvest point-of-delivery: early
SOYBEAN ACRES
delivery
Saved seed paid at harvest point-of-delivery: late delivery
EARNINGS CONTRIBUTION
2007F
2006
2.5 to 5 cents 2.5 to 5 cents
14
15. STRATEGIC REVIEW
Most Significant Near-Term Opportunity in Cotton Is
Upgrading to Second-Generation Traits
U.S. PENETRATION OF COTTON TRAITS: 2006
PENETRATION OF COTTON TRAITS IN 2006 AS
FOCUS: ROUNDUP READY FLEX
A PERCENT OF 2010 TOTAL MARKET OPPORTUNITY1
FIRST GENERATION Launched
in 2006 on
2.1 million
Bollgard
acres
Roundup 75 percent of
Ready Roundup Ready Flex
is in the ‘double-
SECOND GENERATION
double’ stack with
second-generation
Bollgard II
Bollgard II
Roundup
Ready Flex
0% 20% 40% 60% 80% 100%
1. Percent of total market opportunity reflects the ratio of number of actual acres planted to total trait-acre opportunity identified for each particular trait
15
16. STRATEGIC REVIEW
Seminis To Leverage Portfolio, Pricing and Molecular
Breeding To Create New Growth
SEMINIS VALUE CREATION
STAGED OPPORTUNITIES FOR INCREASING BUSINESS VALUE
Significant use of molecular
VALUE CREATION OPPORTUNITY
markers in commercially relevant
breeding
Aggressively make
hybrid conversions in
strategic crops
Identify and implement
opportunities to price
products to value
Target crops: Sweet Corn Melons Broccoli
Assemble Genetic Tomatoes Watermelons Cauliflower
Maps for Key Crops Peppers Cabbage
Tomato Pea Cauliflower Carrot Eggplant
Focus on 20 – 25 Hot and Sweet Pepper Squash Watermelon Cabbage Pumpkin
most-profitable key Cucumber Spinach Chinese Cabbage Okra
Lettuce
Garden Bean Broccoli Dry Bean Gourd
Radish
crops Onion Melon Leek Fennel
Sweet Corn
2005 2006 2007 2008 2009 2010
OPERATIONAL EXCELLENCE NEW VALUE CREATION PIPELINE ADVANCEMENT
Monsanto Seminis Seminis accretive Commercialize first
acquires Seminis modestly to FY2007 EPS in hybrids developed
accretive to range of $0.10- by molecular
FY2006 EPS $0.125 breeding
16
17. STRATEGIC REVIEW
Reflecting HIT Status, Roundup RReady2Yield Soybeans Is
Targeted for Most Significant Commercial Trait Launch
KEY MARKET ACRES U.S. BRAZIL ARGENTINA
Roundup RReady2Yield AVAILABLE MARKET 70M 50M 35M
Soybeans
CREATING VALUE PERCENT PENETRATED 0% 0% 0%
LAUNCH ACRES OF U.S. TRAITS
PRODUCT CONCEPT 3
HISTORICAL COMMERCIALIZED TRAITS (1996-2006)
2.5
HIT Project
ACRES (IN MILLIONS)
Roundup RReady2Yield soybeans
AVERAGE
2
DISCOVERY PHASE I PHASE II PHASE III PHASE IV HISTORIC TRAIT
LAUNCH:
1.5 1.2M ACRES
1
• Roundup RReady2Yield is the second-generation of
Monsanto’s popular herbicide-tolerant platform in 0.5
soybeans
0
VALUE CONSIDERATIONS SOYBEAN
COTTON
CORN TRAITS TRAITS
TRAITS
• Value is additive, with target of up to 5 bushel-per-
Target acreage for Roundup RReady2Yield
acre yield improvement over comparable Roundup
Ready soybeans commercial launch is expected to be a multiple
above historical acreages in launch years
• Value created through yield gains will be shared with
farmer and value chain as has been Monsanto’s
ROUNDUP RREADY2YIELD: COMMERCIAL MILESTONES
practice
STARTING POINT
• Market opportunity for Roundup RReady2Yield U.S. REGULATORY
APPROVAL
soybeans recognizes competition from other traits
SEASON 1 LAUNCH YEAR
RETAIL
Medium (>$10/acre to <$30/acre) GLOBAL REGULATORY CLEARANCES
VALUE/ACRE:
TOTAL ACRE PRE-COMMERCIAL USER- COMMERCIAL LAUNCH
High (>20M acres)
OPPORTUNITY: RELIABILITY TRIALS
17
18. STRATEGIC REVIEW
Monsanto Has a Window of Opportunity to Extend Its
Leadership in Seeds and Traits Industry
2006 Status Outlook Opportunity (2010)
1 Growth in the U.S. corn market is not over
Continued gains of 1-2 points
Grow U.S. corn market share +3 points in 2006 per year
Current commercial corn traits
Accelerate trait penetration Triple stacks grew by >300% are less than 50% penetrated
2 Growth in international corn market share
Maintained or grew share in Latin Gains of 1-2 points per year
Grow ex-U.S. corn market share America and Europe worldwide
3 Biotech traits are advancing internationally
Increase penetration of Roundup Penetration grew by >50% in 2006 50M acre market
Ready soybeans in Brazil
Increase cotton traits in India Bollgard penetration +160% in 2006 10-15M acre market
4 Cotton platform creates new opportunities for growth
Portfolio flipped to second-gen
Increase second-generation traits Roundup Ready Flex: 2.1M acres ‘double-double’ traits
5 Seminis to capture additional gross margin
Prioritized commercial portfolio,
Change commercial mentality to Additional opportunity: capture
focusing on 25 most-profitable
gross profit focus more value created
crops
Apply molecular markers to drive Genetic mapping: 8 core products Beginning molecular breeding
new products
6 Next-generation pipeline poised for enhanced commercial delivery
“HIT” projects create new
Advance “HIT” projects 3 “HIT” projects identified standard for launch of pipeline
projects
18
19. FINANCIAL FOCUS
2006 Performance Reflects Strength of Seeds and
Traits Business
FY2006: ORIGINAL PROJECTIONS AND YEAR-END PERFORMANCE
YEAR-END
ORIGINAL PROJECTIONS1
PERFORMANCE
$1.18-$1.25 $1.31
ONGOING EARNINGS PER SHARE UP TO 20% GROWTH 26% GROWTH
2
FROM 2005 FROM 2005
$825M - $900M $1,049M
FREE CASH FLOW
~22% 22%
SG&A AS A % OF SALES
~10% 10%
R&D AS A % OF SALES
~$350M $370M
CAPITAL EXPENDITURES
ROUNDUP AND ALL OTHER
~$600M $648M
GLYPHOSATE-BASED HERBICIDES
GROSS PROFIT
ALL OTHER AG PRODUCTIVITY
~$400M $438M
GROSS PROFIT
~$2.3B $2.46B
SEEDS & TRAITS GROSS PROFIT
1. Financial guidance provided at Monsanto’s Biennial Investor Day, Nov. 10, 2005
2. EPS figures reflect the stock split effective July 28, 2006
19
20. FINANCIAL FOCUS
2007 Opportunity Reflects Organic Growth As Seeds
and Traits Momentum Continues
FY2007: ORIGINAL AND UPDATED PROJECTIONS
FY2007 CURRENT
ORIGINAL PROJECTIONS1
GUIDANCE
$1.41-$1.50 $1.50-$1.57
20% GROWTH FROM 15%-20% GROWTH
EARNINGS PER SHARE2
FROM 2006 YEAR-END
ORIGINAL 2006
PERFORMANCE
PROJECTION
$875M-$950M
FREE CASH FLOW $875M - $950M
21%-21.5%
SG&A AS A % OF SALES ~21%
~10%
R&D AS A % OF SALES ~10%
$350-$400M
CAPITAL EXPENDITURES $350M - $400M
ROUNDUP AND ALL OTHER
~$600M
GLYPHOSATE-BASED HERBICIDES ~$600M
GROSS PROFIT
ALL OTHER AG PRODUCTIVITY
~$400M
~$400M
GROSS PROFIT
$2.8B
SEEDS & TRAITS GROSS PROFIT ~$2.6B
1. Financial guidance provided at Monsanto’s Biennial Investor Day, Nov. 10, 2005
2. EPS figures reflect the stock split effective July 28, 2006
20
21. FINANCIAL OUTLOOK
Six Drivers Set Up Seeds and Traits for Further Acceleration
into the Next Decade
FOCUS: BUSINESS OPPORTUNITY FOCUS: FINANCIAL TARGET
Six drivers are expected to provide a
positive pull on gross profit with higher-
Monsanto sees a path to cross the 50% mark for gross
margin, higher-growth opportunity. That
profit as a percent of sales in the next few years and
pull disproportionately benefits Seeds &
moving toward a 51% to 53% target by the end of 2010
Genomics segment, but also has a
positive effect on the gross-profit-to-net-
GROSS PROFIT AS A PERCENT OF SALES
sales ratio for the company.
54%
GROSS PROFIT DRIVERS
52%
TARGET OF UP TO
Growth in the U.S. corn market is not
1 51% - 53% GROSS
over 50% PROFIT BY 2010
Growth in international corn market
2 48%
share
Biotech traits are advancing
3 46%
internationally
44%
Cotton platform creates new
4
opportunities for growth
42%
Seminis to capture additional gross
5 2003 2004 2005 2006 2010F
margin
Next-generation pipeline poised for
6 enhanced commercial delivery
21
22. Reconciliation of Non-GAAP Financial Measures
Reconciliation of Free Cash Flow
Fiscal Year 2007 Fiscal Year Fiscal Year
$ Millions Forecast 2006 2005
Net Cash Provided (Required) by Operating Activities $1,375-$1,450 $1,674 $1,737
Net Cash Provided (Required) by Investing Activities $(500) $(625) $(1,667)
Free Cash Flow $875-$950 $1,049 $70
Net Cash Provided (Required) by Financing Activities N/A $(117) $(582)
Net Increase (Decrease) in Cash and Cash Equivalents N/A $935 $(512)
Reconciliation of Non-GAAP EPS
Fiscal Year Fiscal Year Fourth Quarter Fourth Quarter
$ per share 2006 2005 Fiscal Year 2006 Fiscal Year 2005
Net Income per Share $1.25 $0.47 $(0.27) $(0.23)
Cumulative Effect of Change in Accounting Principle $0.01 --
-- $0.01
Diluted Earnings (Loss) per Share Before Effect of $1.26 $0.47 $(0.26) $(0.23)
Accounting Change
Tax Charge on Repatriated Earnings $0.04 --
-- $0.04
Seminis and Stoneville In-Process R&D -- --
$0.45 --
Solutia-Related Charge and Tax Benefit -- $0.32 -- $(0.01)
Tax Benefit on Loss from European Wheat and -- $(0.19) -- --
Barley Business
Restructuring Charges -- Net -- --
$0.01 --
Loss (Income) on Discontinued Operations $0.01 $(0.01)
$(0.02) $0.01
Diluted Earnings (Loss) per Share from Ongoing Business $1.31 $(0.21) $(0.25)
$1.04
Note: EPS figures reflect the stock split effective July 28, 2006
22
23. Reconciliation of Non-GAAP Financial Measures
Reconciliation of Seminis Gross Profit
Fiscal Year Fiscal Year
2006 2005
As Inventory Step-Up As As Inventory Step-Up As
$ Millions Reported Charged to COGS Adjusted Reported Charged to COGS Adjusted
Vegetable and Fruit Seed Sales $569 $569 $226 $226
Vegetable and Fruit Seed Cost of Goods Sold $273 $50 $223 $113 $19 $94
Vegetable and Fruit Seed Gross Profit $296 $346 $113 $132
Vegetable and Fruit Seed Gross Profit Percent of Sales 52.0% 60.8% 50.0% 58.4%
23
24. Reconciliation of Non-GAAP Financial Measures
Reconciliation of Return on Capital
$ Millions
12 Months
Total Monsanto Company and Subsidiaries: Ended
Aug. 31, 2006
Operating Profit After-tax (excluding certain items) $767
Average Capital 6,833
Return on Capital 11.2%
Operating Profit After-tax (excluding certain items):
Net Income $689
Adjustment for certain items, after-tax:
Tax Charge on Repatriated Earnings 21
Cumulative Effect of Accounting Change 6
Restructuring Reversal (1)
Loss on Discontinued Operations 3
Interest Expense – Net 79
Tax on Interest Expense – Net (at 38% tax rate) (30)
Operating Profit After-tax (excluding certain items) $767
As of Aug. 31,
2006
Average Capital:
Short-Term and Long-Term Debt $1,667
Shareowners’ Equity 6,536
Cash and Cash Equivalents (1,460)
Cash for Operations 125
Total Capital 6,868
Prior Period Capital 6,797
Average Capital $6,833
24