Download as PDF, PPTX


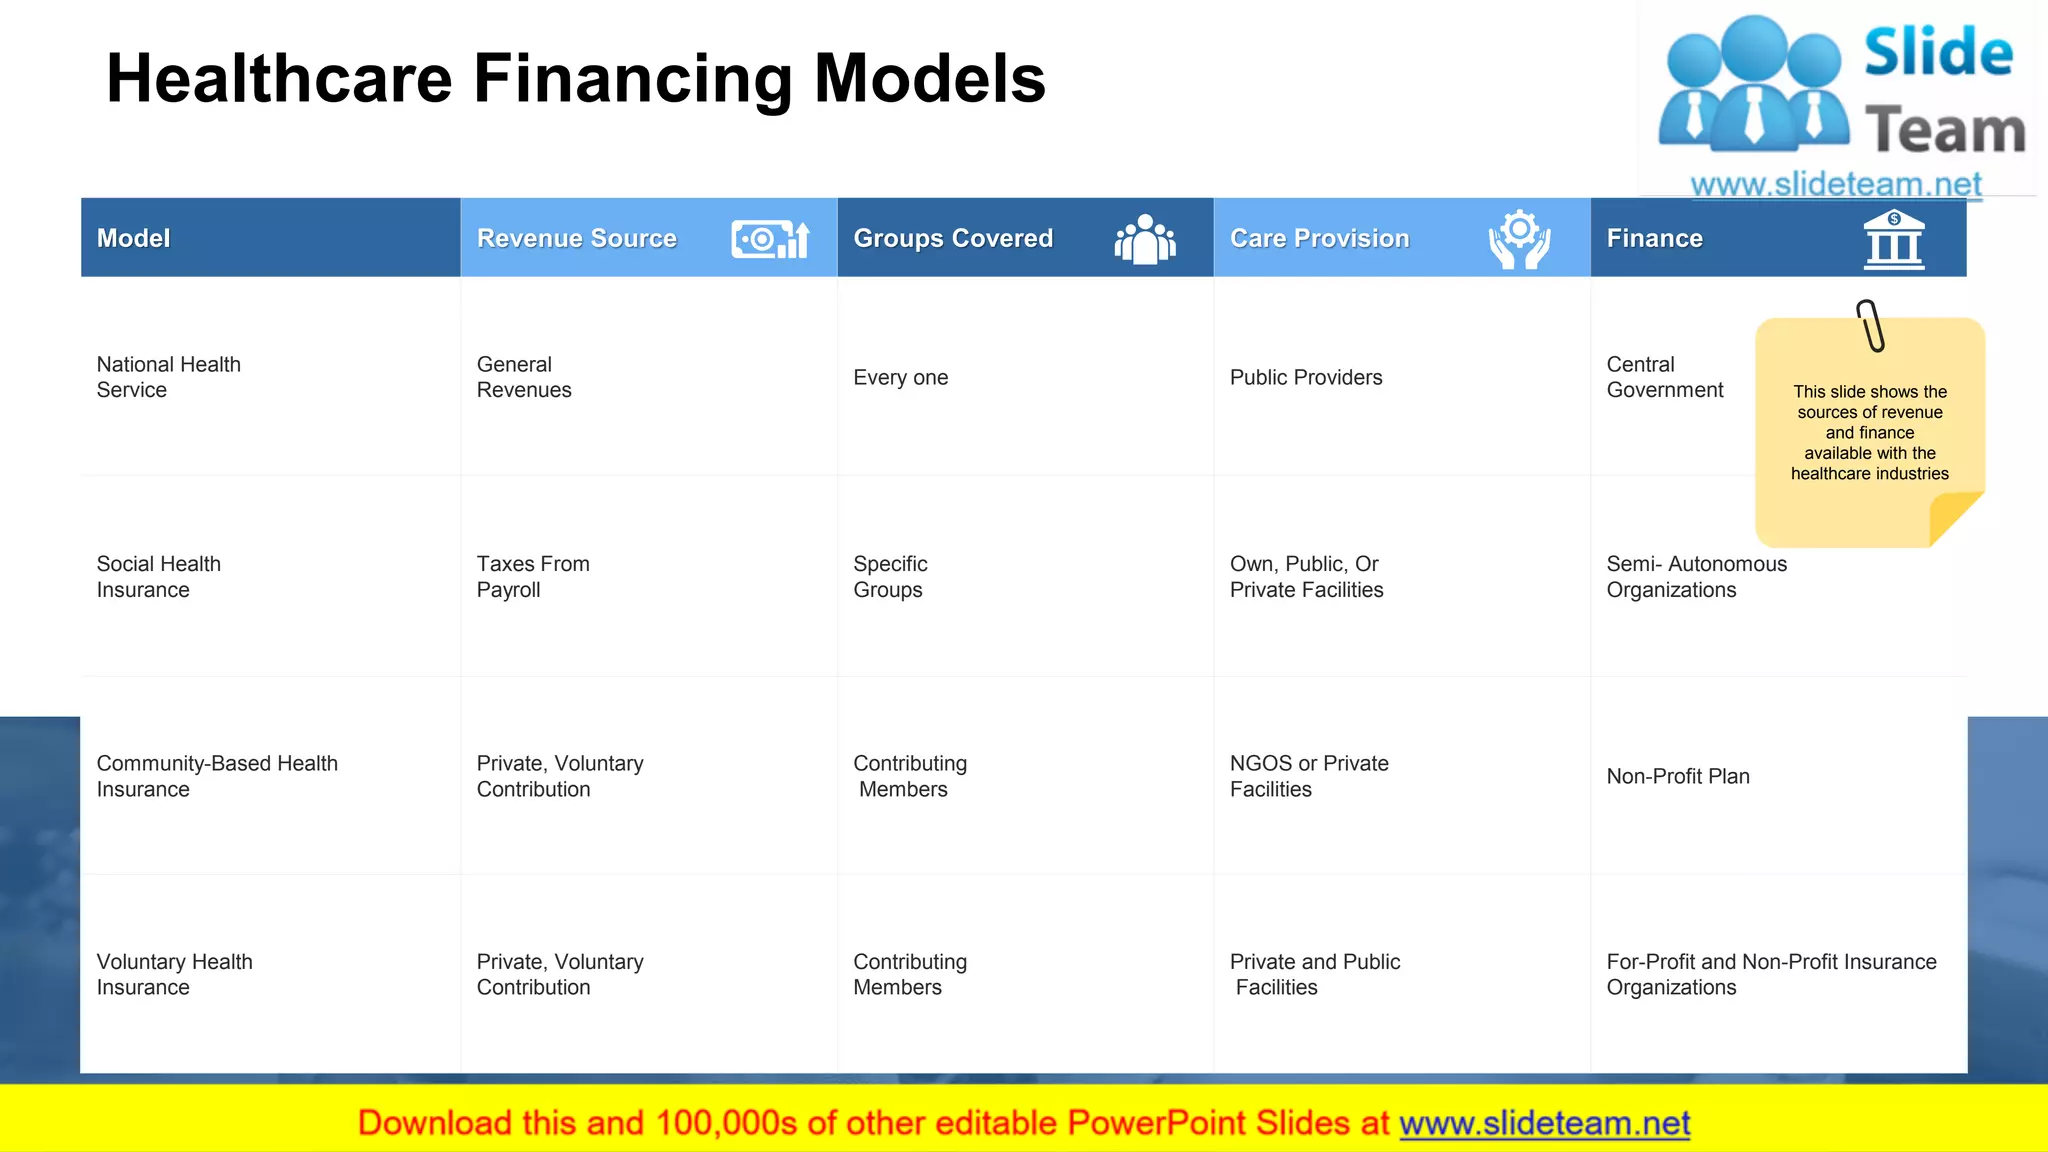


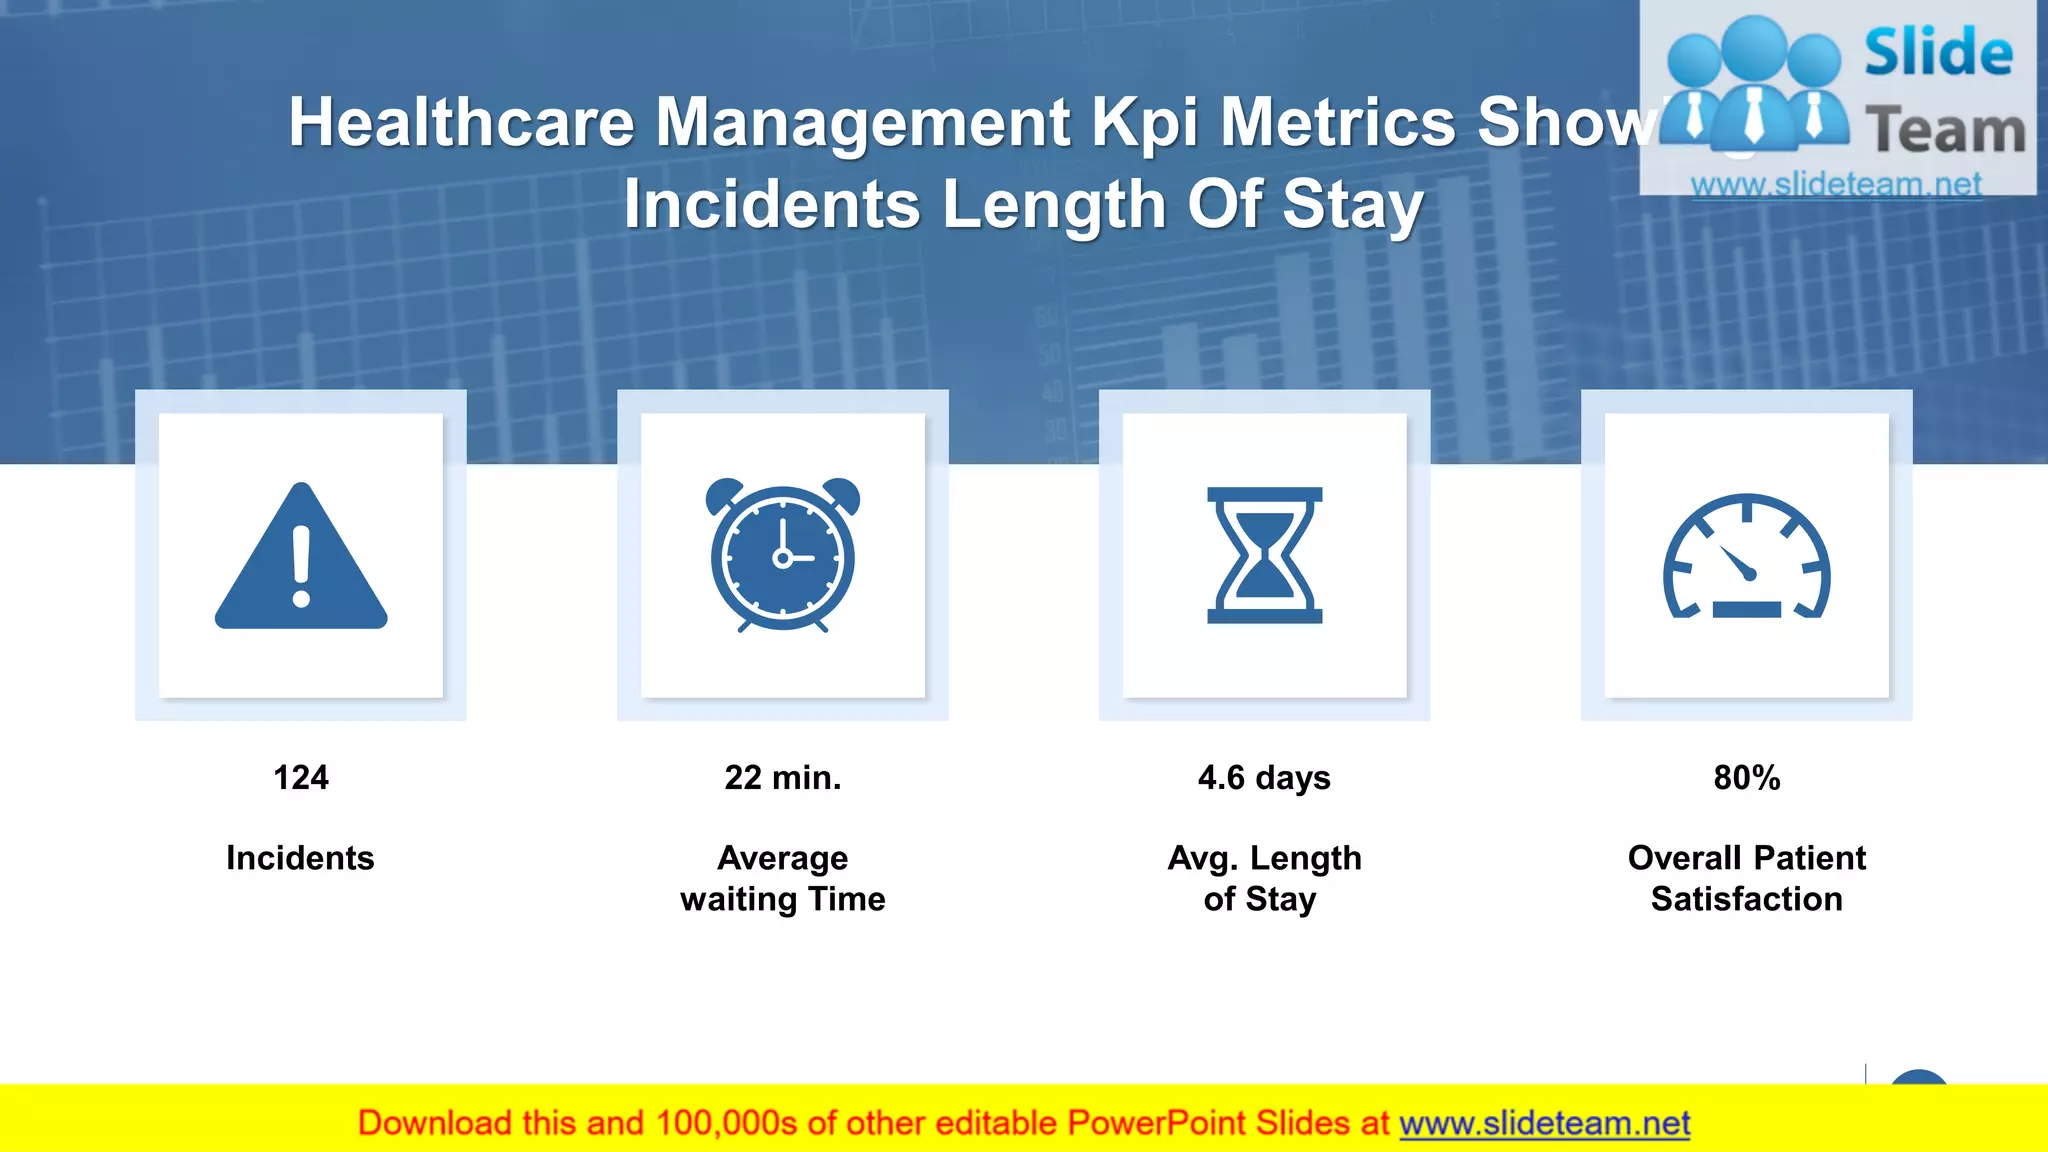


The document provides a comprehensive analysis of healthcare financial performance, including key trends, expenditure comparisons, and financing models. It highlights various metrics such as operating income, capital expenditures, and healthcare costs, alongside global statistics on healthcare spending and revenue cycles. Additionally, it offers insights into healthcare marketing trends and management KPIs that monitor incidents and patient cases.


