Download as PDF, PPTX

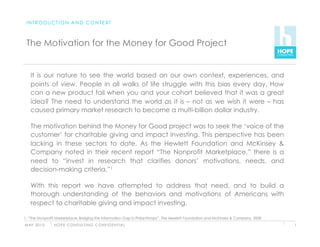
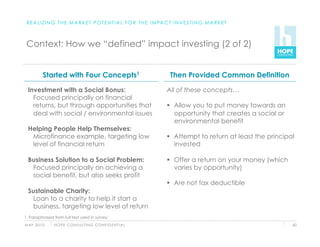
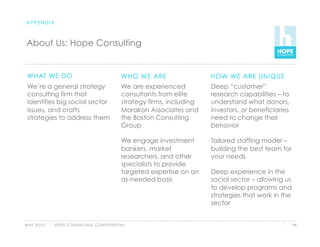
![R E C O M M E N D AT I O N S F O R N O N P R O F I T O R G A N I Z AT I O N S
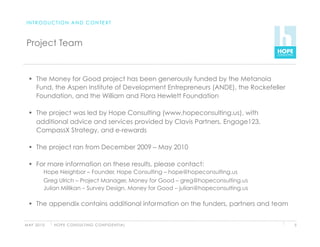
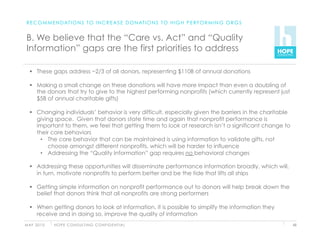
D. Develop simple, consistent outbound marketing
that appeals to target segments
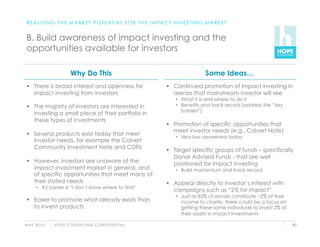
Why Do This Some Ideas…
Donors give for different reasons, and Create outbound marketing approach
thus respond to different appeals that appeals to target segments, i.e.,
• Channels for communication and asks
Donors want simple information, and • Look and feel of website and images
• Consistency in all messages
are not willing to do a lot of research
Communicate a few, simple messages
While many donors want general
• Simple story that appeals to 1-2 segments
performance information, and want • Supported by a few key metrics
to know how their gift will be used,
different segments have different
Create brief summaries / asks for
“hooks” that will inspire them to give
donors, nuanced by target segment
• E.g., a hospital could focus on:
a) appealing to the families of current When you donate to [org name], 99 cents out of
and past patients; every dollar go to help the end beneficiaries…
b) how they benefit the local community Do you remember the great times you had at ___
c) their quality vs. other hospitals University? Well, now we need your help…
M AY 2 0 1 0 H O P E C O N S U LT I N G C O N F I D E N T I A L 31](https://image.slidesharecdn.com/moneyforgood-110119153901-phpapp02/85/Money-for-Good-32-320.jpg)
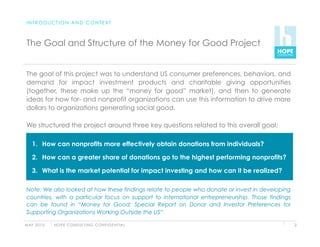
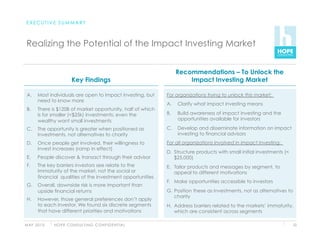
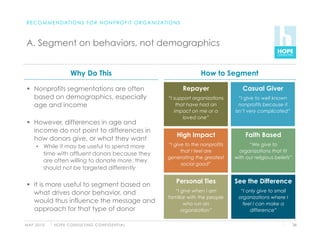
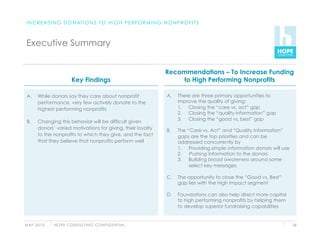
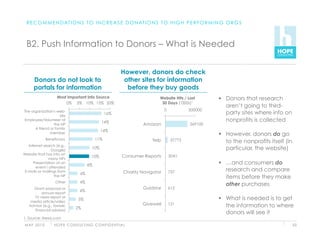
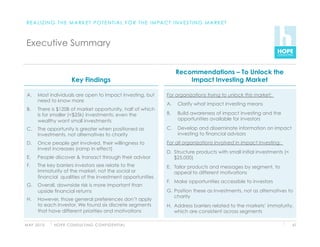
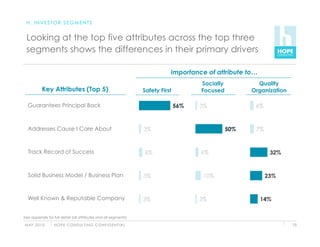
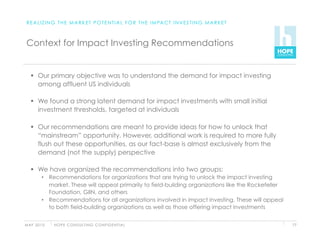
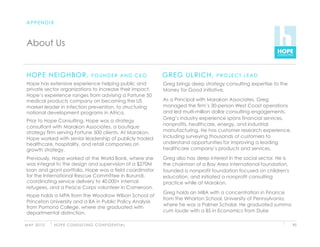
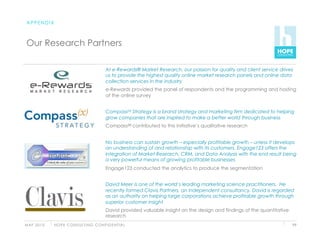
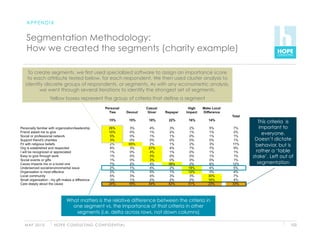
![R E C O M M E N D AT I O N S F O R N O N P R O F I T O R G A N I Z AT I O N S
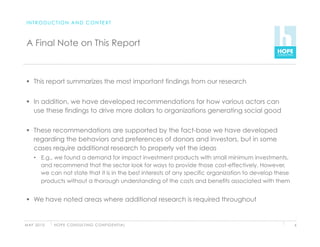
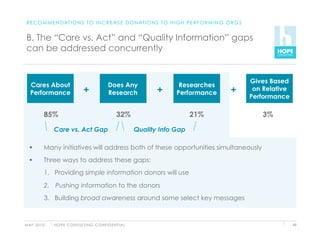
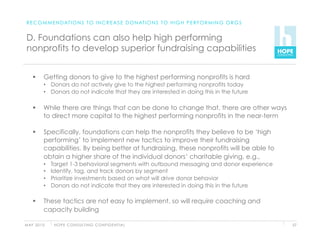
E. Prioritize investments based on what will drive donor
behavior
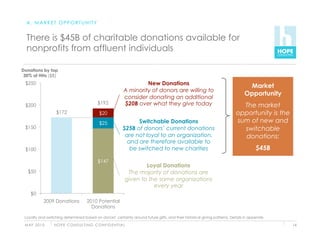
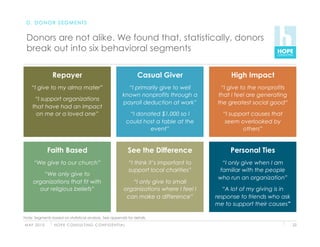
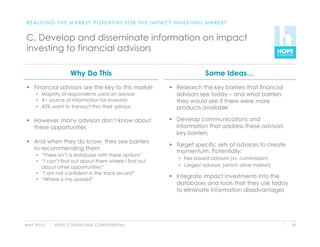
Why Do This How to Prioritize Investments
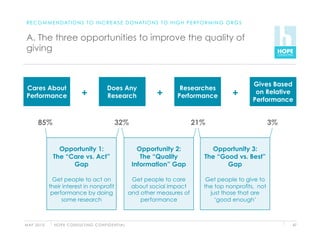
We measured the importance of various traits
Nonprofits should only invest where it
for the sector as a whole (see pages 17 - 18);
will change behavior – and should not nonprofits could survey their donors to see how
invest where it won’t they perform on each of those dimensions
1.0
Nonprofits need to understand what Unsatisfied needs
0.9
donors want and how donors feel that
0.8
the nonprofit performs on those criteria
0.7
• Nonprofits can attract more donors by
Importance
improving on ‘unsatisfied needs’ 0.6
• Nonprofits can save time and money by 0.5
cutting back on areas of over-investment 0.4
0.3
Requires being strict – “Will changing 0.2
what we do here really cause donors to 0.1 Areas of potential
over-investment
[no longer] give to us?” 0.0
0.0 0.1 0.2 0.3 0.4 0.5 0.6 0.7 0.8 0.9 1.0
Performance
M AY 2 0 1 0 H O P E C O N S U LT I N G C O N F I D E N T I A L 32](https://image.slidesharecdn.com/moneyforgood-110119153901-phpapp02/85/Money-for-Good-33-320.jpg)
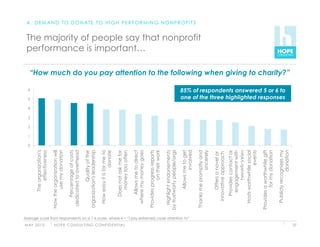
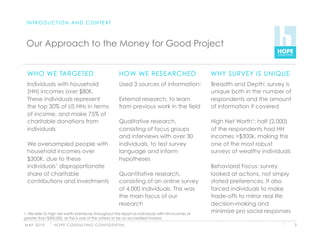
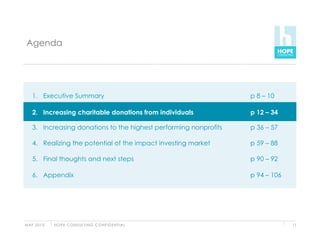
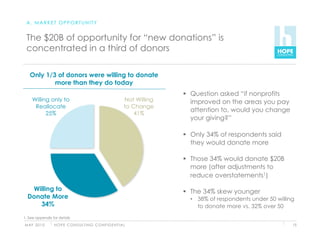
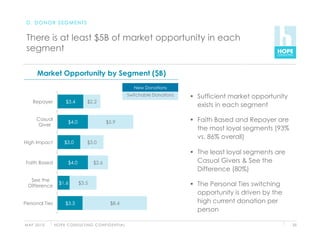
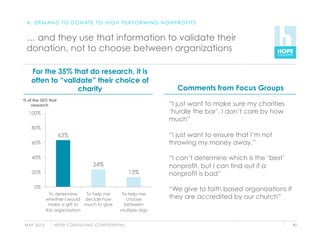
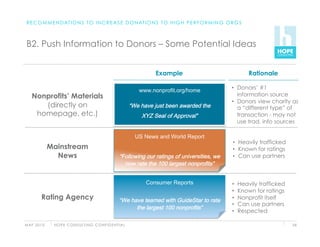
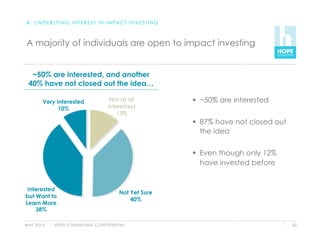
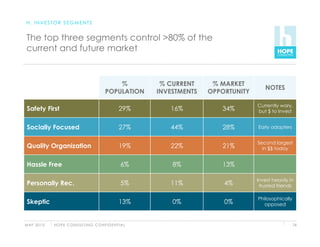
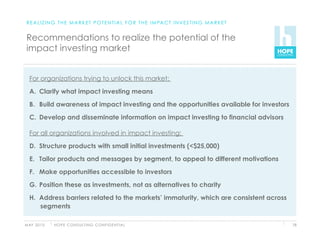
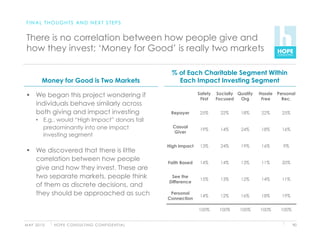
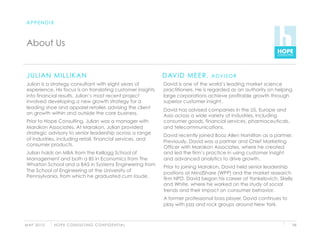
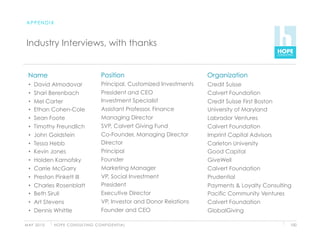
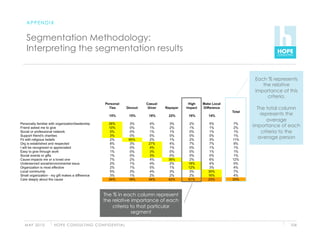
![A . D E M A N D T O D O N AT E T O H I G H P E R F O R M I N G N O N P R O F I T S
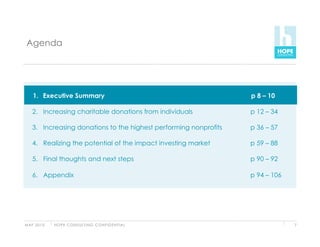
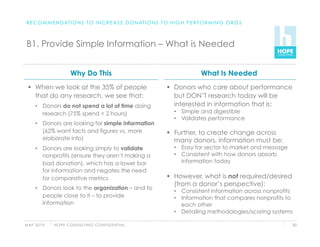
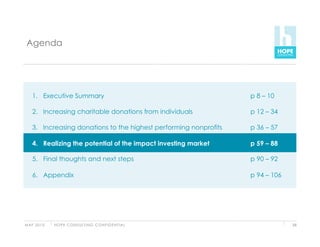
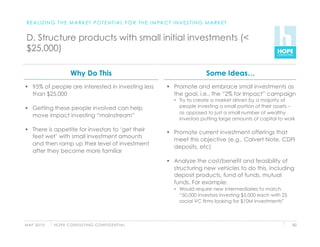
… However, very few people spend any time looking
into it…
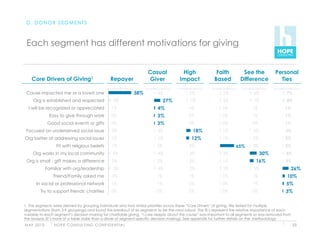
People say they care about nonprofit
performance, but few look into it Comments from Focus Groups
% of all
Respondents “Giving to charity should be the easy
100%
thing in my life”
85%
80% “I don’t want to spend the time to do
research”
60%
“With known nonprofits, unless there is
40% 35% a scandal, you assume they are doing
well with your money”
20%
“[Third party validation]…would be
0% another layer of effort for me. I would
State that Do research on any have to figure out whether the rating
performance is "very gift
important" (1) company is reputable or trustworthy”
1. % responding 5 or 6 on a 1-6 scale, where 6 = “I pay extremely close attention to”
M AY 2 0 1 0 H O P E C O N S U LT I N G C O N F I D E N T I A L 38](https://image.slidesharecdn.com/moneyforgood-110119153901-phpapp02/85/Money-for-Good-39-320.jpg)
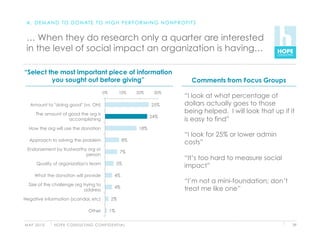
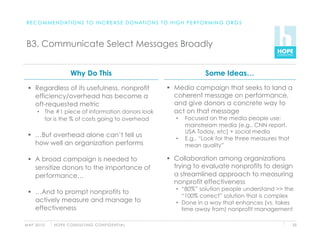
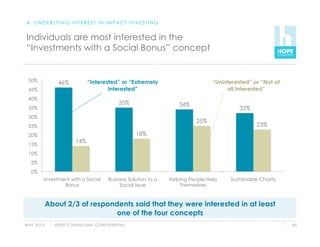
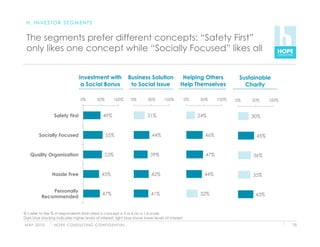
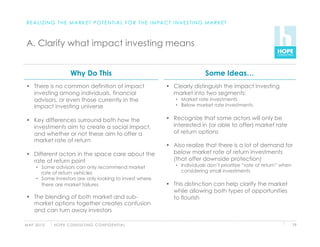
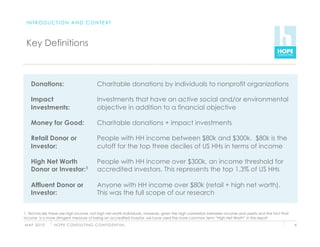
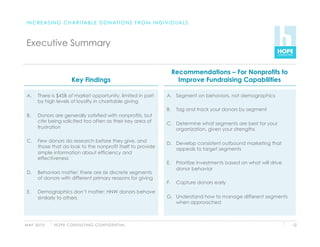
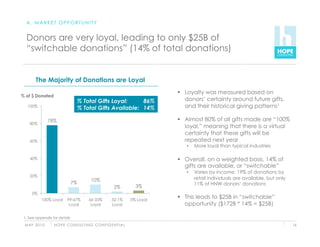
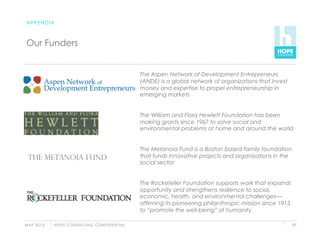
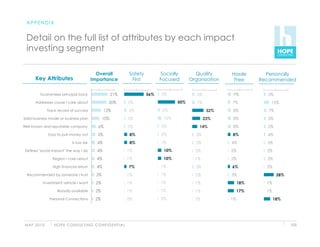
![R E A L I Z I N G T H E M A R K E T P O T E N T I A L F O R T H E I M PA C T I N V E S T I N G M A R K E T
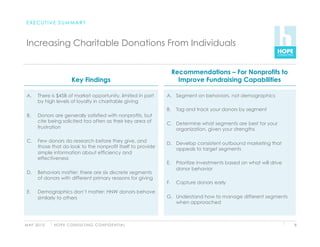
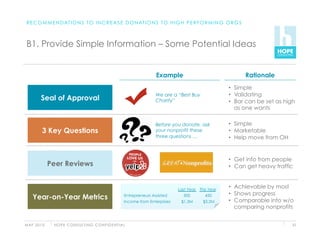
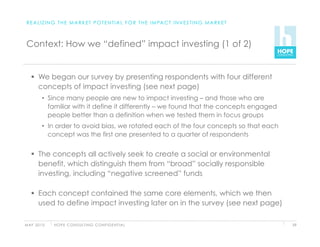
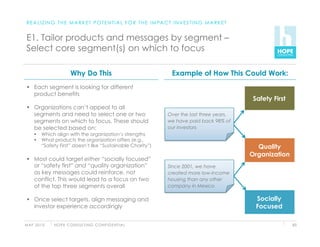
F. Make opportunities accessible to investors
Why Do This Some Ideas…
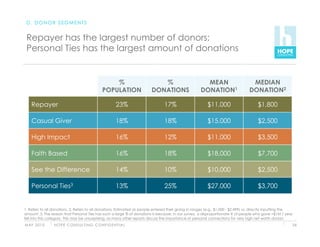
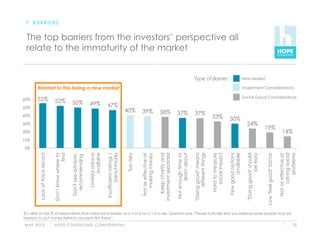
Many impact investment options for Work with large financial institutions (e.g,.
investors are in socially-focused venture Fidelity) to structure and/or offer impact
capital funds that have high minimum investments through their platform
investments Address barriers facing financial advisors,
• Well above the $25,000 “threshold” given their importance to investors and the
• Limits ability to reach majority of market
fact that only 20% ever raise proactively1
How important are the following factors in preventing
Investors stated that “Don’t know where to fund managers from doing [impact investing]1
find” was the second most important barrier 0 1 2 3 4 5
Lack of explicit client demand
Making these available at established Lack of knowledge of staff
financial institutions will help address the Concerns over legal/performance issues
“newness” concerns, and appeal directly to Research / resource constraints
one of the top three segments: “Quality Incentive structure for portfolo managers
Organization” Incentive structure for biz dev staff
Short timeframe to evaluate mgr perf
Tracking error limits or index mandates
Lack of extra fees for doing "extra" work
1. “Investment Consultants and Responsible Investments”, Social Investment Forum Foundation, December 2009
M AY 2 0 1 0 H O P E C O N S U LT I N G C O N F I D E N T I A L 85](https://image.slidesharecdn.com/moneyforgood-110119153901-phpapp02/85/Money-for-Good-86-320.jpg)


This document provides an introduction and context for the Money for Good project report. The project aimed to understand US consumer preferences and demand for impact investments and charitable donations. A survey of 4,000 individuals was conducted, with half having household incomes over $300k. The survey explored how nonprofits can obtain more donations, how donations can go to top-performing nonprofits, and the potential for impact investing. Key terms are defined, and the project team is described. The report will summarize findings and recommendations based on research into donor and investor behaviors and preferences.


![Eban impactinvesting final200711_light[1]](https://cdn.slidesharecdn.com/ss_thumbnails/ebanimpactinvestingfinal200711light1-110727113800-phpapp01-thumbnail.jpg?width=640&height=640&fit=bounds)


