
Recommended
Recommended
More Related Content
Similar to Momentary Assessment of Interpersonal Process in Psychotherapy.docx
Similar to Momentary Assessment of Interpersonal Process in Psychotherapy.docx (17)
More from gilpinleeanna
More from gilpinleeanna (20)
Recently uploaded
Recently uploaded (20)
Momentary Assessment of Interpersonal Process in Psychotherapy.docx
- 1. Momentary Assessment of Interpersonal Process in Psychotherapy Katherine M. Thomas and Christopher J. Hopwood Michigan State University Erik Woody and Nicole Ethier University of Waterloo Pamela Sadler Wilfrid Laurier University To demonstrate how a novel computer joystick coding method can illuminate the study of interpersonal processes in psychotherapy sessions, we applied it to Shostrom’s (1966) well-known films in which a client, Gloria, had sessions with 3 prominent psychotherapists. The joystick method, which records interpersonal behavior as nearly continuous flows on the plane defined by the interpersonal dimensions of control and affiliation, provides an excellent sampling of variability in each person’s interpersonal behavior across the session. More important, it yields extensive information about the temporal dynamics that interrelate clients’ and therapists’ behaviors. Gloria’s 3 psychotherapy sessions were characterized using time-series statistical indices and graphical representations. Results demonstrated that patterns of within-person variability tended to be markedly asymmetric, with a predominant, set-point-like inter- personal style from which deviations mostly occurred in just 1 direction (e.g., occasional submissive
- 2. departures from a modal dominant style). In addition, across each session, the therapist and client showed strongly cyclical variations in both control and affiliation, and these oscillations were entrained to different extents depending on the therapist. We interpreted different patterns of moment-to-moment complementarity of interpersonal behavior in terms of different therapeutic goals, such as fostering a positive alliance versus disconfirming the client’s interpersonal expectations. We also showed how this method can be used to provide a more detailed analysis of specific shorter segments from each of the sessions. Finally, we compared our approach to alternative techniques, such as act-to-act lagged relations and dynamic systems and pointed to a variety of possible research and training applications. Keywords: psychotherapy, process, momentary assessment, spectral analysis, interpersonal circumplex The purpose of this article is to demonstrate how a novel method for the study of moment-to-moment interpersonal processes can be applied to psychotherapy sessions and to illustrate how this method could enhance understanding of psychotherapy process. To depict the value of this method, we apply it to Shostrom’s (1966) well-known films in which a client, Gloria, met with three prominent psychotherapists with differing theoretical orienta- tions—Albert Ellis (rational– emotive), Frederick Perls (gestalt), and Carl Rogers (client-centered). These filmed therapy sessions are useful for our purpose because they are widely familiar (e.g.,
- 3. Reilly & Jacobus, 2008; Weinrach, 1990) and because we can contrast our novel approach with previous research applying a more conventional measurement approach to these sessions (Kies- ler & Goldston, 1988). Assessing Dynamic Aspects of the Therapeutic Relationship It is virtually a truism that the interpersonal relationship in therapy has a profound impact on therapy outcomes (e.g., Gold- fried, in press; Horvath, Del Re, Flückiger, & Symonds, 2011). The relationship provides the context in which interventions can be successfully implemented, and it may be particularly relevant when interpersonal difficulties are an important aspect of the client’s problems (Anchin & Pincus, 2010). Not only is a positive relationship associated with successful outcomes (Muran & Bar- ber, 2010) but, in addition, strains in the relationship are associated with therapeutic failure (Castonguay, Goldfried, Wiser, Raue, & Hayes, 1996; Henry, Schacht, & Strupp, 1986, 1990). Hence, studying the dynamic aspects of the therapeutic relationship— how it develops, varies, and changes—is important for understanding effective therapy. However, variation, pattern, and change in interpersonal behavior during an ongoing exchange are subtle and difficult to measure. One previously employed approach has been to segment the stream of behavior into discrete acts and then to examine how each kind
- 4. of act by one person is related to each subsequent kind of act by the other person. This act-to-act approach has been used successfully to study interpersonal processes in therapy and relate them to therapy out- This article was published Online First September 2, 2013. Katherine M. Thomas and Christopher J. Hopwood, Department of Psychology, Michigan State University; Erik Woody and Nicole Ethier, Department of Psychology, University of Waterloo, Waterloo, Ontario, Canada; Pamela Sadler, Department of Psychology, Wilfrid Laurier Uni- versity, Waterloo, Ontario, Canada. This research was supported by Operating Grant SRG 410-2009- 2164 from the Social Sciences and Humanities Research Council of Canada to Pamela Sadler and Erik Woody. Correspondence concerning this article should be addressed to Katherine M. Thomas, Department of Psychology, Michigan State University, East Lansing, MI 48824. E-mail: [email protected] T hi s do
- 9. oa dl y. Journal of Counseling Psychology © 2013 American Psychological Association 2014, Vol. 61, No. 1, 1–14 0022-0167/14/$12.00 DOI: 10.1037/a0034277 1 mailto:[email protected] http://dx.doi.org/10.1037/a0034277 comes (e.g., Dietzel & Abeles, 1975; Lichtenberg & Heck, 1986; Tracey, 1985; Wampold & Kim, 1989). The presently proposed method addresses the dynamic aspects of the therapeutic relationship in a different way by capturing ongoing dynamics as a reasonably continuous flow, rather than as a sequence of discrete acts. To some extent, the new method simply imposes a different frame of reference, yielding its own unique insights. Another advantage is that compared with the act-to-act approach, the method described in the present study is more time effective and thus would be more useful in practical circumstances, such as psychotherapy training and supervision (see Pincus et al., in press). A Theoretical Framework for Assessing Moment-to-Moment Interpersonal Behavior
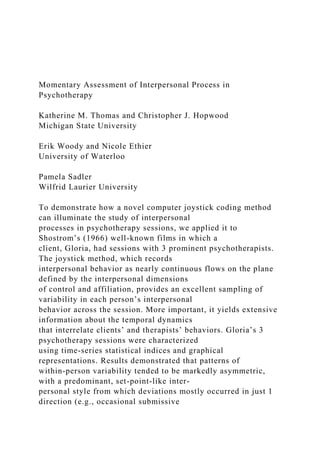
- 10. To effectively measure interpersonal process, a well-validated theoretical and measurement framework is needed. Evidence across several domains of inquiry converges to suggest that two fundamental dimensions, control (dominance to submission) and affiliation (warmth to coldness), account for variability in rela- tional functioning and behavior (Luyten & Blatt, 2013; Wiggins, 1991). These two dimensions can be operationalized using the interpersonal circumplex (IPC; Leary, 1957; Wiggins, 1996; Fig- ure 1), which offers a measurement model for conceptualizing clinically salient features of personality, psychopathology, and social processes (Pincus, Lukowitsky, & Wright, 2010). An ad- vantage of the IPC is that it reflects basic social processes and therefore can be meaningfully applied across theoretical orienta- tions. Indeed, the interpersonal model in general and the IPC in particular have been fruitfully applied to a variety of therapies, including cognitive (Safran, 1984, 1990a, 1990b), cognitive be- havioral (Hayes, 2004), interpersonal (Anchin & Pincus, 2010; Benjamin, 1996), gestalt (Benjamin, 1979), and psychodynamic (Gurtman, 1996; Horowitz, Rosenberg, & Bartholomew, 1993; Strupp & Binder, 1984). For instance, research applying the IPC to psychotherapy has found that patients respond to hostile therapists with self-blame (Henry et al., 1990) and that warmer patients improve more quickly than colder patients in psychodynamic but not in cognitive behavioral therapy (Puschner, Kraft, & Bauer, 2004). The IPC also provides a framework for making testable predic- tions about dyadic behavior as it unfolds over time. Empirical and theoretical literature suggests that interactions are most
- 11. harmoni- ous (i.e., least anxiety provoking and most stable) when individ- uals in a dyad behave in a manner that is similar with respect to affiliation but opposite with respect to control—a pattern referred to as complementarity (Kiesler, 1996; Sadler & Woody, 2003; Sadler, Ethier, Gunn, Duong, & Woody, 2009; Tracey, 2004). Based on this principle, the behaviors of one individual are pre- dicted to invite particular behaviors from the other individual in dyadic interactions (Kiesler, 1996; Leary, 1957). In brief, warmth invites warmth, whereas dominance invites submission. The principle of complementarity has been used to develop elegant models explaining the persistence of maladaptive interper- sonal behavior and the nature of psychotherapeutic interventions to change such behavior (e.g., Anchin & Pincus, 2010; Andrews, 1989; Carson, 1982; Kiesler, 1996). Work by Tracey (1993; Tracey, Sherry, & Albright, 1999) suggests that alliance- building complementarity early in psychotherapy, followed by change- promoting noncomplementarity once an alliance has been estab- lished, is associated with positive therapeutic outcomes across varied theoretical approaches. Thus, studying interpersonal com- plementarity may provide an important window into client– therapist relationship patterns that play an important role in treat- ment. A Computer Joystick Method for Coding Momentary Interpersonal Behavior Sadler and colleagues recently developed a novel joystick
- 12. method for assessing momentary interpersonal processes in dyadic interactions (Lizdek, Sadler, Woody, Ethier, & Malet, 2012; Sadler et al., 2009). As an observer uses a computer joystick to make observational ratings of recorded interactions, data on interper- sonal communications are captured twice per second and yield time series for each individual’s level of control and level of affiliation throughout an interaction. Data obtained using this method have revealed novel phenomena that occur in interactions, such as cyclical patterns of complementarity (Sadler et al., 2009). Additional research using the joystick method found that female peer dyads with greater complementarity on the warmth dimension liked one another more and performed lab tasks more accurately (Markey, Lowmaster, & Eichler, 2010) and that parallel processes occur between therapy and supervision (Tracey, Bludworth, & Glidden-Tracey, 2012). Each of these studies showed considerable variability in the degree of complementarity observed across dy- ads, indicating that the joystick method is sensitive to dyadic and individual differences that affect interpersonal processes. The Present Study Kiesler and Goldston (1988) applied the IPC and the principle of complementarity to Gloria’s sessions with Ellis, Perls, and Rogers by having raters complete the Checklist of Psychotherapy Trans-
- 13. actions (CLOPT; Kiesler, Goldston, & Schmidt, 1991). This in- strument is a 96-item checklist of interpersonal behaviors that the C on tr ol Affiliation Warm Cold Dominant Submissive Figure 1. The interpersonal circumplex (IPC). T hi s do cu m en t is co py
- 17. al us er an d is no t to be di ss em in at ed br oa dl y. 2 THOMAS, HOPWOOD, WOODY, ETHIER, AND SADLER rater completes, once for the therapist and again for the client,
- 18. after having watched a therapy session. Kiesler and Goldston found that in terms of aggregate measures of behavior, Gloria displayed the highest degree of complementarity with Ellis, followed by Rogers, and the least with Perls. Although useful, this approach does not provide any information about the temporal dynamics that un- folded in each session; indeed, it is even insensitive to how long and how often any behavior occurred (each behavior is simply marked as present or absent during a session). Kiesler (1996, p. 91) drew attention to the importance of techniques that might reveal “patterned redundancies occurring over time,” rather than simply a static snapshot of the partners’ overall interpersonal styles. Accordingly, in the present study, we use the computer joystick method to apply the IPC and the principle of complementarity to the Gloria sessions. There are two main novel implications of this approach. 1. The method provides an excellent sampling of within-person variability in interpersonal behavior for each person in the inter- action. Thus, we asked the following research questions: What patterns of variability for each partner are evident in these psy- chotherapy sessions? How might these patterns of variability illu- minate the nature of the interaction? 2. The method provides a great deal of information about how the streams of behavior by the therapist and client are interrelated.
- 19. Hence, we asked the following research questions: Do the partners show shifts in their overall levels of control and affiliation, and are these shifts consistent with the principle of complementarity (e.g., linear slopes with diverging levels of control)? Do partners show cyclical or oscillating variations in control and affiliation, and to what extent are these oscillations synchronized and entrained? Finally, what might differing degrees of interpersonal entrainment tell us about the nature of the therapeutic relationship in these sessions? Method Procedure To examine momentary interpersonal behavior throughout Glo- ria’s sessions, raters recorded their impressions of the continuous stream of interpersonal behavior by watching a session, focusing their attention on either Gloria or the therapist, and using a com- puter joystick apparatus to indicate the target person’s momentary standing on the IPC. Subsequently, raters watched the session again and made similar ratings of the other person in the session. The order of these assessments was arranged such that Gloria was never consecutively rated from two different sessions, nor was the
- 20. same session ever consecutively rated. The joystick was scaled from �1,000 (submissiveness; coldness) to 1,000 (dominance; warmth), and the computer recorded the rater’s joystick placement along both axes twice per second. Seven undergraduate students underwent careful individual training on the joystick method prior to rating Gloria’s sessions. We used the training protocol outlined by Sadler et al. (2009) to introduce raters to the joystick method. Raters were instructed to make behaviorally anchored ratings by moving the joystick in accord with any of the target person’s statements, nonverbal be- haviors, fluctuations in tone, and so forth, that constituted an increase or decrease in control or affiliation. Thus, raters moved the joystick in a reasonably continuous way to represent their perceptions of changes in interpersonal behavior. Raters were informed that the joystick position should also represent any times in which the absence of a behavior signified or sustained a mean- ingful interpersonal action (e.g., if an individual remained silent after being asked a question). When no discernible changes in interpersonal behavior were displayed, raters maintained their joy- stick position until the person made a meaningful interpersonal gesture. However, slight gestures, such as eye contact, engage- ment, tone, and so forth, were coded, and thus the joystick was frequently in motion, capturing these behavioral variations. Raters were not told about the concept of complementarity. As part of their training, raters used the joystick to code the interpersonal behavior in another set of therapy dyads, Shostrom’s
- 21. (1976) Three Approaches to Psychotherapy, with a client named Kathy. This resulted in six trial assessments of a format identical to the Gloria films. Prior to coding Gloria’s sessions, each rater was required to demonstrate good consistency of his or her ratings with those of previously trained raters (authors Thomas and Hop- wood). All raters consistently demonstrated cross-correlations above .50 with trained raters on the control and affiliation dimen- sions for both individuals in each of the training videos. Sadler et al. (2009) showed that this level of cross-correlation is sufficient to obtain very good reliability of the moment-to-moment ratings, once they are aggregated across the raters. Once trained, raters coded all three therapists and Gloria with each therapist (i.e., six total coding sessions). At this juncture, further checks were performed on the quality of each rater’s data. Specifically, 2 weeks after initially coding Gloria’s sessions, each rater watched and recoded two individuals (always Gloria from one session and a therapist from a different session). Cross- correlations between initial and follow-up joystick ratings were computed for both axes to assess self-consistency for each rater. Because of relatively low self-consistency (cross-correlations � .50), one rater’s data were discarded from further consideration. In addition, the consistency of each rater’s data with the group average omitting that rater’s data were assessed. All six remaining raters achieved cross-correlations � .50 (M � .55) with the group
- 22. average across at least 10 of the 12 variable sets (i.e., control and affiliation for each therapist and Gloria with each therapist). Final Joystick Data The first 10 data points for each interactant were deleted to allow raters 5 s to orient themselves to the interaction (as in Sadler et al., 2009). Joystick data were then averaged across raters at each time point to obtain the final time series data for each interactant across both IPC dimensions. All subsequent analyses were con- ducted using these data (aggregated across the six raters). These half-second ratings for affiliation and control across the three dyads yielded 12 total bivariate time series. Data collected for each dyad differed based on the amount of time each therapist spent with Gloria. We collected 2,185 data points for Ellis’s session with Gloria (18 min, 12 s); 2,822 data points for Perls’s session (23 min, 31 s); and 3,811 data points for Rogers’s session (31 min, 45 s). The reliability of the aggregated time series was assessed using an approach that compares the true score (i.e., shared) variance to the total variance for each time series, as described in Sadler et al. (2009). Specifically, the true score variance was estimated as the T hi
- 27. ed br oa dl y. 3MOMENTARY ASSESSMENT OF PROCESS mean of the cross covariances of the individual raters’ times series, and the total variance was estimated as the variance of the aggre- gated time series. This approach yielded reliabilities of .80 for control and .66 for affiliation, comparable to values obtained in other published work using the joystick method (Markey et al., 2010; Sadler et al., 2009). In addition to using these data to characterize interpersonal processes over time, we were interested in the global ratings obtained by calculating the mean of each time series (control or affiliation) for each rater and each interactant (i.e., Gloria with Ellis, Ellis, etc.). Past research has demonstrated that these global ratings have strong reliability (Markey et al., 2010; Sadler et al., 2009). The present data are limited for assessing such reliability because of the small number of cases (six targets); however, it is reassuring that Cronbach’s alpha, calculated by treating raters as items, yielded values of .80 (affiliation) and .95 (control).
- 28. Calculation of Indices In addition to the global levels of control and affiliation, calcu- lated as the means across each person’s entire aggregated time series, we derived a variety of other indices, the calculations of which are outlined below. Indices of within-person variability. For each person in a session, we calculated the standard deviation across the entire time series for control and for affiliation. We also computed the corre- lation between each person’s control and his or her affiliation across the entire time series. These indices provide quantitative information regarding the nature of a person’s variation in inter- personal behavior across a session. Density plots. As another way to characterize each person’s pattern of interpersonal variability across a session, we used the procedure smoothScatter (R Development Core Team, 2011) in the statistical software package R to derive a bivariate density plot on the interpersonal plane defined by the affiliation and control axes. The procedure parameters used were the following: nbin � 500, bandwidth � 70, transformation � function(x) x ˆ.8. The densest parts of the distribution are colored black, and the less dense parts successively lighter shades of gray. A major advantage of this approach is that it preserves the actual shape of the density distri- bution, which is particularly important if the distribution is not bivariate normal.
- 29. Linear trends in levels. For each person in a session, we used ordinary least squares regression to predict the individual’s moment-to-moment interpersonal scores (control or affiliation) using time as the predictor variable. Each regression yielded an intercept, indexing the estimated value at the beginning of the session, and a slope, indexing the rate of linear change over the course of the session. We also calculated the R2, which indicates the proportion of variance explained by the linear trend. The residuals from these regression analyses also provided the data used for spectral and cross-spectral analyses (in which linear trends could otherwise serve as a confound; Warner, 1998). Indices of oscillation and entrainment. To derive indices of cyclical processes and entrainment, we conducted spectral and cross-spectral analyses on the detrended data for each session following the procedures detailed in Sadler et al. (2009). The results of these analyses were summarized using three different types of index: rhythmicity, average weighted coherence, and average weighted phase. Rhythmicity was computed as the propor- tion of variance in a time series that is accounted for by frequen- cies with periods longer than 30 s (the rationale being that, at least in social interactions, frequencies higher than this are likely to represent noise). This range of frequencies was also used in the calculation of the coherence and phase statistics. Rhythmicity values indicate the extent to which variations in control or affili- ation are explained by cyclical patterns. The average weighted coherence was computed by weighting the coherence value at each frequency band in the cross-spectral analysis by the amounts of variance at the same frequency band
- 30. in the univariate spectral analyses (Sadler et al., 2009; Warner, 1998). The resulting value is a nondirectional index of the proportion of variance in one time series that can be predicted by the other time series, thereby indicating the attunement of cycles across members of a dyad. Coherence ranges from 0 to 1, with higher values indicating greater entrainment. The average weighted phase was computed by weighting the phase values at each frequency band in the cross-spectral analysis in the same way as described for the coherence. Phase values indicate proportions of a full cycle and range from �.5, through 0, to .5. (Because phase is a circular statistic, the values of �.5 and .5 are logically indistinguishable, both falling half a cycle away from zero.) A phase value of zero indicates that the partners’ behaviors are exactly in phase, with peaks and troughs coinciding exactly. A phase value of .5 or �.5 indicates that the partners’ behaviors are completely out of phase, with peaks for one person coinciding with troughs for the other. Intermediate values can be interpreted as one individual’s variation leading the other person’s variation, as described later in the Results section. As a final index of entrainment that is not a component of the spectral and cross-spectral analyses, we calculated the cross- correlation of the time series for the two interacting partners for control and for affiliation. This intuitively accessible, directional value indicates how strongly correlated the two partners’
- 31. behaviors were throughout the interaction. Results Global Levels of Control and Affiliation The overall means of control and affiliation for Gloria and the corresponding therapist are presented in Table 1. From these means, it is clear that not only did the three therapists have very different interpersonal styles but also that Gloria’s interpersonal style was strongly affected by the therapist with whom she was interacting. The configuration of means is readily appreciated in Figure 2, where a white plus sign denotes each overall interper- sonal style (the centroid, which is the intersection of the person’s control mean and affiliation mean). Among the therapists, Ellis and Perls had dominant styles, whereas Rogers had a submissive style; Rogers had the warmest style and Perls the coldest. Gloria’s overall interpersonal styles show striking complementarity with Ellis and with Rogers. To Ellis’s warm– dominant style, she tended to respond with a warm–submissive style, whereas to Rogers’s warm–submissive style, she responded with a warm– dominant style. In contrast, Gloria’s response to Perls’s cold– dominant style shows the deviation from classical complementarity noted by Orford (1986) and others; overall, she responded with a similarly T hi s do
- 36. oa dl y. 4 THOMAS, HOPWOOD, WOODY, ETHIER, AND SADLER cold– dominant style. These findings for overall style are quite similar to the findings of Kiesler and Goldston (1988), even though our method differs considerably from theirs. Within-Person Variability Indices of variability of interpersonal behavior for each person are also provided in Table 1. The standard deviations, which index how much each person varied on each interpersonal dimension, show some very large differences in the amounts of variability. For example, Ellis showed almost three times as much variability in control as Rogers, and Perls showed almost three times as much variability in affiliation as Rogers. The amount of variability in Gloria’s interpersonal behavior was generally quite large; for ex- ample, her control behavior in the interaction with Ellis yielded the largest standard deviation in this data set. Another potentially useful index of the nature of within-person variability is the correlation of control and affiliation (Table 1). The most striking finding is the strong negative correlation be- tween Gloria’s levels of control and affiliation in her
- 37. interaction with Perls. This finding indicates that as she became more domi- nant with Perls, she also strongly tended to become colder. In contrast, her tendency to be affiliative at times when she was dominant was minimally, but positively, correlated in her sessions with Ellis and Rogers. These standard deviations and correlations provide valuable quantitative indices of variability; however, they may be somewhat limited in how fully they convey underlying patterns of variability. This is because the actual patterns of variability do not necessarily follow the assumptions of a bivariate normal distribution (e.g., symmetry of the data points around the intersection of the means). Figure 2 shows the density distributions in a manner that preserves their actual shapes. For each person’s interpersonal behavior, the darkest area is, in effect, a bivariate mode, showing what may be regarded as the person’s interpersonal set point in the interaction. The gray areas show the patterns of deviation from this interper- sonal set point. Note that the actual patterns of variability are often quite asym- metric. Consider, for example, the density distribution for Ellis. His predominant style was strongly dominant, depicted at the top like the head of a comet; however, he tended to diverge strongly
- 38. from this predominant pattern, switching periodically to a far more submissive style, shown as the tail of the comet. Note that this pattern is not at all bivariate normal. The deviations from the predominant style are mostly in just one direction (downward); indeed, these asymmetric deviations pull the centroid (denoted by the white plus sign) well below Ellis’s modal style. In response to Ellis, Gloria showed a predominantly warm–submissive style, but the deviations from this interpersonal set point are very extensive, reaching far up into dominant behavior and even straying occa- sionally toward greater warmth. As for Ellis, these asymmetric deviations (upward and to the right) pull Gloria’s centroid outside what is actually her modal interpersonal style in the interaction. Unlike Ellis, Perls’s pattern of variability around his modal interpersonal style (cold– dominant) is reasonably symmetric. In response to Perls, Gloria’s pattern of variability is very distinctive. Her predominant response is near the origin (neutral in both control and affiliation), but her deviations from this set point extend diagonally very far to the upper left of the IPC (hostile– dominant). The shape of her density distribution is consistent with the strongly negative correlation found between her control and affiliation (in Table 1). Finally, Rogers and Gloria both show a narrow range of varia- tion on affiliation, but striking variability on control. Note that Rogers’s deviations from his warm–submissive set point are
- 39. mostly upward, toward greater dominance, whereas Gloria’s de- viations from her warm– dominant set point are mostly downward, toward greater submissiveness. As a result, their density distribu- tions overlap considerably. Temporal Dynamics That Interrelate the Partners’ Behaviors in the Interaction Although the foregoing patterns of each partner’s within-person variability are quite interesting, they cannot show important tem- poral dynamic aspects of the interaction that crucially interrelate the partners’ behaviors. To illustrate, consider again the density plots for Ellis and Gloria with Ellis (in Figure 2). We wanted to know whether the occasions during which Ellis’s interpersonal style veers toward submissiveness are associated with the occa- sions during which Gloria’s interpersonal style veers toward greater dominance. Because the density plots collapse across time, they cannot provide us with this kind of information. One way in which partners’ behaviors may be associated across the time course of the interaction concerns linear trends in each person’s level over time. Information about these linear shifts is provided in the linear regressions portion of Table 2. For example, consider control in the interaction between Ellis and Gloria. For Ellis, the intercept tells us that he began the interaction being somewhat dominant, and the slope tells us that he increased in Table 1 Means, Standard Deviations, and Within-Person Correlations
- 40. Variable Control Affiliation Correlation of control and affiliationM SD M SD Gloria’s behavior Gloria w/Ellis �116.17 283.59 105.36 108.50 .14 Gloria w/Perls 180.78 216.65 �127.56 232.72 �.56 Gloria w/Rogers 123.03 244.38 243.45 80.05 .12 Therapist’s behavior Ellis 471.48 259.56 110.28 58.48 �.32 Perls 295.84 169.94 �11.23 113.56 �.23 Rogers �99.01 89.91 249.75 39.04 .11 T hi s do cu m en t is co py ri gh
- 44. er an d is no t to be di ss em in at ed br oa dl y. 5MOMENTARY ASSESSMENT OF PROCESS dominance rather steeply over the course of the interaction. This linear trend explained 24% of his variance in control. For Gloria with Ellis, her intercept tells us that she began the interaction
- 45. being slightly dominant, and her slope tells us that she decreased in dominance quite steeply over the course of the interaction. This linear trend explained 16% of her variance in control. Thus, consistent with reciprocity of overall shifts in control, Ellis and Gloria moved apart in control over the course of the interaction, with Ellis becoming more dominant and Gloria more submissive. For Gloria’s sessions with Perls and with Rogers, such linear trends were much less substantial, as indicated by the small R2 values. Another way in which partners’ behaviors may be associated across the time course of the interaction is probably more impor- Figure 2. Density plots (centroids, or means on both dimensions, are shown with a white plus sign). T hi s do cu m en t is co
- 49. du al us er an d is no t to be di ss em in at ed br oa dl y. 6 THOMAS, HOPWOOD, WOODY, ETHIER, AND SADLER
- 50. tant for understanding interaction dynamics. As discussed previ- ously, to the extent that the partners show cyclical or oscillating patterns of interpersonal behavior, these oscillations may become synchronized and entrained between the partners. Information about these phenomena is provided in the spectral analysis portion of Table 2. For example, consider again control in the interaction between Ellis and Gloria. The rhythmicity values for Gloria with Ellis and for Ellis tell us that both partners’ behavior in the interaction strongly tended to fall in reasonably regular cycles (specifically, once linear trends are removed, about 90% of the variance in Gloria’s control behavior and about 87% of the vari- ance in Ellis’s control behavior are attributable to cyclical trends). Thus, there is certainly the potential that these cyclical varia- tions could have become entrained between Gloria and Ellis. The value for average weighted coherence indexes the extent of such entrainment. This value is akin to a squared correlation and takes on values between 0 and 1. The obtained value of .75 indicates a high degree of entrainment of cyclical variations in levels of control between Gloria and Ellis. Note that the other average weighted coherence values for control indicate that Gloria and Rogers were similarly highly entrained, whereas there was much more modest entrainment between Gloria and Perls. The average weighted coherence as an index of entrainment emerges from relatively complex statistical machinations on the data; however, the intuitive meaning of what these values capture is readily conveyed. The top panel of Figure 3 shows Gloria’s and Ellis’s moment-to-moment levels of control over the first 10 min of their interaction. (Showing the entire inter- action makes the time scale too compressed to see patterns
- 51. clearly.) First, note that as the rhythmicity values indicated, the moment-to-moment variations for both people are reasonably cyclical in nature; indeed, they tend to have a relatively con- sistent period of roughly a minute. Second, note that as the coherence value indicated, these cycles are strongly related, with peaks for one person tending to occur together with troughs for the other person. In contrast, the top panel of Figure 4, depicting moment-to-moment levels of control for Perls and Gloria, shows a less consistently entrained pattern of variation, which is consistent with the lower coherence value obtained from their interaction data. Akin to Figure 3, the top panel of Figure 5, depicting Gloria and Rogers’s moment-to-moment levels of control, shows highly entrained cycles, consistent with relatively high rhythmicity and coherence values. An index of entrainment that is quite similar to the average weighted coherence but more intuitively approachable is the cross- correlation between the partners. Returning to the top panel of Figure 3, showing Gloria’s and Ellis’s moment-to-moment levels of control, this pattern should yield a strong negative correlation between their moment-to-moment values. Cross-correlations are presented in the last column of Table 2, and we see that the correlation between Gloria’s and Ellis’s levels of control is a whopping �.84. This negative relation is very consistent with the principle of reciprocity of control in interpersonal theory, but here we are applying this principle at the level of moment-to-moment variations in control, not at the level of global interpersonal style (as in, e.g., Kiesler & Goldston, 1988). As shown in Table 2, the
- 52. cross-correlations for control are clearly negative for the other two therapy interactions, and their relative magnitudes map consis- tently onto the corresponding average weighted coherence values and the time series graphs. Table 2 also shows the results for entrainment of affiliation. The values for the average weighted coherence indicate strong entrain- ment of moment-to-moment levels of affiliation between Gloria and Ellis, and more modest levels of such entrainment between Gloria and Perls and between Gloria and Rogers. Note that the corresponding cross-correlations for affiliation are positive, rather than negative as for control. This positive relation is very consistent with the principle of correspondence of affiliation in interpersonal theory (e.g., warmth invites warmth; coldness invites coldness). The lower panels of Figures 3–5 show the partners’ levels of affiliation over the first 10 min of each session. It can be seen that with affiliation, the prevailing tendency is for peaks in one person to go together with peaks in the other person, and troughs with troughs. Table 2 Results From Linear Regressions, Spectral and Cross-Spectral Analyses, and Cross-Correlations Variable
- 53. Linear regressions Spectral analysis Cross-correlationR2 Intercept Slopea Rhythmicity Avg. weighted coherence Avg. weighted phase Control Gloria w/Ellis .16 84.58 �438.42 .90 .75 .46 �.84 Ellis .24 250.66 482.26 .87 Gloria w/Perls .00 199.94 �32.43 .86 .39 �.46 �.45 Perls .00 313.43 �29.79 .80 Gloria w/Rogers .00 131.14 �10.17 .85 .69 .50 �.77 Rogers .00 �93.53 �6.90 .83 Affiliation Gloria w/Ellis .05 147.00 �90.93 .94 .89 �.01 .61 Ellis .00 116.29 �13.11 .93 Gloria w/Perls .04 �46.05 �137.99 .96 .20 �.07 .28 Perls .04 �50.38 66.27 .93 Gloria w/Rogers .01 253.64 �12.79 .84 .36 .03 .30 Rogers .06 266.04 �20.44 .79 Note. Avg. � average. a Slope is the linear change over a 10-min period. T hi s do cu
- 58. dl y. 7MOMENTARY ASSESSMENT OF PROCESS From the cross-spectral analysis, as a supplement to the average weighted coherence, it is possible to calculate the average weighted phase. These phase values for control and for affiliation in each of the three therapy interactions are provided in Table 2. Consider first the phase values for affiliation. If the peaks in one person’s oscillations in affiliation exactly coincided with the peaks in the other person’s oscillations in affiliation, and troughs coin- cided with troughs, then the phase value would equal zero. In these data, positive phase values indicate that the peaks for Gloria were tending to lead the peaks for the therapist, whereas negative values indicate that peaks for the therapist were tending to lead the peaks for Gloria. The values in Table 2 are quite close to zero, but the �.07 for the session between Gloria and Perls suggests that Perls tended to lead the variations in Gloria’s affiliation levels. According to the principle of reciprocity on control, we would expect the peaks in each person’s oscillations to occur together
- 59. Figure 3. Bivariate time series for Gloria’s (solid) and Ellis’s (dotted) control and affiliation behavior. Figure 4. Bivariate time series for Gloria’s (solid) and Perls’s (dotted) control and affiliation behavior. T hi s do cu m en t is co py ri gh te d by th e A m
- 63. be di ss em in at ed br oa dl y. 8 THOMAS, HOPWOOD, WOODY, ETHIER, AND SADLER with the troughs in the other person’s oscillations. In this case, the phase value would equal .50 (or –.50, which is logically equiva- lent, as explained earlier). This is the value obtained for the session between Gloria and Rogers, which indicates that neither was leading the other. The phase value of .46 for Gloria with Ellis, because it is .04 less than .50, suggests a slight tendency for Gloria’s peaks in control to precede the troughs for Ellis (specif- ically, by about 4% of a full cycle, or roughly 2.5 s). The phase value of –.46 for Gloria with Perls, because it is .04 away from �.50, suggests a slight tendency for Perls’s peaks to precede Gloria’s troughs. Although these phase values can suggest lead– lag relations between the partners, it is important not to
- 64. interpret them too simplistically (Warner, 1998). To summarize the most important findings concerning entrain- ment of interpersonal behavior, Ellis and Gloria showed high levels of entrainment of both control and affiliation, and Rogers and Gloria also showed fairly high levels of entrainment, particu- larly for control. In contrast, Perls and Gloria showed relatively low levels of entrainment for both control and affiliation. In other words, at the level of moment-to-moment variations, their session tended not to follow the interpersonal principles of oppositeness on control and sameness on affiliation. Most likely, this stemmed from an intentional strategy by Perls, in which the client’s inter- personal expectations are deliberately disconfirmed for therapeutic reasons (e.g., Beier & Valens, 1975; Carson, 1982; Kiesler, 1996). Indeed, in the filmed aftermath to the sessions, it became clear that although Gloria found Perls’s behavior frustrating, she also found the session to be intriguing and thought provoking. Examining Windows of an Interaction When examining graphs and results from a complete interaction, one might note patterns in the data at particular times that merit further exploration (e.g., showing marked deviations from com- plementarity). Furthermore, if a clinician were to recall a qualita-
- 65. tively key moment in an interaction, data from this window could be explored further, both graphically and statistically. In either case, these patterns and key moments can be explored by zooming in to a specified segment of an interaction and examining data from this window of the interaction. Because the joystick method provides so much data (e.g., a 5-min interaction yields 600 data points), the analyses described above, among many others, can generally be applied to brief segments from an interaction. To illustrate this possibility, we examined cross-correlations for no- table segments of Gloria’s interaction with each therapist to test their complementarity during these selected times. Gloria and Ellis. This dyad exhibited the highest degree of complementarity on the affiliation dimension, with the highest cross-correlations and coherence of the three dyads. They also both tended to behave neutrally to warmly. Therefore, in examining their bivariate time series for affiliation (Figure 3), it was notable that partway through the interaction Gloria became less friendly and was rated on the cold half of the circumplex, even though ratings for Ellis generally remained warmer during this time. To examine this shift in Gloria’s affiliation, we looked at the tran- script1 and data from the 450- to 550-s window: Ellis: You’re not merely concerned, you’re overconcerned; you’re anxious. Because if you were just concerned, you’d do your best, and you’d be saying to yourself, “If I succeed, great; if I don’t succeed, tough, right now I won’t get what I want.” But you’re
- 66. overconcerned, 1 From Three Approaches to Psychotherapy, by E. L. Shostrom, 1966, 1976, Santa Ana, CA: Psychological and Educational Films. Copyright 1966, 1976, by E. L. Shostrom. Transcript used with permission. Note that in making behaviorally anchored ratings, tone, gestures, expressions, pos- ture, and so forth were critical. Thus, these transcripts cannot capture all of the important processes occurring in this interaction. Figure 5. Bivariate time series for Gloria’s (solid) and Rogers’s (dotted) control and affiliation behavior. T hi s do cu m en t is co py ri gh
- 70. er an d is no t to be di ss em in at ed br oa dl y. 9MOMENTARY ASSESSMENT OF PROCESS you’re anxious, you’re really saying again what we said a moment ago: “If I don’t get what I want right now, I’ll never get it, and that
- 71. would be so awful that I’ve got to get it right now.” That causes the anxiety, doesn’t it? Gloria: Yes, or else work towards it. Ellis: Yes, but if you . . . Gloria (interrupts): But if I don’t get it right now, that’s all right, but I want to feel like I’m working toward it. Ellis: Yeah, but you want a guarantee, I hear. My trained ears hear you saying, “I would like a guarantee of working towards it.” And there are no certainties and guarantees. Gloria: Well, no, Dr. Ellis, I don’t know why I am coming out that way. What I really mean is “I want a step toward working towards it.” I want . . . Ellis (interrupts): Well, what’s stopping you? Gloria: I don’t know, I thought . . . Well, what I was hoping is that whatever this is in me, why I don’t seem to be attracting these kinds of men, why I seem more on the defensive, why I seem more afraid, you could help me [with] what it is I’m afraid of, so I won’t do it so much.
- 72. Ellis: Well, my hypothesis is so far that what you’re afraid of is not just failing with this individual man, which is really the only issue when you go out with a new—and we’re talking about eligible males now, we’ll rule out the ineligible ones—you’re not just afraid that you’ll miss this one: You’re afraid that you’ll miss this one, and therefore you’ll miss every other, and therefore you’ll prove that you are really not up to getting what you want and wouldn’t that be awful. You’re bringing in these catastrophes. Gloria: Well, you sound more strong at it, but that’s similar. I feel like this is silly if I keep this up. Ellis: If you keep what up? Gloria: There’s something I’m doing; there’s something I’m doing not to be as real a person with these men that I’m interested in. Ellis: That’s right. You’re defeating your own ends. Panel A of Figure 6 shows the bivariate time series for affiliation during this segment of their session. In addition to Gloria’s low levels of friendliness during this time, cross-correlations indicate a very noncomplementary pattern of affiliation (r � –.48). Qualitative anal- ysis of the transcript suggests that Ellis was presuming the
- 73. extent of Gloria’s problems to be more severe and pervasive than she felt they were. It is also notable that he interrupts her during this time and asserts dominance with phrases such as “my trained ears.” Given that their session was otherwise highly complementary with regard to affiliation, a windowed analysis such as this can illuminate times when their interaction did not flow smoothly and might prove useful for evaluating client–therapist transactions in therapy. Gloria and Perls. Therapists may employ anticomplementary patterns as a means of increasing anxiety and arousing affect. Among the therapists in this study, Perls’s behavior was the least complementary, and he often challenged Gloria. We examined complementarity during a time when Perls clearly aroused nega- tive affect in Gloria. We chose the following window, which occurred approximately a third of the way into their interaction (data ranging from 300 to 375 s): Perls: No, you’re a bluff. You’re a phony. Gloria: Do you believe, are you meaning that seriously? Perls: Yeah, if you say you’re afraid, and you laugh, and you giggle, and you squirm, it’s phony. You put on a performance for me. Gloria: Oh, I resent that, very much.
- 74. Perls: Can you express this? Gloria: Yes sir, I most certainly am not being phony. I will admit this: It’s hard for me to show my embarrassment, and I’m afraid to be embarrassed, but boy, I resent you calling me a “phony.” Just because I smile when I’m embarrassed or when I’m being put in a corner doesn’t mean I’m a phony. Perls: Wonderful, thank you. You didn’t smile for the last minute. Gloria: Well, I’m mad at you. Perls: That’s (Gloria tries to interrupt), that’s right. You didn’t have to cover up your anger with your smile. Now in that moment, in that minute, you were not phony. Figure 6. Windows into sessions: Gloria (solid) with therapists (dotted). T hi s do cu m en t
- 79. 10 THOMAS, HOPWOOD, WOODY, ETHIER, AND SADLER Gloria: Well, at that minute I was mad though, I wasn’t embarrassed. Perls: Exactly, when you’re mad, you’re not a phony. Gloria: I still resent that. I’m not a phony when I’m nervous (hits the couch). Perls (interrupts): What is that? Again. Gloria (hits couch): I want to get mad at you. I, I, you know what I would like to do? Perls (mockingly interrupts): I, I, I. Gloria: I want you on my level, so I can pick on you just as much as you are picking on me. Perls: Okay, pick on me. Panel B of Figure 6 shows the bivariate time series of control during this segment. Cross-correlations suggest that Gloria and Perls’s interaction was not complementary on either dimension during this time (affiliation: r � –.03; control: r � .39). Further, the cross-correlation between Gloria’s own dominance and friendliness was strongly negative (r � –.86) during this win- dow, suggesting that her simultaneous movements toward in- creased dominance and unfriendliness were sometimes even more strongly associated than her overall cross-correlation in
- 80. Table 2 suggests. These ratings are understandable given that anger projects into the cold– dominant quadrant of the IPC (McCrae & Costa, 1989), and Gloria twice states that she is “mad” during this segment. Gloria and Rogers. We evaluated data from the following segment of Gloria’s session with Rogers, which has received prior empirical attention (e.g., Reilly & Jacobus, 2008; Weinrach, 1990) and is notably sentimental. Near the end of the session (data ranging from 1,500 to 1,690 s), Gloria and Rogers have the following interchange: Rogers: You know perfectly within yourself a feeling that occurs when you’re really doing something that’s right for you. Gloria: I do, I do. And I miss that feeling other times; it’s right away a clue to me. Rogers: You can really listen to yourself sometimes and realize: “No, no, this isn’t the right feeling; this isn’t the way I would feel if I was doing what I really wanted to do.” Gloria: But yet, many times I’ll go along and do it anyway. Say, “Oh well, I’m in the situation now, I’ll just remember next time.” Uh, I mention this word a lot in therapy, and most therapists grin at me or giggle or something when I say “utopia.” But when I do follow a
- 81. feeling, and I feel this good feeling inside me, that’s sort of utopia; that’s what I mean, that’s a way I like to feel whether it’s a bad thing or a good thing. But I feel right about me. This is what I want to accomplish. Rogers: I sense that in those utopian moments you really feel kind of whole, you feel all in one piece. Gloria: Yeah, yeah, it gives me a choked-up feeling when you say that because I feel I don’t get that as often as I’d like. I like that whole feeling, that’s real precious to me. Rogers: I expect none of us get it as often as we’d like, but I really do understand. Mm– hmm, that really does touch you, didn’t it? Gloria: You know what else I was just thinking? I feel dumb saying it. (Pause) All of a sudden as I’m talking to you I thought, “Gee how nice I can talk to you, and I want you to approve of me, and I respect you, but I miss that my father couldn’t talk to me like you are.” I mean, I’d like to say, “Gee, I’d like to have you for my father.” I don’t even know why that came to me. Rogers: You look to me like a pretty nice daughter. Cross-correlations of the control dimension at this time suggest
- 82. an especially high degree of dominance reciprocity (r � –.84), and examination of the bivariate time series for control (Panel C of Figure 6) indicates the presence of cycling. During this portion of the interview, as Rogers becomes more dominant, Gloria becomes more submissive, and vice versa, with these behaviors occurring in near perfect synchrony. Gloria and Rogers were also especially correspondent (r � .44) in their levels of friendliness during this segment. Therefore, close examination of this portion of their interview provides a window for viewing strong patterns of inter- personal complementarity, with each individual taking control and then stepping back to allow the other to take control, and mutually adjusting to one another as this process unfolds. Discussion We used these psychotherapy sessions with Gloria to demon- strate some of the fruitful ways in which the joystick method can be applied to psychotherapy research. Some of the phenomena revealed are very intriguing and would be difficult to capture using other methods. With regard to our first set of research questions, the patterns of within-person variability in levels of control and affiliation were quite interesting. For example, Ellis showed a very clear predom-
- 83. inant pattern of moderately friendly, very strongly dominant be- havior, from which he periodically diverged to a markedly more submissive style. What kind of underlying mental process would yield such a pattern? One intriguing possibility is that highly dominant behavior was Ellis’s default, relatively automatic mode, and that the more submissive episodes may have been intentional overrides of this mode, in which, for example, Ellis was trying to be more collaborative. This is the kind of pattern one might see in novice therapists who are highly dominant but whose clinical supervisor has told them to be more collaborative. Effortful pro- cessing would produce the less dominant episodes, and repeated return to the more automatic default would produce the highly dominant set point. The other density plots also tended to show patterns of variabil- ity in which there was a clear interpersonal set point, with diver- gences away from it in just one direction. In their asymmetry, these patterns are strikingly unlike a bivariate normal distribution. In addition, they are unlike other patterns reported in the interper- sonal literature. Mainly on the basis of the study of multiple- occasion diary data, Moskowitz and Zuroff (2004) have described within-person variability in interpersonal behavior in terms of characteristics like pulse and spin, which are defined in terms of patterns of divergence from a person’s predominant interpersonal style. However, the patterns found here appear to be different from pulse and spin. For pulse, we would expect variation along a radius
- 88. in at ed br oa dl y. 11MOMENTARY ASSESSMENT OF PROCESS from the origin through the person’s predominant style; such a direction of variation does not characterize any of the density plots, except perhaps Perls’s. For spin, we would expect angular varia- tion perpendicular to this radius, which also does not characterize any of the density plots well. In short, further study of the partic- ular patterns of variation found in psychotherapy sessions should avoid preconceptions about the form these patterns may take. The patterns of variability in interpersonal behavior shown by Gloria were remarkably different in response to the three thera- pists. For example, only with Perls did she show a strong inverse relation between her levels of control and affiliation. Her periodic efforts to take control and reset the nature of their interaction
- 89. tended to be accompanied by striking decreases in her warmth. Indeed, comparing her behavior across the three therapists, her interpersonal variation was mainly in three different directions: with Ellis, toward greater dominance (and sometimes greater warmth); with Perls, toward greater hostile dominance; and with Rogers, toward greater submissiveness. These different patterns of variability provide striking evidence of the powerful effect of a therapist’s style on a client’s interpersonal dynamics. With regard to our second set of research questions, the dynamic patterns interlinking the partners’ interpersonal behaviors were also quite telling. Of the greatest importance were differences in the degree of entrainment between partners’ oscillating levels of control and affiliation. Relatively high degrees of entrainment, such as those seen in the sessions with Ellis and with Rogers, probably contribute crucially to the sense of a satisfying, predict- able therapeutic alliance, because the entrained variations follow the principles of interpersonal complementarity. In contrast, as mentioned earlier, the relatively low levels of entrainment in the session with Perls probably reflected a deliberate therapeutic strat- egy on his part, in which the client’s typical interpersonal expec- tations are not met or even disconfirmed. This noncomplementary strategy may be an important technique for eliciting reflection about and change in the client’s interpersonal behaviors (e.g., Carson, 1969; Kiesler, 1996; Tracey et al., 1999). In short, inter- personal strategies enacted by the therapist should show up as
- 90. different patterns of dynamics in the therapy sessions, and the dynamical patterns obtained can be examined to study whether the therapist’s interventions are having the desired effects on the client’s inter- personal patterns. As we have pointed out elsewhere (Sadler et al., 2009, Sadler, Ethier, & Woody, 2011), measuring variation in interpersonal behavior over time opens up the possibility of distinguishing multiple, and conceptually separate, levels of complementarity. In addition to the degree of complementarity of two partners’ global interpersonal styles, we can examine the complementa- rity of steady shifts in overall levels over the course of an interaction (Sadler & Woody, 2003), conceptualized in the present study as linear trends. For example, we can look for diverging slopes on control, as found here for Gloria and Ellis. Possibly of even greater importance, we can also examine the complementarity of cyclical variations in interpersonal behav- ior. For example, are one person’s oscillations in control at- tuned to the other person’s oscillations in control? As found in the present study, cycles that are opposite in phase (peaks in one person going together with troughs in the other person) are consistent with the interpersonal principle of oppositeness on control, but the degree of such entrainment varied strikingly across the various psychotherapy interactions. In addition to allowing us to examine the foregoing kinds of interpersonal dynamics, the computer joystick method has some interesting advantages as a way of measuring global interpersonal style. In particular, it provides a careful and thorough sampling of interpersonal behavior from moment to moment across the
- 91. entire course of the interaction. Aggregating across this time sampling avoids several possible shortcomings of techniques that rely on retrospection at the conclusion of the interaction. For example, at the conclusion of an interaction, raters may tend to remember better the acts that were consistent with their overall view of the person, or the acts that stood out to them for any reason (e.g., because they were emotional, unexpected, significant, or the like), or the acts that occurred first or last (Kahneman, 2011; Stone & Shiffman, 1994). Thus, an advantage to using the joystick method to measure global interpersonal style is that ratings are made directly and immediately while the interaction is being viewed, limiting error attributable to recall effects. Comparison With Act-to-Act Relations and Other Statistical Methods As mentioned earlier, a novel aspect of the computer joystick method is that it captures interaction dynamics as reasonably continuous flows. An approach that is more familiar to many researchers involves segmenting each partner’s stream of behavior into a sequence of discrete acts and then studying time-lagged relations of one person’s behaviors to the other person’s. This method has proven to be very generative in previous research on psychotherapy process (e.g., Lichtenberg & Heck, 1986; Tracey, 1985; Wampold, 1986; Wampold & Kim, 1989). The general assumption underlying much of this work is that a relation found with a time lag supports the hypothesis that one person’s behavior was leading or driving the other person’s behavior. In the cross-
- 92. spectral analyses of the time-series data from the joystick method, the average weighted phase is analogous to the time lag in the act-to-act approach. Phase indexes the degree of displacement from one person’s peaks to the other person’s peaks, which could readily be expressed as a time lag. However, it is important to point out that the presence of oscillations in interpersonal behavior (as indicated by the high rhythmicity values in this study) tends to radically transform the possible meaning of a time-lagged relation. To illustrate, consider a case in which two people’s behaviors have exactly the same frequency and are exactly in phase. With a time lag of 0, this would yield a correlation of 1. As we increasingly lag one person behind the other, the correlation drops to 0 and then reverses in sign. When the time lag is long enough that peaks for one person are paired with the lagged troughs for the other person, the corre- lation reaches –1. With further increasing lags, the correlation heads back to 0 and then reaches 1 again. Real data would be more complex, with multiple frequencies superimposed and varying amplitudes (heights of the peaks). Under these conditions, inter- preting the fluctuating values of the various lagged correlations can be very challenging. Moreover, the presence of oscillations in behavior has important conceptual implications. One is that the future value of a fairly consistently oscillating behavior can be anticipated well ahead of
- 97. in at ed br oa dl y. 12 THOMAS, HOPWOOD, WOODY, ETHIER, AND SADLER time. This means that the causes of a later behavior can occur long before the immediately preceding behavior. In addition, oscillations are consistent with circular causality, in which the partners are in a feedback loop and neither can be said to be driving the obtained pattern. In short, with oscillating behaviors such as those evident in these therapy interactions, time-lagged relations need to be interpreted with caution. In this article, we mostly focused on the spectral and cross- spectral analysis of the time-series data obtained with the joystick method. However, joystick data are very well suited to other promising statis- tical approaches, such as dynamic systems analyses (Boker, 2002;
- 98. Boker & Wenger, 2007; Salvatore & Tschacher, 2012). These possi- bilities provide a rich vein for further exploration. Conclusion This study demonstrates the utility of measuring momentary interpersonal processes in psychotherapy and provides a step to- wards more accurate measurement of interpersonal process. The fine-grained level of analysis outlined in this study has the poten- tial to augment current research on meaningful psychological processes as they occur within therapy sessions. Hill, Nutt, and Jackson (1994) noted the relative infrequency with which the same measure of process is used in multiple studies. One explanation for this may be that measures used to study particular constructs or techniques that are more prominent in particular therapy orienta- tions are less likely to be used by researchers with differing interests and orientations. An advantage of the IPC is that it is reasonably trans-theoretical and hence could allow for increased communication regarding therapy processes across various re- search paradigms (Hopwood, 2010). As technological advances allowing for the collection and mea- surement of psychological data continue to advance, research that focuses on dynamic processes will play an increasingly important and sophisticated role in psychotherapy research. Some types of disorders, such as borderline personality disorder, may be charac- terized by distinctive cyclical patterns, and these patterns, as well
- 99. as changes in them due to psychotherapy, could be captured using the methods advanced here (Pincus & Hopwood, 2012). In addi- tion, questions regarding the degree to which interpersonal pro- cesses coalesce and diverge across different therapies are highly amenable to investigation using the methods advanced in this article. Furthermore, using these methods to investigate interper- sonal processes in psychotherapy may be informative for specify- ing the conditions under which particular intervention techniques are most likely to be effective. Finally, the joystick method could also be used in the training and supervision of psychotherapists, as outlined in Pincus et al. (in press). References Anchin, J. C., & Pincus, A. L. (2010). Evidence-based interpersonal psychotherapy with personality disorders: Theory, components, and strategies. In J. J. Magnavita (Ed.), Evidence-based treatment of person- ality dysfunction: Principles, methods, and processes (pp. 113– 166). Washington, DC: American Psychological Association. doi:10.1037/ 12130-005 Andrews, J. D. W. (1989). Psychotherapy of depression: A self- confirmation model. Psychological Review, 96, 576 – 607. doi:10.1037/ 0033-295X.96.4.576
- 100. Beier, E. G., & Valens, E. G. (1975). People-reading: How we control others, how they control us. Oxford, United Kingdom: Stein & Day. Benjamin, L. S. (1979). Use of structural analysis of social behavior (SASB) and Markov chains to study dyadic interactions. Journal of Abnormal Psychology, 88, 303–319. doi:10.1037/0021- 843X.88.3.303 Benjamin, L. S. (1996). Interpersonal diagnosis and treatment of person- ality disorders (2nd ed.). New York, NY: Guilford Press. Boker, S. M. (2002). Consequences of continuity: The hunt for intrinsic properties within parameters of dynamics in psychological processes. Multivariate Behavioral Research, 37, 405– 422. doi:10.1207/ S15327906MBR3703_5 Boker, S. M., & Wenger, M. J. (2007). Data analytic techniques for dynamical systems. Mahwah, NJ: Erlbaum. Carson, R. C. (1969). Interaction concepts of personality. Chicago, IL: Aldine. Carson, R. C. (1982). Self-fulfilling prophecy, maladaptive behavior, and psychotherapy. In J. Anchin & D. Kiesler (Eds.), Handbook of interper-
- 101. sonal psychotherapy (pp. 64 –77). New York, NY: Pergamon. Castonguay, L. G., Goldfried, M. R., Wiser, S. L., Raue, P. J., & Hayes, A. M. (1996). Predicting the effect of cognitive therapy for depression: A study of unique and common factors. Journal of Consulting and Clinical Psychology, 64, 497–504. doi:10.1037/0022- 006X.64.3.497 Dietzel, C. S., & Abeles, N. (1975). Client–therapist complementarity and therapeutic outcome. Journal of Counseling Psychology, 22, 264 –272. doi:10.1037/h0076731 Goldfried, M. R. (in press).What should we expect from psychotherapy? Clinical Psychology Review. Gurtman, M. B. (1996). Interpersonal problems and the psychotherapy context: The construct validity of the Inventory of Interpersonal Prob- lems. Psychological Assessment, 8, 241–255. doi:10.1037/1040- 3590.8 .3.241 Hayes, S. C. (2004). Acceptance and commitment therapy, relational frame theory, and the third wave of behavior and cognitive therapies. Behavior Therapy, 35, 639 – 665. doi:10.1016/S0005-7894(04)80013-3 Henry, W. P., Schacht, T. E., & Strupp, H. H. (1986). Structural
- 102. analysis of social behavior: Application to a study of interpersonal process in differential psychotherapeutic outcome. Journal of Consulting and Clin- ical Psychology, 54, 27–31. doi:10.1037/0022-006X.54.1.27 Henry, W. P., Schacht, T. E., & Strupp, H. H. (1990). Patient and therapist introject, interpersonal process, and differential psychotherapy outcome. Journal of Consulting and Clinical Psychology, 58, 768 –774. doi: 10.1037/0022-006X.58.6.768 Hill, C. E., Nutt, E. A., & Jackson, S. (1994). Trends in psychotherapy process research: Samples, measures, researchers, and classic publica- tions. Journal of Counseling Psychology, 41, 364 –377. doi:10.1037/ 0022-0167.41.3.364 Hopwood, C. J. (2010). An interpersonal perspective on the personality assessment process. Journal of Personality Assessment, 92, 471– 479. doi:10.1080/00223891.2010.513284 Horowitz, L. M., Rosenberg, S. E., & Bartholomew, K. (1993). Interper- sonal problems, attachment styles, and outcome in brief dynamic psy- chotherapy. Journal of Consulting and Clinical Psychology, 61, 549 – 560. doi:10.1037/0022-006X.61.4.549
- 103. Horvath, A. O., Del Re, A. C., Flückiger, C., & Symonds, D. (2011). Alliance in individual psychotherapy. Psychotherapy, 48, 9 –16. doi: 10.1037/a0022186 Kahneman, D. (2011). Thinking, fast and slow. Toronto, Canada: Double- day/Random House. Kiesler, D. J. (1996). Contemporary interpersonal theory and research: Per- sonality, psychopathology, and psychotherapy. New York, NY: Wiley. Kiesler, D. J., & Goldston, C. S. (1988). Client–therapist complementarity: An analysis of the Gloria films. Journal of Counseling Psychology, 35, 127–133. doi:10.1037/0022-0167.35.2.127 T hi s do cu m en t is co
- 107. du al us er an d is no t to be di ss em in at ed br oa dl y. 13MOMENTARY ASSESSMENT OF PROCESS http://dx.doi.org/10.1037/12130-005
- 108. http://dx.doi.org/10.1037/12130-005 http://dx.doi.org/10.1037/0033-295X.96.4.576 http://dx.doi.org/10.1037/0033-295X.96.4.576 http://dx.doi.org/10.1037/0021-843X.88.3.303 http://dx.doi.org/10.1207/S15327906MBR3703_5 http://dx.doi.org/10.1207/S15327906MBR3703_5 http://dx.doi.org/10.1037/0022-006X.64.3.497 http://dx.doi.org/10.1037/h0076731 http://dx.doi.org/10.1037/1040-3590.8.3.241 http://dx.doi.org/10.1037/1040-3590.8.3.241 http://dx.doi.org/10.1016/S0005-7894%2804%2980013-3 http://dx.doi.org/10.1037/0022-006X.54.1.27 http://dx.doi.org/10.1037/0022-006X.58.6.768 http://dx.doi.org/10.1037/0022-006X.58.6.768 http://dx.doi.org/10.1037/0022-0167.41.3.364 http://dx.doi.org/10.1037/0022-0167.41.3.364 http://dx.doi.org/10.1080/00223891.2010.513284 http://dx.doi.org/10.1037/0022-006X.61.4.549 http://dx.doi.org/10.1037/a0022186 http://dx.doi.org/10.1037/a0022186 http://dx.doi.org/10.1037/0022-0167.35.2.127 Kiesler, D. J., & Goldston, C. S., & Schmidt, J. A. (1991). Manual for the Check List of Interpersonal Transactions–Revised (CLOIT–R) and the Check List of Psychotherapy Transactions–Revised (CLOPT– R). Rich- mond, VA: Virginia Commonwealth University Leary, T. (1957). Interpersonal diagnosis of personality. New York, NY: Ronald Press. Lichtenberg, J. W., & Heck, E. (1986). The analysis of pattern
- 109. and sequence in process research. Journal of Counseling Psychology, 33, 170 –181. doi:10.1037/0022-0167.33.2.170 Lizdek, I., Sadler, P., Woody, E., Ethier, N., & Malet, G. (2012). Capturing the stream of behavior: A computer-joystick method for coding inter- personal behavior continuously over time. Social Science Computer Review, 30, 513–521. doi:10.1177/0894439312436487 Luyten, P., & Blatt, S. J. (2013). Interpersonal relatedness and self-definition in normal and disrupted personality development: Retrospect and prospect. American Psychologist, 68, 172–183. doi:10.1037/a0032243 Markey, P. M., Lowmaster, S., & Eichler, W. (2010). A real- time assess- ment of interpersonal complementarity. Personal Relationships, 17, 13–25. doi:10.1111/j.1475-6811.2010.01249.x McCrae, R. R., & Costa, P. T. (1989). The structure of interpersonal traits: Wiggins’s circumplex and the five-factor model. Journal of Personality and Social Psychology, 56, 586 –595. doi:10.1037/0022- 3514.56.4.586 Moskowitz, D. S., & Zuroff, D. C. (2004). Flux, pulse, and spin: Dynamic additions to the personality lexicon. Journal of Personality and Social
- 110. Psychology, 86, 880 – 893. doi:10.1037/0022-3514.86.6.880 Muran, J. C., & Barber, J. P. (Eds.). (2010). The therapeutic alliance: An evidence-based guide to practice. New York, NY: Guilford Press. Orford, J. (1986). The rules of interpersonal complementarity: Does hos- tility beget hostility and dominance, submission? Psychological Review, 93, 365–377. doi:10.1037/0033-295X.93.3.365 Pincus, A. L., & Hopwood, C. J. (2012). A contemporary interpersonal model of personality pathology and personality disorder. In T. A. Wi- diger (Ed.), Oxford handbook of personality disorders (pp. 372– 398). Oxford, United Kingdom: Oxford University Press. doi:10.1093/ oxfordhb/9780199735013.013.0018 Pincus, A. L., Lukowitsky, M. R., & Wright, A. G. C. (2010). The interpersonal nexus of personality and psychopathology. In T. Millon R. Krueger & E. Simonsen (Eds.), Contemporary directions in psychopa- thology: Toward DSM–V and ICD-11 (pp. 523–552). New York, NY: Guilford Press. Pincus, A. L., Sadler, P., Woody, E., Roche, M. J., Thomas, K. M., & Wright, A. G. C. (in press). Assessing interpersonal dynamics. In C. J.
- 111. Hopwood & R. F. Borstein (Eds.), Multimethod clinical assessment. New York, NY: Guilford Press. Puschner, B., Kraft, S., & Bauer, S. (2004). Interpersonal problems and outcome in outpatient psychotherapy: Findings from a long-term longi- tudinal study in Germany. Journal of Personality Assessment, 83, 223– 234. doi:10.1207/s15327752jpa8303_06 R Development Core Team. (2011). R: A Language and Environment for Statistical Computing [Computer software]. Retrieved from http://www .R-project.org/ Reilly, J., & Jacobus, V. (2008). Students evaluate Carl Rogers and his relationship with Gloria: A brief report. Journal of Humanistic Psychol- ogy, 48, 32– 41. doi:10.1177/0022167807311944 Sadler, P., Ethier, N., Gunn, G. R., Duong, D., & Woody, E. (2009). Are we on the same wavelength? Interpersonal complementarity as shared cyclical patterns during interactions. Journal of Personality and Social Psychology, 97, 1005–1020. doi:10.1037/a0016232 Sadler, P., Ethier, N., & Woody, E. (2011). Interpersonal complementarity. In L. M. Horowitz & S. N. Strack (Eds.), Handbook of interpersonal
- 112. psychology: Theory, research, assessment, and therapeutic interventions (pp. 123–142). New York, NY: Wiley. Sadler, P., & Woody, E. (2003). Is who you are who you’re talking to? Interpersonal style and complementarity in mixed-sex interactions. Jour- nal of Personality and Social Psychology, 84, 80 –96. doi:10.1037/0022- 3514.84.1.80 Safran, J. D. (1984). Assessing the cognitive interpersonal cycle. Cognitive Therapy and Research, 8, 333–347. doi:10.1007/BF01173309 Safran, J. D. (1990a). Towards a refinement of cognitive therapy in light of interpersonal theory: 1. Theory. Clinical Psychology Review, 10, 87– 105. doi:10.1016/0272-7358(90)90108-M Safran, J. D. (1990b). Towards a refinement of cognitive therapy in light of interpersonal theory: 2. Practice. Clinical Psychology Review, 10, 107– 121. doi:10.1016/0272-7358(90)90109-N Salvatore, S., & Tschacher, W. (2012). Time dependency of psychotherapeutic exchanges: The contribution of the theory of dynamic systems in analyzing process. Frontiers in Psychology, 3. doi:10.3389/fpsyg.2012.00253 Shostrom, E. L. (Producer & Director). (1966). Three
- 113. approaches to psychother- apy [Film]. Santa Ana, CA: Psychological and Educational Films. Shostrom, E. L. (Producer & Director). (1976). Three approaches to psychother- apy [Film]. Santa Ana, CA: Psychological and Educational Films. Stone, A. A., & Shiffman, S. (1994). Ecological momentary assessment (EMA) in behavioral medicine. Annals of Behavioral Medicine, 16, 199 –202. Strupp, H. H., & Binder, J. L. (1984). Psychotherapy in a new key: A guide to time-limited dynamic psychotherapy. New York, NY: Basic Books. Tracey, T. J. (1985). Dominance and outcome: A sequential examination. Journal of Counseling Psychology, 32, 119 –122. doi:10.1037/0022- 0167.32.1.119 Tracey, T. J. G. (1993). An interpersonal model of the therapeutic process. Journal of Counseling Psychology, 40, 396 – 409. doi:10.1037/0022- 0167.40.4.396 Tracey, T. J. G. (2004). Levels of interpersonal complementarity: A sim- plex representation. Personality and Social Psychology Bulletin, 30, 1211–1225. doi:10.1177/0146167204264075
- 114. Tracey, T. J. G., Bludworth, J., & Glidden-Tracey, C. E. (2012). Are there parallel processes in psychotherapy supervision? An empirical exami- nation. Psychotherapy, 49, 330 –343. doi:10.1037/a0026246 Tracey, T. J. G., Sherry, P., & Albright, J. M. (1999). The interpersonal process of cognitive– behavioral therapy: An examination of comple- mentarity over the course of treatment. Journal of Counseling Psychol- ogy, 46, 80 –91. doi:10.1037/0022-0167.46.1.80 Wampold, B. E. (1984). Tests of dominance in sequential categorical data. Psychological Bulletin, 96, 424 – 429. doi:10.1037/0033- 2909.96.2.424 Wampold, B. E. (1986). State of the art in sequential analysis: Comment on Lichtenberg and Heck. Journal of Counseling Psychology, 33, 182–185. Wampold, B. E., & Kim, K.-H. (1989). Sequential analysis applied to counseling process and outcome: A case study revisited. Journal of Counseling Psychology, 36, 357–364. doi:10.1037/0022- 0167.36.3.357 Warner, R. M. (1998). Spectral analysis of time-series data. New York, NY: Guilford Press.
- 115. Weinrach, S. G. (1990). Rogers and Gloria: The controversial film and the enduring relationship. Psychotherapy: Theory, Research, Practice, Training, 27, 282–290. doi:10.1037/0033-3204.27.2.282 Wiggins, J. S. (1991). Agency and communion as conceptual coordinates for the understanding and measurement of interpersonal behavior. In W. Grove & D. Cicchetti (Eds.), Thinking clearly about psychology: Essays in honor of Paul E. Meehl (Vol. 2, pp. 89 –113). Minneapolis: University of Minnesota Press. Wiggins, J. S. (1996). An informal history of the interpersonal circumplex tradition. Journal of Personality Assessment, 66, 217–233. doi:10.1207/ s15327752jpa6602_2 Received August 15, 2012 Revision received April 16, 2013 Accepted April 18, 2013 � T hi s do cu m
- 120. y. 14 THOMAS, HOPWOOD, WOODY, ETHIER, AND SADLER http://dx.doi.org/10.1037/0022-0167.33.2.170 http://dx.doi.org/10.1177/0894439312436487 http://dx.doi.org/10.1037/a0032243 http://dx.doi.org/10.1111/j.1475-6811.2010.01249.x http://dx.doi.org/10.1037/0022-3514.56.4.586 http://dx.doi.org/10.1037/0022-3514.86.6.880 http://dx.doi.org/10.1037/0033-295X.93.3.365 http://dx.doi.org/10.1093/oxfordhb/9780199735013.013.0018 http://dx.doi.org/10.1093/oxfordhb/9780199735013.013.0018 http://dx.doi.org/10.1207/s15327752jpa8303_06 http://www.R-project.org/ http://www.R-project.org/ http://dx.doi.org/10.1177/0022167807311944 http://dx.doi.org/10.1037/a0016232 http://dx.doi.org/10.1037/0022-3514.84.1.80 http://dx.doi.org/10.1037/0022-3514.84.1.80 http://dx.doi.org/10.1007/BF01173309 http://dx.doi.org/10.1016/0272-7358%2890%2990108-M http://dx.doi.org/10.1016/0272-7358%2890%2990109-N http://dx.doi.org/10.3389/fpsyg.2012.00253 http://dx.doi.org/10.1037/0022-0167.32.1.119 http://dx.doi.org/10.1037/0022-0167.32.1.119 http://dx.doi.org/10.1037/0022-0167.40.4.396 http://dx.doi.org/10.1037/0022-0167.40.4.396 http://dx.doi.org/10.1177/0146167204264075 http://dx.doi.org/10.1037/a0026246 http://dx.doi.org/10.1037/0022-0167.46.1.80 http://dx.doi.org/10.1037/0033-2909.96.2.424 http://dx.doi.org/10.1037/0022-0167.36.3.357 http://dx.doi.org/10.1037/0033-3204.27.2.282 http://dx.doi.org/10.1207/s15327752jpa6602_2 http://dx.doi.org/10.1207/s15327752jpa6602_2Momentary
- 121. Assessment of Interpersonal Process in PsychotherapyAssessing Dynamic Aspects of the Therapeutic RelationshipA Theoretical Framework for Assessing Moment-to-Moment Interpersonal BehaviorA Computer Joystick Method for Coding Momentary Interpersonal BehaviorThe Present StudyMethodProcedureFinal Joystick DataCalculation of IndicesIndices of within-person variabilityDensity plotsLinear trends in levelsIndices of oscillation and entrainmentResultsGlobal Levels of Control and AffiliationWithin-Person VariabilityTemporal Dynamics That Interrelate the Partners’ Behaviors in the InteractionExamining Windows of an InteractionGloria and EllisGloria and PerlsGloria and RogersDiscussionComparison With Act-to-Act Relations and Other Statistical MethodsConclusionReferences