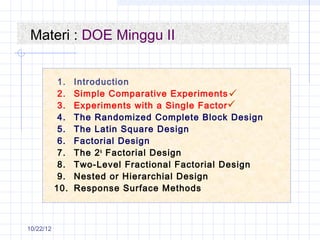
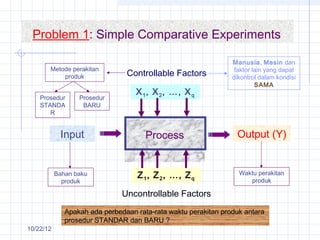
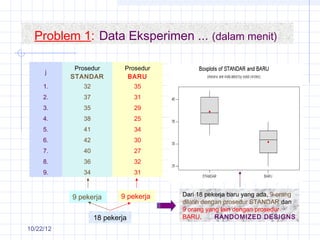
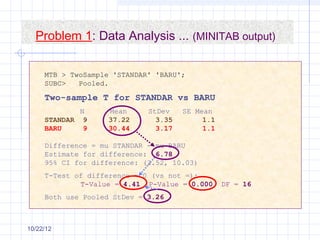
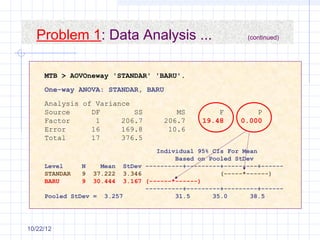
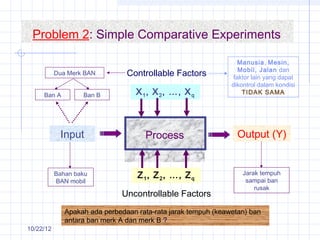
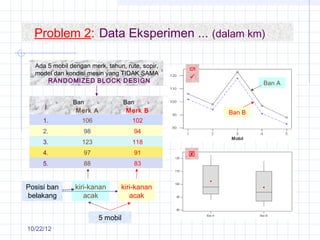
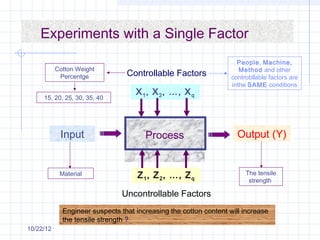
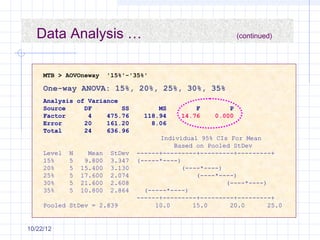
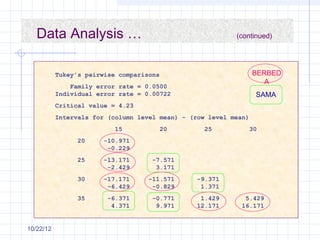
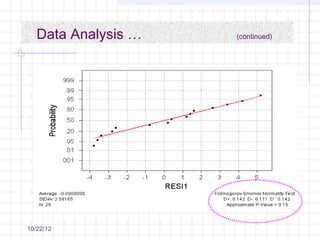
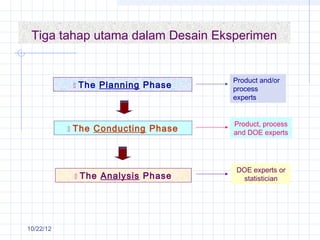
Materi : DOE Minggu II


            1.   Introduction
            2.   Simple Comparative Experiments 
            3.   Experiments with a Single Factor
            4.   The Randomized Complete Block Design
            5.   The Latin Square Design
            6.   Factorial Design
            7.   The 2 k Factorial Design
            8.   Two-Level Fractional Factorial Design
            9.   Nested or Hierarchial Design
           10.   Response Surface Methods


10/22/12
Reference :

     .     Montgomery, D.C. (2003)
                                  Design and Analysis of
            Experiments
            Fifth Edition, John Wiley & Sons.

           Chapter 2. Simple Comparative Experiments
               Inferences About the Defferences in Means :
                     Randomized Designs
                     Paired Comparison Designs
               Inferences About the Variances of Normal Distributions

           Chapter 3. Experiments with a Single Factor: The Analysis
            of         Variance
               Completely Randomized Designs


10/22/12
Problem 1: Simple Comparative Experiments

                                                                Manusia, Mesin dan
       Metode perakitan                                          faktor lain yang dapat
           produk               Controllable Factors            dikontrol dalam kondisi
                                                                         SAMA
                                   X 1 , X 2 , …, X q
    Prosedur      Prosedur
    STANDA         BARU
       R


            Input                     Process                    Output (Y)


           Bahan baku              Z 1 , Z 2 , …, Z q             Waktu perakitan
             produk                                                  produk

                               Uncontrollable Factors
              Apakah ada perbedaan rata-rata waktu perakitan produk antara
              prosedur STANDAR dan BARU ?
10/22/12
Problem 1: Data Eksperimen ... (dalam menit)

            Prosedur        Prosedur
     j
           STANDAR           BARU
     1.       32                35
     2.       37                31
     3.       35                29
     4.       38                25
     5.       41                34
     6.       42                30
     7.       40                27
     8.       36                32
     9.       34                31


           9 pekerja       9 pekerja   Dari 18 pekerja baru yang ada, 9 orang
                                       dilatih dengan prosedur STANDAR dan
                                       9 orang yang lain dengan prosedur
                   18 pekerja          BARU.       RANDOMIZED DESIGNS
10/22/12
Problem 1: Data Analysis ... (MINITAB output)


                                         Data BARU
                                         Berdistribusi
                                          NORMAL


                                             Data
                                           STANDAR
                                          Berdistribusi
                                           NORMAL


10/22/12
Problem 1: Data Analysis ... (MINITAB output)

     MTB > TwoSample 'STANDAR' 'BARU';
     SUBC>   Pooled.

     Two-sample T for STANDAR vs BARU
             N     Mean      StDev    SE Mean
     STANDAR 9     37.22       3.35        1.1
     BARU     9    30.44       3.17        1.1

     Difference = mu STANDAR - mu BARU
     Estimate for difference: 6.78
     95% CI for difference: (3.52, 10.03)
     T-Test of difference = 0 (vs not =):
             T-Value = 4.41 P-Value = 0.000      DF = 16
     Both use Pooled StDev = 3.26


10/22/12
Problem 1: Data Analysis ...                           (continued)


     MTB > AOVOneway 'STANDAR' 'BARU'.
     One-way ANOVA: STANDAR, BARU
     Analysis of Variance
     Source     DF        SS           MS         F         P
     Factor      1     206.7        206.7     19.48     0.000
     Error      16     169.8         10.6
     Total      17     376.5
                                  Individual 95% CIs For Mean
                                       Based on Pooled StDev
     Level     N    Mean StDev ----------+---------+---------+------
     STANDAR   9 37.222 3.346                      (-----*------)
     BARU      9 30.444 3.167 (------*------)
                               ----------+---------+---------+------
     Pooled StDev = 3.257              31.5      35.0      38.5


10/22/12
Problem 2: Simple Comparative Experiments

                                                                  Manusia, Mesin,
                                                                  Mobil, Jalan dan
           Dua Merk BAN         Controllable Factors            faktor lain yang dapat
                                                               dikontrol dalam kondisi
     Ban A         Ban B           X 1 , X 2 , …, X q              TIDAK SAMA


            Input                    Process                     Output (Y)


           Bahan baku              Z 1 , Z 2 , …, Z q              Jarak tempuh
           BAN mobil                                                sampai ban
                                                                       rusak
                              Uncontrollable Factors
              Apakah ada perbedaan rata-rata jarak tempuh (keawetan) ban
              antara ban merk A dan merk B ?
10/22/12
Problem 2: Data Eksperimen ... (dalam km)

  Ada 5 mobil dengan merk, tahun, rute, sopir,
  model dan kondisi mesin yang TIDAK SAMA        
      RANDOMIZED BLOCK DESIGN
                                                 
                                                             Ban A


               Ban                 Ban
     j
                Merk A              Merk B           Ban B
     1.           106                102
     2.            98                 94
     3.           123                118
     4.            97                 91         
     5.            88                 83


Posisi ban      kiri-kanan      kiri-kanan
belakang           acak            acak


                         5 mobil
10/22/12
Problem 2: Data Analysis ...                                     (continued)


 MTB > Paired     'Ban A' 'Ban B'.
                                           MTB > TwoSample 'Ban A' 'Ban B';      
                                            SUBC>   Pooled.
 Paired T-Test and CI: Ban A, Ban B         Two-Sample T-Test and CI: Ban A, Ban B

 Paired T for Ban A - Ban B                 Two-sample T for Ban A vs Ban B
                                                       N   Mean StDev SE Mean
           N     Mean    StDev SE Mean          Ban A 5 102.4     13.2      5.9
 Ban A     5   102.40    13.16    5.89          Ban B 5    97.6   13.3      5.9
 Ban B     5    97.60    13.28    5.94
 Difference      4.80     0.837   0.374     Difference = mu Ban A - mu Ban B
                                            Estimate for difference: 4.80
 95% CI for mean difference:                95% CI for difference: (-14.48, 24.08)
      (3.761, 5.839)                        T-Test of difference = 0 (vs not =):
                                                T-Value = 0.57 P-Value = 0.582
 T-Test of mean diff. = 0 (vs not = 0):         DF = 8
                                            Both use Pooled StDev = 13.2
       T-Value = 12.83   P-Value = 0.000


                              difference conclusion !!!
10/22/12
Experiments with a Single Factor
                                                                     People, Machine,
           Cotton Weight                                              Method and other
            Percentge            Controllable Factors              controbllable factors are
                                                                   inthe SAME conditions
                                    X 1 , X 2 , …, X q
     15, 20, 25, 30, 35, 40


            Input                      Process                       Output (Y)


            Material                 Z 1 , Z 2 , …, Z q                 The tensile
                                                                         strength

                                Uncontrollable Factors
             Engineer suspects that increasing the cotton content will increase
             the tensile strength ?
10/22/12
Experimental Run Number

           Cotton Weigth
Factor                              Experimental Run Number
            Percentage
                                                                       25
                15           1        2         3        4        5

  1
                20           6        7         8        9        10


                25          11        12       13       14        15
   2
                30          16        17       18       19        20


                35          21        22       23       24        25
                                                                         Use
                                                                       computer
Level                                                                  software
Factor                     Select a random number between 1 and 25.

                            A completely randomized design
10/22/12
The Test Sequence obtained …

    Test      Run     Cotton Weight     Test      Run     Cotton Weight
  sequence   Number    Percentage     sequence   Number    Percentage
      1        8           20           14         7           20
      2        18          30           15         1           15
      3        10          20           16         24          35
      4        23          35           17         21          35
      5        17          30           18         11          25
      6        5           15           19         2           15
      7        14          25           20         13          25
      8        6           20           21         22          35
      9        15          25           22         16          30
     10        20          30           23         25          35
     11        9           20           24         19          30
     12        4           15           25         3           15
     13        12          25

10/22/12
Data from the Tensile Strength Experiment …

  Cotton                      Observations
  Weight                                                      Total   Average
                  1      2         3         4      5
  Percent


     15           7      7        15         11     9          49       9.8
     20           12     17       12         18    18          77      15.4
     25           14     18       18         19    19          88      17.6
     30           19     25       22         19    23         108      21.6
     35           7      10       11         15    11          54      10.8
   Total           -     -         -         -      -         376     15.04


            First data                            25th data


10/22/12
Data Analysis …
           Tensile strength (lb/in 2 )


                                         Cotton weight percentage
10/22/12
Data Analysis …                                               (continued)


     MTB > AOVOneway      '15%'-'35%'

     One-way ANOVA: 15%, 20%, 25%, 30%, 35%
     Analysis of Variance
     Source     DF        SS             MS        F         P
     Factor      4    475.76         118.94    14.76     0.000
     Error      20    161.20           8.06
     Total      24    636.96
                                         Individual 95% CIs For Mean
                                             Based on Pooled StDev
     Level   N     Mean    StDev   ------+---------+---------+---------+
     15%     5    9.800    3.347   (-----*----)
     20%     5   15.400    3.130                (----*----)
     25%     5   17.600    2.074                    (----*----)
     30%     5   21.600    2.608                            (----*----)
     35%     5   10.800    2.864     (-----*----)
                                   ------+---------+---------+---------+
     Pooled StDev = 2.839               10.0       15.0      20.0       25.0


10/22/12
Data Analysis …                                         (continued)


           Tukey's pairwise comparisons                           BERBED
                                                                     A
               Family error rate = 0.0500
           Individual error rate = 0.00722                        SAMA
           Critical value = 4.23
           Intervals for (column level mean) - (row level mean)
                           15          20         25          30
                 20     -10.971
                         -0.229
                 25     -13.171      -7.571
                         -2.429       3.171
                 30     -17.171     -11.571      -9.371
                         -6.429      -0.829       1.371
                 35      -6.371      -0.771       1.429      5.429
                          4.371       9.971      12.171     16.171


10/22/12
Data Analysis …   (continued)


10/22/12
Tiga tahap utama dalam Desain Eksperimen


                                        Product and/or
                  The Planning Phase   process
                                        experts


                                        Product, process
              The Conducting Phase     and DOE experts


                                         DOE experts or
                  The Analysis Phase     statistician


10/22/12

Modul 2. simple comparative experiments

  • 1.
    Materi : DOEMinggu II 1. Introduction 2. Simple Comparative Experiments  3. Experiments with a Single Factor 4. The Randomized Complete Block Design 5. The Latin Square Design 6. Factorial Design 7. The 2 k Factorial Design 8. Two-Level Fractional Factorial Design 9. Nested or Hierarchial Design 10. Response Surface Methods 10/22/12
  • 2.
    Reference : . Montgomery, D.C. (2003) Design and Analysis of Experiments Fifth Edition, John Wiley & Sons.  Chapter 2. Simple Comparative Experiments  Inferences About the Defferences in Means :  Randomized Designs  Paired Comparison Designs  Inferences About the Variances of Normal Distributions  Chapter 3. Experiments with a Single Factor: The Analysis of Variance  Completely Randomized Designs 10/22/12
  • 3.
    Problem 1: SimpleComparative Experiments Manusia, Mesin dan Metode perakitan faktor lain yang dapat produk Controllable Factors dikontrol dalam kondisi SAMA X 1 , X 2 , …, X q Prosedur Prosedur STANDA BARU R Input Process Output (Y) Bahan baku Z 1 , Z 2 , …, Z q Waktu perakitan produk produk Uncontrollable Factors Apakah ada perbedaan rata-rata waktu perakitan produk antara prosedur STANDAR dan BARU ? 10/22/12
  • 4.
    Problem 1: DataEksperimen ... (dalam menit) Prosedur Prosedur j STANDAR BARU 1. 32 35 2. 37 31 3. 35 29 4. 38 25 5. 41 34 6. 42 30 7. 40 27 8. 36 32 9. 34 31 9 pekerja 9 pekerja Dari 18 pekerja baru yang ada, 9 orang dilatih dengan prosedur STANDAR dan 9 orang yang lain dengan prosedur 18 pekerja BARU. RANDOMIZED DESIGNS 10/22/12
  • 5.
    Problem 1: DataAnalysis ... (MINITAB output) Data BARU Berdistribusi NORMAL Data STANDAR Berdistribusi NORMAL 10/22/12
  • 6.
    Problem 1: DataAnalysis ... (MINITAB output) MTB > TwoSample 'STANDAR' 'BARU'; SUBC> Pooled. Two-sample T for STANDAR vs BARU N Mean StDev SE Mean STANDAR 9 37.22 3.35 1.1 BARU 9 30.44 3.17 1.1 Difference = mu STANDAR - mu BARU Estimate for difference: 6.78 95% CI for difference: (3.52, 10.03) T-Test of difference = 0 (vs not =): T-Value = 4.41 P-Value = 0.000 DF = 16 Both use Pooled StDev = 3.26 10/22/12
  • 7.
    Problem 1: DataAnalysis ... (continued) MTB > AOVOneway 'STANDAR' 'BARU'. One-way ANOVA: STANDAR, BARU Analysis of Variance Source DF SS MS F P Factor 1 206.7 206.7 19.48 0.000 Error 16 169.8 10.6 Total 17 376.5 Individual 95% CIs For Mean Based on Pooled StDev Level N Mean StDev ----------+---------+---------+------ STANDAR 9 37.222 3.346 (-----*------) BARU 9 30.444 3.167 (------*------) ----------+---------+---------+------ Pooled StDev = 3.257 31.5 35.0 38.5 10/22/12
  • 8.
    Problem 2: SimpleComparative Experiments Manusia, Mesin, Mobil, Jalan dan Dua Merk BAN Controllable Factors faktor lain yang dapat dikontrol dalam kondisi Ban A Ban B X 1 , X 2 , …, X q TIDAK SAMA Input Process Output (Y) Bahan baku Z 1 , Z 2 , …, Z q Jarak tempuh BAN mobil sampai ban rusak Uncontrollable Factors Apakah ada perbedaan rata-rata jarak tempuh (keawetan) ban antara ban merk A dan merk B ? 10/22/12
  • 9.
    Problem 2: DataEksperimen ... (dalam km) Ada 5 mobil dengan merk, tahun, rute, sopir, model dan kondisi mesin yang TIDAK SAMA  RANDOMIZED BLOCK DESIGN  Ban A Ban Ban j Merk A Merk B Ban B 1. 106 102 2. 98 94 3. 123 118 4. 97 91  5. 88 83 Posisi ban kiri-kanan kiri-kanan belakang acak acak 5 mobil 10/22/12
  • 10.
    Problem 2: DataAnalysis ... (continued) MTB > Paired 'Ban A' 'Ban B'.  MTB > TwoSample 'Ban A' 'Ban B';  SUBC> Pooled. Paired T-Test and CI: Ban A, Ban B Two-Sample T-Test and CI: Ban A, Ban B Paired T for Ban A - Ban B Two-sample T for Ban A vs Ban B N Mean StDev SE Mean N Mean StDev SE Mean Ban A 5 102.4 13.2 5.9 Ban A 5 102.40 13.16 5.89 Ban B 5 97.6 13.3 5.9 Ban B 5 97.60 13.28 5.94 Difference 4.80 0.837 0.374 Difference = mu Ban A - mu Ban B Estimate for difference: 4.80 95% CI for mean difference: 95% CI for difference: (-14.48, 24.08) (3.761, 5.839) T-Test of difference = 0 (vs not =): T-Value = 0.57 P-Value = 0.582 T-Test of mean diff. = 0 (vs not = 0): DF = 8 Both use Pooled StDev = 13.2 T-Value = 12.83 P-Value = 0.000 difference conclusion !!! 10/22/12
  • 11.
    Experiments with aSingle Factor People, Machine, Cotton Weight Method and other Percentge Controllable Factors controbllable factors are inthe SAME conditions X 1 , X 2 , …, X q 15, 20, 25, 30, 35, 40 Input Process Output (Y) Material Z 1 , Z 2 , …, Z q The tensile strength Uncontrollable Factors Engineer suspects that increasing the cotton content will increase the tensile strength ? 10/22/12
  • 12.
    Experimental Run Number Cotton Weigth Factor Experimental Run Number Percentage 25 15 1 2 3 4 5 1 20 6 7 8 9 10 25 11 12 13 14 15 2 30 16 17 18 19 20 35 21 22 23 24 25 Use computer Level software Factor Select a random number between 1 and 25. A completely randomized design 10/22/12
  • 13.
    The Test Sequenceobtained … Test Run Cotton Weight Test Run Cotton Weight sequence Number Percentage sequence Number Percentage 1 8 20 14 7 20 2 18 30 15 1 15 3 10 20 16 24 35 4 23 35 17 21 35 5 17 30 18 11 25 6 5 15 19 2 15 7 14 25 20 13 25 8 6 20 21 22 35 9 15 25 22 16 30 10 20 30 23 25 35 11 9 20 24 19 30 12 4 15 25 3 15 13 12 25 10/22/12
  • 14.
    Data from theTensile Strength Experiment … Cotton Observations Weight Total Average 1 2 3 4 5 Percent 15 7 7 15 11 9 49 9.8 20 12 17 12 18 18 77 15.4 25 14 18 18 19 19 88 17.6 30 19 25 22 19 23 108 21.6 35 7 10 11 15 11 54 10.8 Total - - - - - 376 15.04 First data 25th data 10/22/12
  • 15.
    Data Analysis … Tensile strength (lb/in 2 ) Cotton weight percentage 10/22/12
  • 16.
    Data Analysis … (continued) MTB > AOVOneway '15%'-'35%' One-way ANOVA: 15%, 20%, 25%, 30%, 35% Analysis of Variance Source DF SS MS F P Factor 4 475.76 118.94 14.76 0.000 Error 20 161.20 8.06 Total 24 636.96 Individual 95% CIs For Mean Based on Pooled StDev Level N Mean StDev ------+---------+---------+---------+ 15% 5 9.800 3.347 (-----*----) 20% 5 15.400 3.130 (----*----) 25% 5 17.600 2.074 (----*----) 30% 5 21.600 2.608 (----*----) 35% 5 10.800 2.864 (-----*----) ------+---------+---------+---------+ Pooled StDev = 2.839 10.0 15.0 20.0 25.0 10/22/12
  • 17.
    Data Analysis … (continued) Tukey's pairwise comparisons BERBED A Family error rate = 0.0500 Individual error rate = 0.00722 SAMA Critical value = 4.23 Intervals for (column level mean) - (row level mean) 15 20 25 30 20 -10.971 -0.229 25 -13.171 -7.571 -2.429 3.171 30 -17.171 -11.571 -9.371 -6.429 -0.829 1.371 35 -6.371 -0.771 1.429 5.429 4.371 9.971 12.171 16.171 10/22/12
  • 18.
    Data Analysis … (continued) 10/22/12
  • 19.
    Tiga tahap utamadalam Desain Eksperimen Product and/or  The Planning Phase process experts Product, process  The Conducting Phase and DOE experts DOE experts or  The Analysis Phase statistician 10/22/12