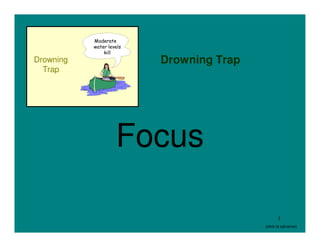
Moderate water levels, not floods, are responsible for most drowning deaths on rivers like the Potomac. At moderate levels just above summer low flows, the deceptively fast current can trap unsuspecting swimmers and tubers. Most fatalities occur between gauge levels of 3.4 to 5.2 feet, known as the "drowning trap," when the river appears placid but contains hidden dangers.
This presentation was given as part of the Cross-Domain Deterrence Seminar hosted by the Center for Global Security Research at Lawrence Livermore National Laboratory in November 2014.
This presentation was given as part of the Cross-Domain Deterrence Seminar hosted by the Center for Global Security Research at Lawrence Livermore National Laboratory in November 2014.
This presentation was given as part of the Cross-Domain Deterrence Seminar hosted by the Center for Global Security Research at Lawrence Livermore National Laboratory in November 2014.
This presentation was given as part of the Cross-Domain Deterrence Seminar hosted by the Center for Global Security Research at Lawrence Livermore National Laboratory in November 2014.
Breath Holding - Physiology, Hazards & Community Education by Neal W. Pollock...
Moderate River Flows May Cause Drownings
1. Moderate
water levels
kill
Drowning Drowning Trap
Trap
Focus
1
(click to advance)
2. Before we start, please answer
these questions:
1. Most fatalities on a river (e.g. Potomac) occur at?
___ Flood levels
✘
___ Moderate levels
___ Low flow (summer pool levels)
(click for question #2)
2. Most people perceive that a river is most dangerous
when which of the following conditions occur?
(Check all of those which apply)
✘
___ Water over the banks and into the trees
✘
___ High water
✘
___ Muddy water
✘
___ Big waves
✘
___ Dead cows floating down the river
___ The river looks normal 2
(click for answers) (click to advance)
3. Surprisingly, on the
Potomac River people
Drowning drown at levels well below
flood levels; they drown at
Trap: levels just slightly above
summer low flows.
Robert B. Kauffman, Ph.D.
7 Hilltop Drive
Frostburg, MD 21532
h: (301) 689-8957
o: (301) 687-4474
e: rkauffman@frostburg.edu
The information contained in this presentation is found in the
following technical report: A Recreational Gauging and
Information System to Alert Potomac River Users of
Dangerous Water Levels. DNR Boating Administration,
Planning and Policy Program. Parts of this presentation may
be reproduced with appropriate reference and citation.
3
(click to advance)
4. Drowning Trap A trap captures
unsuspecting victims...
Model - The drowning trap captures
unsuspecting river users,
users who do not perceive
Depth of the River the dangers of rivers.
+
Velocity
+
Deceptiveness
=
Drowning Trap
4
(click to advance)
5. Topics - The items on the left
provide a general
discussion of the topics in
• Background this section.
• The Problem - Why
Rivers Are Dangerous?
• River Dynamics
• Fatalities
• Drowning Trap
• Deceptiveness
– River dynamics
– User groups
– Safety issues
• Melanie Carlson case
• Summary and Findings.
5
(click to advance)
6. Background: My involvement in expert
witness cases since the study
reinforced the conclusions of
• In 1989, thirteen people
this study…. The Melanie
drowned on the Potomac River.
Carlson incident later in this
• State of Maryland presentation illustrates these
commissioned a study to find conclusions.
out why and what they could do
to prevent it in the future.
• Mainstem of Potomac River from
Washington to Cumberland
• Study completed in 1992
• Studied hydrology
• Studied fatalities and replicated
McCurdy study
• Studied user attitudes and
behavior
• Conclusion: Moderate water
level (not flood) drowns people….
Drowning Trap 6
(click to advance)
7. When Are Rivers Of course floods are
dangerous… most people
Dangerous?: recognize the dangers for
what they are… however,
most fatalities occur when
• Ask people when rivers are the river looks quite benign
dangerous and they will usually and harmless.
respond with…
– high water
– muddy water
– big waves
– water over the banks and
into the trees
– dead cows floating down
the river,
• The obvious answer is that
rivers are dangerous when
they are flooding.
7
(click to advance)
8. Fatalities:
• The study found that most
fatalities occurred not at flood
levels and not at summer low
flows but at moderate water
levels during the summer Above
(Spring flows in Summer)
• Less than one out of ten 5.2’ 14 20%
fatalities (9%) occur below
Drowning Trap level (click to advance)
Drowning Trap Levels:
• Few fatalities (20%) occurred
above Drowning Trap levels
Between
(and flood - 16’) (click to advance) 3.4’- 5.2’ 50 71%
• Seven out of ten fatalities
(71%) occurs at moderate
flows, Below
• Conclusion: Most people drown
at moderate levels, well below 3.4’ 6 9%
flood levels.
8
(click to advance)
9. Temperature, Flows & Fatalities:
• Juxtaposing temperature, fatalities and water levels shows
relationship
• As expected, air AIR TEMPERATURE
temperature - and PERCENT
increases with the Average Monthly
coming of Summer Temperature
• Water levels are
high in Spring, then
Percent of time
drop in Summer flow is between
• River fatalities 3.4’ and5.2’ on
Little Falls gauge
parallel air
temperature, then
drop, paralleling
falling water levels, Potomac River
Drownings
• Conclusion: Spring
flows in Summer kills
MONTH
people.
9
(click to advance)
10. River The question is how does a
change in river depth
Dynamics - affect the power
(velocity) of the river and
how does it affect river
• Laminar Flows fatalities?
• Shore to Center Flow
• Summer Flows
• Drowning Trap Flows
• Flood Levels
• Premises and Assumptions
• Depth versus Velocity
• River Profiles.
10
(click to advance)
11. Laminar Flows:
• Imagine several sheets of
plywood with wooden dowels
between the sheets
SURFACE
• Push the stack
• Their speeds are additive...
• With the sheet on the
bottom traveling the
slowest…
• And each sheet above the
bottom sheet traveling
faster than the one below
it... (continued next slide).
RIVER BOTTOM
11
(click to advance)
12. Laminar Flows:
The air slows slightly the sheet
just below the surface Fastest water is just
below the surface
This creates a depression or void
(shore to center flows - next slide)
SURFACE
The stack is pushed
The bottom sheet
moves the slowest,
slowed by the bottom
The next sheet moves
its speed plus the
speed of the sheet
below it, (click for surface)
Conclusion: As depth
increases, river
RIVER BOTTOM
velocity increases
(see general river velocity).
12
(click to advance)
13. Shore to Center Flows:
Laminar flow in center of an
Most likely to occur in drainage
unobstructed channel
ditches and irrigation channels
Slower surface flow creates a where there is unrestricted
slight depression which draws flows; fastest water is just
water in from sides to fill the below surface.
depression (from previous slide)
13
(click to advance)
14. Normal Summer Low Flows:
River has little apparent flow; Vegetation on gravel bar
often seems pool like is summer growth of
Gauge Level: 1 foot annuals and other non-
permanent vegetation.
Time of Year: Summer
14
(click to advance)
15. Flood Flows:
River is over its primary banks, River looks like it is
into trees and other vegetation flooding. Muddy water, big
along the banks waves, large objects
Gauge Level: 16 foot floating down the river.
Time of Year: Summer
15
(click to advance)
16. Drowning Trap Flows:
Close examination reveals a distinct Summer growth on gravel
current. The river is not over its bar is usually covered with
primary banks water indicating higher
Gauge Level: 4 foot summer flows than normal.
Time of Year: Summer
16
(click to advance)
17. Assumptions &
Premises: Cumberland
Paw Paw
Hancock
• Consistent hydrology Shepherdstown
along the mainstem – Little Falls
except Cumberland
• Compared profiles
• Same channel,
proportional depth and
width, just larger
drainage areas…
• Gauge readings correlate
with each other Point of Rocks
• Point of Rocks used as
reference or base point.
17
(click to advance)
18. Velocity - SURFACE WATER
VELOCITY
General River: (feet/second) Drowning Trap Ranges
• Moving water has power Maximum
• At low levels, a one foot Average
change can double the Minimum
velocity (click to advance)
• At moderate levels it
results in a change of
0.5 feet/second
(click to advance)
• Most drownings
occurred between
Velocity
2-6 feet
Doubles
• Flood - 16’
• Relationship is a function
of river channel (see
profiles)
POINT OF ROCKS
• Push over a 5’10” man (next 1foot GAGE (feet)
slide 1.0-1.5 and 2.0-2.5 ft/sec) 18
(click to advance)
19. Pushing Over a 5’10” Man:
• A simple empirical test was done in the Potomac
River near Little Falls with a 165 pound man
• In waist deep water, it takes
roughly 2-2.5 feet per
second to push you over…
• This is 4’ on Point of
Rocks Gage… middle of
Drowning Trap flows.
• In chest deep water, it
takes only 1-1.5 feet per
second to push you over.
• This equates to 2’ on Point
of Rocks gage 1-1.5 feet
per second 2-2.5 feet
• Conclusion: It doesn’t take per second
much to move you about in
the moving water.
19
(click to advance)
20. Velocity - SURFACE WATER
VELOCITY
Behind a Dam: (feet/second) Drowning Trap Ranges
• Velocity for the general Maximum
river is shown for
comparison
• Velocity behind a dam, Minimum
starts slowly and then
catches up to general
general velocities,
• Conclusion: You have the
same flow problems
behind a dam, it starts
slower and takes longer
to catch up with general
river flows.
POINT OF ROCKS
GAGE (feet)
20
(click to advance)
21. River Profiles - Impact:
• River profile of river at Point of Rocks, Maryland (note distortion)
• Typical summer levels
GAUGE LEVEL
Feet
• Drowning Trap
flows
• Floods - big,
muddy, over
the bank, into Flood - 16’
the trees,
cows floating
down river
Drowning Trap Levels: 3.4’ - 5.2’
• Conclusion: This
is one reason
why Drowning
Trap levels are
deceptive.
WIDTH OF RIVER - Point of Rocks
21
(click to advance)
22. User Groups and
Deceptiveness -
• Four user groups
examined:
– Tubers
– Canoeists
– Power boaters and
– Waders/swimmers
• Conclusion: They
need different
management styles.
22
(click to advance)
23. Assumptions and
Premises:
• Groups are not homogenous …
differences between user
groups are explainable
• Total sample size...
• Sub-sample sizes
• Canoeists sampled
• Power boaters includes PWCs.
23
(click to advance)
24. Tubers: We drink alcoholic beverages on
the river (40%) …
• Well educated (65% We are all good swimmers, and
college graduates)
• Younger (80% under30 None of us wore life jackets.
years old)
• Three quarters (75%) one
time visitors
• Seek nature, to be with a
group, group affiliation
• They are not safety
conscious,
• Profile: Young, educated
fun-seekers who are one-
time users.
24
(click to advance)
25. Canoeists: None of us admitted to having
alcoholic beverages…
• Very well educated (72% We all rated ourselves as
college graduates) good swimmers…
• Older (67% over 30 years Everyone wore a lifejacket.
old)
• Half (50%) visited this site
the equivalent of three
weeks a year (20+ days)
• Seek nature, use their skills,
obtain dominance, seek
achievement, exercise, and
use their equipment
• They are safety conscious,
• Profile: highly educated,
frequent users who test
their skill on the rapids.
25
(click to advance)
26. Power Boaters: Three out of ten of us admit to
having alcoholic beverages…
• Also includes individual We rate ourselves as good
water craft swimmers, and
• Lower educated (73% are Three quarters of us don’t wear
not college graduates) lifejackets.
• Older (44% over 30 years
old)
• 79% visited this site the
10 or more days a year
• Seek nature, be with
their family, and use
their equipment,
• Profile: Middle age, local
residents who boat
frequently with their
families.
26
(click to advance)
27. Waders and
Three out of ten of us admit to
Swimmers: consuming alcoholic beverages…
We rated ourselves as good
• Not well educated (71% swimmers (98%)…
didn’t go to college) We don’t wear lifejackets either
• Young (71% under 29 years) (98%).
• 56% visited this site one
time a year
• Seek nature, doing their
own thing, and temporary
escape,
• Profile: Local youth who go
to the river once or twice
to party and have fun.
27
(click to advance)
28. These following questions may
Deceptiveness: suggest that people really don’t
know when the river is
dangerous?
• How often do you visit Think about it… Will I really be
the Potomac River? familiar with the river if I only
• Can you tell when the visit it once or twice a year?
river is dangerous?
• Do you consume alcohol
while on the river?
• Do you wear a lifejacket?
• More analysis of these
questions on the next slides.
28
(click to advance)
29. Infrequent Users:
• Overall, 46% recreate on
Potomac two or less year I’m a one time user.
• Overall, 40% indicated that Of course, I can tell when
they visited this site only once the river is dangerous...
a year can’t I?
• 54% of tubers and 29% of
waders & swimmers indicated
that they will participate only
once in this activity this year,
• 86% of canoeists and 48% of
power boaters will participate
20+ times a year,
• Conclusion: tubers and waders &
swimmer are infrequent users;
canoeists and power boater are
frequent users.
29
(click to advance)
30. I Can Tell Unlike everyone else, over one
half (57%) of our group were
When the River not sure that we could tell when
the river was dangerous
is Dangerous: Maybe we can recognize our
limitations?
• Overall, seven out of ten (69%)
of Potomac River users agreed
with the statement
• In other words, they believe
that they know when the river is
dangerous … think flood & one
time users
• Tubers were the exception,
• Conclusion: Potomac users think
they know when the river is
dangerous when, maybe, they really
don’t know.
30
(click to advance)
31. I Wear a Either we are inherently
Lifejacket: safe or we wear
lifejackets out of habit...
Regardless, all (100%) of
• Overall, four out of ten (42%) our group wore lifejackets.
Potomac River users wear
lifejackets
• Power boater are overstated
since individual water crafts
require lifejackets worn
• Few tubers (98%) wore
lifejackets
• Canoeists were the exception,
• Conclusion: At Harpers Ferry,
canoeists do, tubers don’t wear
lifejackets.
31
(click to advance)
32. I Consume We are here to have
Alcohol while on fun. Four out of ten
(40%) admitted to
the River: consuming alcohol while
on the river.
• Overall, one out of four (26%)
of Potomac River users
admitted to consuming alcohol
while on the river
• Three out of ten (30%) of
power boaters and
wader/swimmers did too
• Canoeists didn’t; tubers did,
• Conclusion: If you drink while on
the river, do you really
understand the dangers of the
river?
32
(click to advance)
33. The Dangers Are If you visit the river once or
Deceptive: twice a year and it is not at flood,
should we really expect you to
know when it is dangerous?….
• Most people are one time
users who lack familiarity No, because you don’t know
with the river and its enough to know when it is
dangers dangerous
• They practice unsafe
practices...
– lifejackets
– alcohol consumption,
• Yet they think that they are
safe…,
• Conclusion: User behavior and
attitudes are another reason
why the non-flood Drowning
Trap levels are deceptive and
dangerous.
33
(click to advance)
34. User statistics summarized
in a picture:
• This picture summarizes
the user survey.
• Canoeists and kayakers
wore life jackets
• Tubers...
– Kids wore life jackets
– Parents were not
wearing life jackets
– Note cooler in tube …
adult beverages???
Source: The Potomac River Study; Bull Falls near Harpers Ferry, WV
34
(click to advance)
35. Melanie Carlson Case Study:
• The statistics are
reflected in antidotal
evidence.
• Fox News out of
Detroit sent a crew to
video where Melanie
Carlson drowned and
videoed this near-
accident the same day.
• The near accident is
the same deadly
strainer later the
same day.
Note the compression wave and the force of
(Show video)
water on the rear deck of the kayak.
35
(click to advance)
36. Can you tell the
difference?
• Average summer flow is 250 cfs
(bottom left photo).
• Even at 900 cfs, the river on the
right looks fairly benign.
• This is 3½ times faster than
normal summer flow.
• Can you tell the difference?
36
A strainer on the Clinton River at 250 cfs The Clinton River at 900 cfs (click to advance)
37. Does this river look dangerous?
• Remember, flooding
rivers are…
– Over their banks
– Muddy
– Big waves
– Propane tanks floating
down the river
– You know the
characteristics
• This river…
– Is not flooding
– Is well within its banks The Clinton River at 900 cfs. It is well within its banks.
– It looks normal!
• These boaters don’t perceive the power and
dangers of moderate flows.
• Drowning Trap flows are potentially dangerous. 37
(click to advance)
38. Summary and Findings:
• As the depth of the river
Depth of the River
increases, its velocity and
power to do something to +
you (drown) increases also
Velocity
• Since you lack familiarity
with the river, the benign +
looking river (non-flood) Deceptiveness
is deceptive because it
doesn’t look dangerous, =
• Conclusion: It is the power of
Drowning Trap
the river and the lack of
user understanding which
leads to the Drowning Trap.
38
(click to advance)
39. Where to Look for
Drowning Trap flows:
• Spring flows in summer
Depth of the River
• Summer weather
during late Spring +
• Dam releases
Velocity
• Flash floods
• Anytime flows are +
higher than normal and
the weather is warm. Deceptiveness
=
Drowning Trap
39
(click to advance)
40. Quite simply, at the
moderate Drowning Trap
levels the river has the power
to become a contributing
factor in fatalities.
The End
40
(click to advance)