Download as PDF, PPTX
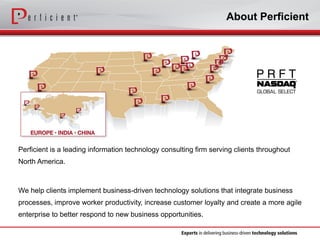

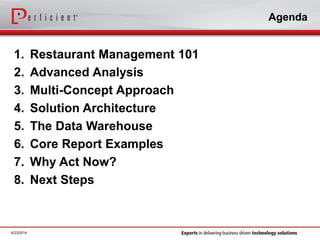


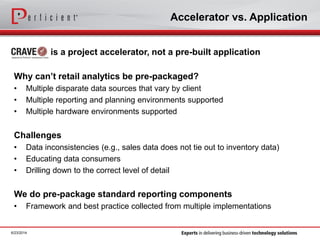
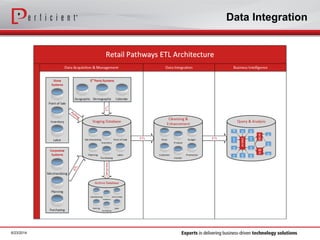
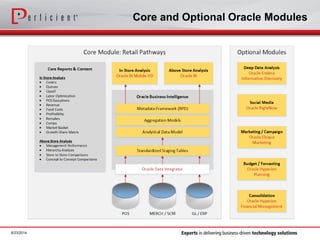
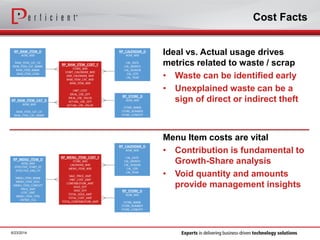
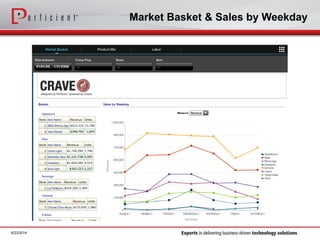
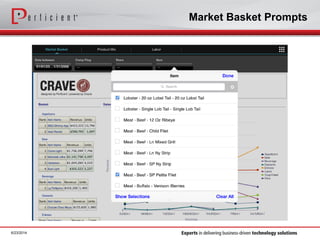

The document discusses how Perficient aids mobile restaurant operations through Oracle Business Intelligence and analytics, emphasizing metrics like food costs and labor productivity. It outlines strategies for restaurant management, advanced data analysis techniques, and the importance of understanding guest experiences to drive profitability. The document also highlights current industry practices, such as Darden's use of analytics to enhance customer understanding and performance metrics.