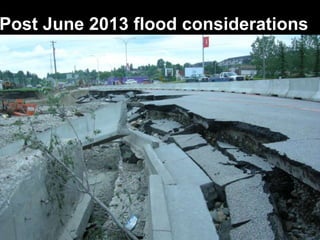
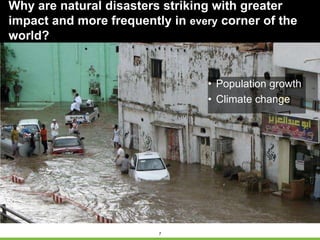
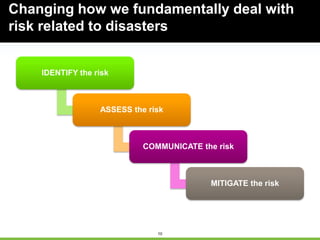
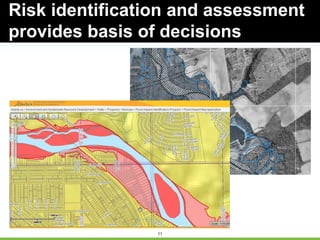
1
Post June 2013 flood considerations
AECOM Background
3
AECOM is a global provider of professional technical and management support services to a broad range
of markets, including transportation, facilities, environmental and energy. AECOM is a leader in all of the
key markets that it serves.
125Serving 125 countries
45K45,000 dedicated
professionals working
globally
$7+bnUS$7.3 billion of revenue
during the 12 months ended
March 31, 2011
No.1Top 500 Design Firm
353Ranked No.353 in
Fortune 500
AECOM
Disaster – The Way Forward
Introducing AECOM Page 3
Overview
6
With advance information, costly mistakes can
be
avoided, destruction averted, and the way
to lasting
victory made clear.
Sun Tzu:
7
• Population growth
• Climate change
Why are natural disasters striking with greater
impact and more frequently in every corner of the
world?
8
Alberta is projected to grow from 4
to 6 million people by 2041
9
FEMA / AECOM
National Climate Change Report
Example Change: Q100
Released
by Whitehouse
June 2013
Significant Technical Findings:
• By Year 2100 riverine floodplains will double in size,
• Coastal areas will double in size
Significant Financial Findings In today‟s dollars:
• Average loss cost per policy will increase by approximately 90%
• Individual premiums will increase 10% to 40%
10
IDENTIFY the risk
ASSESS the risk
COMMUNICATE the risk
MITIGATE the risk
Changing how we fundamentally deal with
risk related to disasters
11
Risk identification and assessment
provides basis of decisions
12
Risk communication needs to be
relevant
13
Risk mitigation to change in
behavior
14
Proactive Planning
• Estimated cost $1
Reactive Emergency
Response
• Estimated cost $5-7
COST: What is the bottom line?
15
The ill-logical hydrologic cycle
Flood
Panic
Plan
Delay
Funding is the
typical reason why
action is not
taken.
Funding needs to
take advantage of
political good will
16
“Oh don’t worry, we have a plan…”
17
What level
of
protection
(critical
facilities)
Should it
include
future
conditions
Should
freeboard
be
expanded
Should set-
backs /
floodway
be
established
How should re-building take place?
17
Clarifying Confusing Standards for Public
19
We have confused the public with
different definitions
Bridge Standard
AN ABSOLUTE
Flood Plain Elevation
AN AVERAGE
20
All structures
operate
correctly and will
not fail
Structures will
not be
obstructed with
debris
Only existing
conditions are
considered
Degree of
uncertainty of
the science
We need to inform the public on the
underlying assumptions
21
Assumption: Structures will operate
properly and will not fail
22
Assumption: Structures will not be
blocked with debris
23
Assumption: Only existing
conditions are reflected on the maps
24
Assumption: The average flood
will occur
Regression Estimate
Upper & Lower
Prediction Limits
Water Surface
Average 1% Flood
25
Statistics are used to predict the
future
26
Statistics use confidence limits to
show range of likely results
27
People generally do not associate
mud and debris with flooding
28
How effective are we today in
communicating flood?
29
Can products be improved to help guide
behavior?
Path for success
31
Planning a path forward
Top Success Factors
Source: PwC Mori Survey 1997
% of Companies Responding
Ensuring top sponsorship 82%
Treating people fairly 82%
Involving employees 75%
Giving quality communications 70%
Providing sufficient training 68%
Using clear performance
measures
65%
Building teams after change 62%
Focusing on culture/skill changes 62%
Rewarding success 60%
Using internal champions 60%
Reasons for Failure
Source: 1995 Harvard Business Review
One Way Communications
Under communicating the vision by a
factor of 10
Lack of Commitment Among Workforce
Not removing obstacles to achieve the
new vision
Poor Change Management
Not planning for change response from
stake holders and not communicating
benefits to them
Small Scale Success
Declaring Victory too soon and stopping
Culture Resistance or Rejections
Not anchoring change in the organization
culture
32
Simultaneously working on three
fronts to drive business benefit
33
Resist Reinforce Restrict Retreat
Protect with
gates, levees
and hard
structures
Protect what
we must
Upgrade
building codes/
ordinances
Where it’s too
difficult or
impossible to
protect
Investigate + Study
Likely Scenarios
34
The Road Map to Recovery
• Define the Need / Create
the Vision
• Assess the Extent of
Damage and Scoping the
Works
• Reviewi the Options and
assertain the priorities
• Accelerate the „Early Wins‟
• Develop the Infrastructure
Response Plan
• Agree the Strategy for
Recovery
• Create the Infrastructure
Master Plan
• Develop the Master
Schedule and Budget
• Set up the Management
Controls and Reporting
Structure
• Establish the Key
Performance Indicators /
Deliverables
• Mobilise the Program Team
• Develop the Master
Infrastructure Recovery
Plan
• Produce the Execution
Strategy and
Implementation Plan
• Procure the Design
Consultants
• Accelerate the Enabling
Works Packages
• Monitor and Control the
Program
• Launch the „Investor
Confidence Initiative‟
• Communicate the „Good
News‟ stories globally
• Produce the Procurement
Strategy for Implementation
• Appoint the Program
Management Consultant for
Delivery
• Launch the Recovery
Program
Stage 1 – (30-120 Days) Stage 2 – (60 -180 Days) Stage 3 – (60+ Days)
STRATEGIC PLANNING PHASE
RESPOND RECOVER– Short Term RECOVER – Long Term
Page 34
Mitigation planning
36
Property Protection
• Acquisition
• Relocation
• Building elevation
• Critical facilities
protection
• Structural Retrofitting
• Safe rooms, shutters,
shatter-resistant glass
• Insurance
37
Natural Resource Protection
• Floodplain protection
• Watershed management
• Riparian buffers
• Forest and vegetative
management
• Erosion and sediment
control
• Wetland preservation and
restoration
• Habitat preservation
• Coastal management
38
Structural / Engineered Projects
• Reservoirs
• Dams, levees, dikes
• Seawalls, revetments,
gabions
• Flood / tide gates,
hurricane barriers
• Stormwater diversions,
detention/retention
basins, channel
modification
• Reservoirs
• Beach nourishment, dune
restoration
• Slope stabilization
39
Correcting Mistakes of the Past
40
• Risk Communication (i.e.
hazard map information)
• Outreach projects
• Speaker series/
demonstration events
• Real estate disclosure
• Library materials
• School children
educational programs
• Hazard expositions
• Technical assistance
Public Education & Awareness
41
Emergency Services
• Warning systems
• Emergency response
equipment
• Shelter operations
• Evacuation planning and
management
• Emergency response
training and exercises
• Sandbagging for flood
protection
• Installing temporary
shutters
42
What makes a good mitigation plan?
• Process vs. Product
– “Plans are worthless. Planning is essential.”
–Dwight D. Eisenhower
• Holistic mitigation strategy
– Includes projects + policies + programs + recurring activities
• Specific, practical and measurable actions
– Linked to sound assessments of risk and capability
• Straightforward implementation mechanisms
– Routine monitoring, evaluating and updating
– Integration with other community processes/initiatives
– Effectively applied following disaster events
43
Planning Process
44
• Involve the public – not as easy as it sounds!
• Develop strategy for multiple methods of engagement
– Meetings / Open Houses
– Public Opinion Surveys – hard copy and web-deployed
– Combine efforts with other public outreach initiatives
– Be creative in getting the word out
Planning Process
45
Continuous outreach and public relations yields
actions at the community
NEW
FLOOD MAPS
46
Planning Process
47
Planning Process
48
• Involve local media
– Press releases, interviews, etc.
• Establish more formal roles for those
interested in participating in the process
– Citizen Advisory Committee
– Stakeholder Interest Groups
Planning Process
49
• Relies heavily on historical data,
GIS technology, and probabilistic
risk modeling
• Better local data = better risk
assessments
• Better risk assessments do not
necessarily lead to higher quality
mitigation plans
– Have often been the most
overemphasized phase of the
planning process
Risk Assessment
50
HAZUS quantifies the disaster
Short
Term
Shelter
Substantial
Damage
Essential
Facility Loss
of Use
Debris
Generated
Truckloads
Required to
Remove
Economic
Loss
Ottawa 2,695 104 0 46,514 1,861 180.0M
Rogers 5,194 310 0 64,385 2,575 256.2M
Muskogee 2,023 69 4 26,456 1,058 111.8M
Pittsburg 825 113 0 30,235 1,209 117.6M
Carter 949 23 0 14.939 597 71.5M
Logan 857 79 2 21,461 858 102.2M
51
Predicting the risk of flood in
financial terms
52
HAZUS: Based on best data
53
Risk Assessment: Assessing Vulnerability
54
Risk Assessment: Assessing Vulnerability
Estimated Potential Losses to Flood Hazards
Return
Interval
Capital Stock Losses Business Interruption Losses
Total LossTotal
Building
Damage
Total
Contents
Damage
Inventory
Loss
Relocation
Loss
Capital
Related
Loss
Wage
Losses
Rental
Income
Loss
10-Year $35,002,000 $44,332,000 $1,969,000 $226,000 $228,000 $1,148,000 $65,000 $82,970,000
50-Year $47,887,000 $60,430,000 $2,430,000 $316,000 $321,000 $1,255,000 $100,000 $112,739,000
100-Year $56,112,000 $73,797,000 $3,309,000 $390,000 $542,000 $1,501,000 $147,000 $135,798,000
500-Year $66,630,000 $88,974,000 $3,956,000 $445,000 $606,000 $1,861,000 $174,000 $162,646,000
Additional Impacts Caused by Flood Hazards
Return Interval
Debris Generated
(tons)
Displaced
Households
Temporary
Shelter Needs
10-Year 10,821 2,407 5,124
50-Year 14,446 3,066 6,860
100-Year 15,368 3,164 7,194
500-Year 17,539 3,534 8,200
55
Risk Assessment: Assessing Vulnerability
56
Risk Assessment: Summary Conclusions
Table 6.21
Summary of Results
Hazard
Category/Degree of Risk
Probability Impact Spatial Extent Warning Time Duration PRI Score
Atmospheric Hazards
Extreme Temperatures Highly Likely Minor Small More than 24 hours Less than one week 2.3
Extreme Wind Highly Likely Critical Large More than 24 hours Less than 24 hours 3.2
Hurricane & Tropical Storm Likely Catastrophic Large More than 24 hours Less than 24 hours 3.2
Lightning Highly Likely Minor Negligible Less than 6 hours Less than 6 hours 2.2
Nor’easter Highly Likely Catastrophic Large More than 24 hours Less than one week 3.6
Tornado Likely Limited Small Less than 6 hours Less than 6 hours 2.4
Winter Storm Highly Likely Limited Large More than 24 hours Less than one week 3.0
Hydrologic Hazards
Coastal Erosion Highly Likely Limited Moderate More than 24 hours More than one week 2.9
Dam Failure Unlikely Critical Small Less than 6 hours Less than 6 hours 2.1
Drought Possible Limited Moderate More than 24 hours More than one week 2.3
Flood Highly Likely Critical Moderate 6 to 12 hours More than one week 3.4
Storm Surge Possible Critical Moderate More than 24 hours Less than 24 hours 2.4
Wave Action Highly Likely Limited Moderate More than 24 hours More than one week 2.9
Geologic Hazards
Earthquake Unlikely Minor Small Less than 6 hours Less than 6 hours 1.5
Landslide Likely Critical Small Less than 6 hours Less than 6 hours 2.7
Other Natural Hazards
Wildfire Highly Likely Minor Moderate Less than 6 hours Less than one week 2.8
57
Risk Assessment: Summary Conclusions
58
Risk Assessment: Summary Conclusions
Table 5.22
Conclusions on Hazard Risk
HIGH RISK
Nor’easter
Flood
ExtremeWind
Hurricaneand TropicalStorm
WinterStorm
MODERATE RISK
CoastalErosion
WaveAction
Wildfire
Landslide
StormSurge
Tornado
LOW RISK
Drought
ExtremeTemperatures
Lightning
DamFailure
Earthquake
59
Mitigation Strategy: Mitigation Action Plan
Action
Category
Hazard
Objective(s) Addressed
Priority
Funding Sources
Responsibility
Completion Date
Background
60
Mitigation Strategy: Mitigation Action Plan
• Actions should:
– be realistically achievable;
– be measureable (include
performance-based outcomes);
– be tied to specific assignments of
responsibility;
– include a mix of mitigation
techniques:
• Prevention
• Property Protection
• Natural Resource Protection
• Structural Projects
• Public Education & Awareness
61
Assign and enforce responsibility/accountability
Transparent and uniform method
of comparing projects
63
• Uniform Cost Estimate
– Pre-construction costs
– Construction costs
– Ancillary costs (permits, A&E fees …)
– Annual maintenance costs
– Time value of money
• Benefits
– Avoided damages and losses
– Avoided causalities
– Avoided emergency management
costs
Transparent uniform method
to rank projects
Transparency in Decisions
Triple Bottom Line Tool
65
The Triple Bottom Line (TBL)
66
Financial (LCA)
Capital Costs
Operations
and Other* Costs
Environmental
Climate
Habitat
Water Use
Water Quality
Air Quality
Natural Resource Inputs
Social
System Resilience
Ratepayer Affordability
Bicycle and Pedestrian
Environment
Odor
Noise
Recreation / Open Space
Employment
Cultural Resources
Construction Impacts
TBL Evaluation Criteria
* Includes Operations & Maintenance, Replacement & Renewal, Decommissioning, and Avoided Costs
67
Operations and
maintenance
Replacement and
renewal
Decommissioning
Sale of bio-fuel
energy
Avoided water
treatment
Avoided combined
sewer discharge
Design and
planning
Capital equipment
Installation and
construction
Operating
cost
Avoided cost
Capital
cost
LCA Components
68
TBL Model
Summary Sheet
Doesn‟t produce a recommendation or overall score
69
TBL Model Components
Project Alternatives Comparison
Project Management
71
Program management lowers risk
Leadership Skills
Capacity
Latest
Enabling
Technology
Schedule
Quality
Cost
72
PM plan key processes developed
real program experience
 Financial Management
 Schedule Management
 Requirements Management
 Deliverable Management
 Data Management
 Communications Management
 Change Management
 Risk Management
 Action Item Management
 Subcontract Management
 Quality Management
73
• Risks – Adequate reporting and Timely information to client
PMI Life Cycle Processes
Monitoring & Controlling Tracks
73
Key
performance
metrics
Balanced
scorecard
Shared
metrics
Earned value
management
EVM portal
74
Plan
Do
Check
Act
The QMP Defines the Levels of QA/QC
 Checklists
 Peer Reviews
 Independent Reviews
 Senior Technical
Reviews
 QASP
75
Plan
Do
Check
Act
The QMP Provides a Means for Learning and
Improving
 Lessons Learned
 Process Improvement
 Project Closeout
Lessons Learned Library
identifies opportunities for
Process Improvement
Flood simulation can teach actions
77
• Serious computer game and simulator
– Developed by PlayGen, Ltd. under direction from ASFPM Foundation
– PlayGen, Ltd developed “FloodSim” game for public awareness in the
UK
• Purpose:
– Simulation & learning environment for decision-makers
– Teach disaster-resilient & NAI principles for community development
– Show community health and smart floodplain management link
• Sponsorship opportunities available
“FloodManager” Interactive
Professional Game
78
Initial Town Layout
79
Build Menu
80
Storm Animation
81
News Flash
82
End of Year Summary
Preparing for the next flood disaster
84
Winnipeg Digital Flood Manual
• Allows effective management for flooding
• Easy transition plan as staff retire
85
Simulated flood scenarios
• View the Flood Procedure Database component
• Select desired flood scenario
• Specify query criteria
• Display query results with resource quantities in
tabular or map display
86
All flood defense activities tracked
• Print task lists for field
crews
• Enter activity activation
/ deactivation data
87
All documentation digital
Flood Warning
89
Simple
Complicated Complex
Forecasting
Mapping
Difficulty of flood prediction
90
Stage 1: Planning Stage 2: Design & Implementation Stage 3: Operations
Proposed Implementation Process
Determine Needs & Capabilities Develop Systems & Procedures Effective & Sustainable Operations
Flood Warning System
Page 90
• Identify Areas to Receive
Flood Warning Protection
• Identify Flood Hazards in
the Defined Areas
• Research Historical Floods
(known hazards)
• Prepare Engineering Models to
Simulate Flood Scenarios
(potentially unknown hazards)
• Identify Populations and
Infrastructure at Risk in the
Flood Hazard Areas
• Assess Response
Capabilities
• Identify Organizations which
Participate in Flood Response
in the Defined Areas
• Estimate Response Capabilities
and Timelines
• Identify Responsible Agency
• Develop a Funding Plan
• Meteorological Forecasting
• Local Agency and/or 3rd Party
• Precipitation Monitoring
• Satellite, Radar and Gauges
• Discharge Monitoring
• Gauges on Dams and Streams
• Data Collection
• Need Reliable Communications
• Flood Forecasting
• Engineering Models with Flood
Mapping (static or dynamic)
• Develop Response Plans
• Flood Emergency Action Plan
• Internal Communications Plan
• Operations & Maintenance Plan
• Public Education Plan
• Public Communications Plan
• System Implementation
Ongoing Activities:
• Operator Training
• Public Education
• Daily Operations
• Staff Operations Schedule
• Maintenance Schedule
• Monitor Meteorological
Forecasts (long & short range)
• Monitor Flood Forecast Models
• Follow EAP Guidance for Flood
Operation Triggers
• Flood Operations
• Mobilize, Monitor & Forecast
• EAP Response Guidance for
Warnings & Evacuations
• Update Forecasts
• After-action Debriefs
• Revise Plans as Appropriate
Potential next steps
92
92
• Flood recovery data
• Policy development
• Mitigation planning
• Mitigation implementation
• Knowledge sharing
Major steps forward
93
Many citizens look for leadership from the
government
94
Policies established today will establish future
resiliency of the Province
Risk communication to the public is essential for
proper individual actions
Transparency on projects is crucial for public
support
Monitor, Measure, Report, Repeat
Summary

Mitigation Symposium - Scott Edelman

  • 1.
    1 Post June 2013flood considerations
  • 2.
  • 3.
    3 AECOM is aglobal provider of professional technical and management support services to a broad range of markets, including transportation, facilities, environmental and energy. AECOM is a leader in all of the key markets that it serves. 125Serving 125 countries 45K45,000 dedicated professionals working globally $7+bnUS$7.3 billion of revenue during the 12 months ended March 31, 2011 No.1Top 500 Design Firm 353Ranked No.353 in Fortune 500 AECOM Disaster – The Way Forward Introducing AECOM Page 3
  • 4.
  • 5.
    6 With advance information,costly mistakes can
be avoided, destruction averted, and the way
to lasting victory made clear. Sun Tzu:
  • 6.
    7 • Population growth •Climate change Why are natural disasters striking with greater impact and more frequently in every corner of the world?
  • 7.
    8 Alberta is projectedto grow from 4 to 6 million people by 2041
  • 8.
    9 FEMA / AECOM NationalClimate Change Report Example Change: Q100 Released by Whitehouse June 2013 Significant Technical Findings: • By Year 2100 riverine floodplains will double in size, • Coastal areas will double in size Significant Financial Findings In today‟s dollars: • Average loss cost per policy will increase by approximately 90% • Individual premiums will increase 10% to 40%
  • 9.
    10 IDENTIFY the risk ASSESSthe risk COMMUNICATE the risk MITIGATE the risk Changing how we fundamentally deal with risk related to disasters
  • 10.
    11 Risk identification andassessment provides basis of decisions
  • 11.
  • 12.
    13 Risk mitigation tochange in behavior
  • 13.
    14 Proactive Planning • Estimatedcost $1 Reactive Emergency Response • Estimated cost $5-7 COST: What is the bottom line?
  • 14.
    15 The ill-logical hydrologiccycle Flood Panic Plan Delay Funding is the typical reason why action is not taken. Funding needs to take advantage of political good will
  • 15.
    16 “Oh don’t worry,we have a plan…”
  • 16.
  • 17.
  • 18.
    19 We have confusedthe public with different definitions Bridge Standard AN ABSOLUTE Flood Plain Elevation AN AVERAGE
  • 19.
    20 All structures operate correctly andwill not fail Structures will not be obstructed with debris Only existing conditions are considered Degree of uncertainty of the science We need to inform the public on the underlying assumptions
  • 20.
    21 Assumption: Structures willoperate properly and will not fail
  • 21.
    22 Assumption: Structures willnot be blocked with debris
  • 22.
    23 Assumption: Only existing conditionsare reflected on the maps
  • 23.
    24 Assumption: The averageflood will occur Regression Estimate Upper & Lower Prediction Limits Water Surface Average 1% Flood
  • 24.
    25 Statistics are usedto predict the future
  • 25.
    26 Statistics use confidencelimits to show range of likely results
  • 26.
    27 People generally donot associate mud and debris with flooding
  • 27.
    28 How effective arewe today in communicating flood?
  • 28.
    29 Can products beimproved to help guide behavior?
  • 29.
  • 30.
    31 Planning a pathforward Top Success Factors Source: PwC Mori Survey 1997 % of Companies Responding Ensuring top sponsorship 82% Treating people fairly 82% Involving employees 75% Giving quality communications 70% Providing sufficient training 68% Using clear performance measures 65% Building teams after change 62% Focusing on culture/skill changes 62% Rewarding success 60% Using internal champions 60% Reasons for Failure Source: 1995 Harvard Business Review One Way Communications Under communicating the vision by a factor of 10 Lack of Commitment Among Workforce Not removing obstacles to achieve the new vision Poor Change Management Not planning for change response from stake holders and not communicating benefits to them Small Scale Success Declaring Victory too soon and stopping Culture Resistance or Rejections Not anchoring change in the organization culture
  • 31.
    32 Simultaneously working onthree fronts to drive business benefit
  • 32.
    33 Resist Reinforce RestrictRetreat Protect with gates, levees and hard structures Protect what we must Upgrade building codes/ ordinances Where it’s too difficult or impossible to protect Investigate + Study Likely Scenarios
  • 33.
    34 The Road Mapto Recovery • Define the Need / Create the Vision • Assess the Extent of Damage and Scoping the Works • Reviewi the Options and assertain the priorities • Accelerate the „Early Wins‟ • Develop the Infrastructure Response Plan • Agree the Strategy for Recovery • Create the Infrastructure Master Plan • Develop the Master Schedule and Budget • Set up the Management Controls and Reporting Structure • Establish the Key Performance Indicators / Deliverables • Mobilise the Program Team • Develop the Master Infrastructure Recovery Plan • Produce the Execution Strategy and Implementation Plan • Procure the Design Consultants • Accelerate the Enabling Works Packages • Monitor and Control the Program • Launch the „Investor Confidence Initiative‟ • Communicate the „Good News‟ stories globally • Produce the Procurement Strategy for Implementation • Appoint the Program Management Consultant for Delivery • Launch the Recovery Program Stage 1 – (30-120 Days) Stage 2 – (60 -180 Days) Stage 3 – (60+ Days) STRATEGIC PLANNING PHASE RESPOND RECOVER– Short Term RECOVER – Long Term Page 34
  • 34.
  • 35.
    36 Property Protection • Acquisition •Relocation • Building elevation • Critical facilities protection • Structural Retrofitting • Safe rooms, shutters, shatter-resistant glass • Insurance
  • 36.
    37 Natural Resource Protection •Floodplain protection • Watershed management • Riparian buffers • Forest and vegetative management • Erosion and sediment control • Wetland preservation and restoration • Habitat preservation • Coastal management
  • 37.
    38 Structural / EngineeredProjects • Reservoirs • Dams, levees, dikes • Seawalls, revetments, gabions • Flood / tide gates, hurricane barriers • Stormwater diversions, detention/retention basins, channel modification • Reservoirs • Beach nourishment, dune restoration • Slope stabilization
  • 38.
  • 39.
    40 • Risk Communication(i.e. hazard map information) • Outreach projects • Speaker series/ demonstration events • Real estate disclosure • Library materials • School children educational programs • Hazard expositions • Technical assistance Public Education & Awareness
  • 40.
    41 Emergency Services • Warningsystems • Emergency response equipment • Shelter operations • Evacuation planning and management • Emergency response training and exercises • Sandbagging for flood protection • Installing temporary shutters
  • 41.
    42 What makes agood mitigation plan? • Process vs. Product – “Plans are worthless. Planning is essential.” –Dwight D. Eisenhower • Holistic mitigation strategy – Includes projects + policies + programs + recurring activities • Specific, practical and measurable actions – Linked to sound assessments of risk and capability • Straightforward implementation mechanisms – Routine monitoring, evaluating and updating – Integration with other community processes/initiatives – Effectively applied following disaster events
  • 42.
  • 43.
    44 • Involve thepublic – not as easy as it sounds! • Develop strategy for multiple methods of engagement – Meetings / Open Houses – Public Opinion Surveys – hard copy and web-deployed – Combine efforts with other public outreach initiatives – Be creative in getting the word out Planning Process
  • 44.
    45 Continuous outreach andpublic relations yields actions at the community NEW FLOOD MAPS
  • 45.
  • 46.
  • 47.
    48 • Involve localmedia – Press releases, interviews, etc. • Establish more formal roles for those interested in participating in the process – Citizen Advisory Committee – Stakeholder Interest Groups Planning Process
  • 48.
    49 • Relies heavilyon historical data, GIS technology, and probabilistic risk modeling • Better local data = better risk assessments • Better risk assessments do not necessarily lead to higher quality mitigation plans – Have often been the most overemphasized phase of the planning process Risk Assessment
  • 49.
    50 HAZUS quantifies thedisaster Short Term Shelter Substantial Damage Essential Facility Loss of Use Debris Generated Truckloads Required to Remove Economic Loss Ottawa 2,695 104 0 46,514 1,861 180.0M Rogers 5,194 310 0 64,385 2,575 256.2M Muskogee 2,023 69 4 26,456 1,058 111.8M Pittsburg 825 113 0 30,235 1,209 117.6M Carter 949 23 0 14.939 597 71.5M Logan 857 79 2 21,461 858 102.2M
  • 50.
    51 Predicting the riskof flood in financial terms
  • 51.
  • 52.
  • 53.
    54 Risk Assessment: AssessingVulnerability Estimated Potential Losses to Flood Hazards Return Interval Capital Stock Losses Business Interruption Losses Total LossTotal Building Damage Total Contents Damage Inventory Loss Relocation Loss Capital Related Loss Wage Losses Rental Income Loss 10-Year $35,002,000 $44,332,000 $1,969,000 $226,000 $228,000 $1,148,000 $65,000 $82,970,000 50-Year $47,887,000 $60,430,000 $2,430,000 $316,000 $321,000 $1,255,000 $100,000 $112,739,000 100-Year $56,112,000 $73,797,000 $3,309,000 $390,000 $542,000 $1,501,000 $147,000 $135,798,000 500-Year $66,630,000 $88,974,000 $3,956,000 $445,000 $606,000 $1,861,000 $174,000 $162,646,000 Additional Impacts Caused by Flood Hazards Return Interval Debris Generated (tons) Displaced Households Temporary Shelter Needs 10-Year 10,821 2,407 5,124 50-Year 14,446 3,066 6,860 100-Year 15,368 3,164 7,194 500-Year 17,539 3,534 8,200
  • 54.
  • 55.
    56 Risk Assessment: SummaryConclusions Table 6.21 Summary of Results Hazard Category/Degree of Risk Probability Impact Spatial Extent Warning Time Duration PRI Score Atmospheric Hazards Extreme Temperatures Highly Likely Minor Small More than 24 hours Less than one week 2.3 Extreme Wind Highly Likely Critical Large More than 24 hours Less than 24 hours 3.2 Hurricane & Tropical Storm Likely Catastrophic Large More than 24 hours Less than 24 hours 3.2 Lightning Highly Likely Minor Negligible Less than 6 hours Less than 6 hours 2.2 Nor’easter Highly Likely Catastrophic Large More than 24 hours Less than one week 3.6 Tornado Likely Limited Small Less than 6 hours Less than 6 hours 2.4 Winter Storm Highly Likely Limited Large More than 24 hours Less than one week 3.0 Hydrologic Hazards Coastal Erosion Highly Likely Limited Moderate More than 24 hours More than one week 2.9 Dam Failure Unlikely Critical Small Less than 6 hours Less than 6 hours 2.1 Drought Possible Limited Moderate More than 24 hours More than one week 2.3 Flood Highly Likely Critical Moderate 6 to 12 hours More than one week 3.4 Storm Surge Possible Critical Moderate More than 24 hours Less than 24 hours 2.4 Wave Action Highly Likely Limited Moderate More than 24 hours More than one week 2.9 Geologic Hazards Earthquake Unlikely Minor Small Less than 6 hours Less than 6 hours 1.5 Landslide Likely Critical Small Less than 6 hours Less than 6 hours 2.7 Other Natural Hazards Wildfire Highly Likely Minor Moderate Less than 6 hours Less than one week 2.8
  • 56.
  • 57.
    58 Risk Assessment: SummaryConclusions Table 5.22 Conclusions on Hazard Risk HIGH RISK Nor’easter Flood ExtremeWind Hurricaneand TropicalStorm WinterStorm MODERATE RISK CoastalErosion WaveAction Wildfire Landslide StormSurge Tornado LOW RISK Drought ExtremeTemperatures Lightning DamFailure Earthquake
  • 58.
    59 Mitigation Strategy: MitigationAction Plan Action Category Hazard Objective(s) Addressed Priority Funding Sources Responsibility Completion Date Background
  • 59.
    60 Mitigation Strategy: MitigationAction Plan • Actions should: – be realistically achievable; – be measureable (include performance-based outcomes); – be tied to specific assignments of responsibility; – include a mix of mitigation techniques: • Prevention • Property Protection • Natural Resource Protection • Structural Projects • Public Education & Awareness
  • 60.
    61 Assign and enforceresponsibility/accountability
  • 61.
    Transparent and uniformmethod of comparing projects
  • 62.
    63 • Uniform CostEstimate – Pre-construction costs – Construction costs – Ancillary costs (permits, A&E fees …) – Annual maintenance costs – Time value of money • Benefits – Avoided damages and losses – Avoided causalities – Avoided emergency management costs Transparent uniform method to rank projects
  • 63.
  • 64.
  • 65.
    66 Financial (LCA) Capital Costs Operations andOther* Costs Environmental Climate Habitat Water Use Water Quality Air Quality Natural Resource Inputs Social System Resilience Ratepayer Affordability Bicycle and Pedestrian Environment Odor Noise Recreation / Open Space Employment Cultural Resources Construction Impacts TBL Evaluation Criteria * Includes Operations & Maintenance, Replacement & Renewal, Decommissioning, and Avoided Costs
  • 66.
    67 Operations and maintenance Replacement and renewal Decommissioning Saleof bio-fuel energy Avoided water treatment Avoided combined sewer discharge Design and planning Capital equipment Installation and construction Operating cost Avoided cost Capital cost LCA Components
  • 67.
    68 TBL Model Summary Sheet Doesn‟tproduce a recommendation or overall score
  • 68.
    69 TBL Model Components ProjectAlternatives Comparison
  • 69.
  • 70.
    71 Program management lowersrisk Leadership Skills Capacity Latest Enabling Technology Schedule Quality Cost
  • 71.
    72 PM plan keyprocesses developed real program experience  Financial Management  Schedule Management  Requirements Management  Deliverable Management  Data Management  Communications Management  Change Management  Risk Management  Action Item Management  Subcontract Management  Quality Management
  • 72.
    73 • Risks –Adequate reporting and Timely information to client PMI Life Cycle Processes Monitoring & Controlling Tracks 73 Key performance metrics Balanced scorecard Shared metrics Earned value management EVM portal
  • 73.
    74 Plan Do Check Act The QMP Definesthe Levels of QA/QC  Checklists  Peer Reviews  Independent Reviews  Senior Technical Reviews  QASP
  • 74.
    75 Plan Do Check Act The QMP Providesa Means for Learning and Improving  Lessons Learned  Process Improvement  Project Closeout Lessons Learned Library identifies opportunities for Process Improvement
  • 75.
    Flood simulation canteach actions
  • 76.
    77 • Serious computergame and simulator – Developed by PlayGen, Ltd. under direction from ASFPM Foundation – PlayGen, Ltd developed “FloodSim” game for public awareness in the UK • Purpose: – Simulation & learning environment for decision-makers – Teach disaster-resilient & NAI principles for community development – Show community health and smart floodplain management link • Sponsorship opportunities available “FloodManager” Interactive Professional Game
  • 77.
  • 78.
  • 79.
  • 80.
  • 81.
  • 82.
    Preparing for thenext flood disaster
  • 83.
    84 Winnipeg Digital FloodManual • Allows effective management for flooding • Easy transition plan as staff retire
  • 84.
    85 Simulated flood scenarios •View the Flood Procedure Database component • Select desired flood scenario • Specify query criteria • Display query results with resource quantities in tabular or map display
  • 85.
    86 All flood defenseactivities tracked • Print task lists for field crews • Enter activity activation / deactivation data
  • 86.
  • 87.
  • 88.
  • 89.
    90 Stage 1: PlanningStage 2: Design & Implementation Stage 3: Operations Proposed Implementation Process Determine Needs & Capabilities Develop Systems & Procedures Effective & Sustainable Operations Flood Warning System Page 90 • Identify Areas to Receive Flood Warning Protection • Identify Flood Hazards in the Defined Areas • Research Historical Floods (known hazards) • Prepare Engineering Models to Simulate Flood Scenarios (potentially unknown hazards) • Identify Populations and Infrastructure at Risk in the Flood Hazard Areas • Assess Response Capabilities • Identify Organizations which Participate in Flood Response in the Defined Areas • Estimate Response Capabilities and Timelines • Identify Responsible Agency • Develop a Funding Plan • Meteorological Forecasting • Local Agency and/or 3rd Party • Precipitation Monitoring • Satellite, Radar and Gauges • Discharge Monitoring • Gauges on Dams and Streams • Data Collection • Need Reliable Communications • Flood Forecasting • Engineering Models with Flood Mapping (static or dynamic) • Develop Response Plans • Flood Emergency Action Plan • Internal Communications Plan • Operations & Maintenance Plan • Public Education Plan • Public Communications Plan • System Implementation Ongoing Activities: • Operator Training • Public Education • Daily Operations • Staff Operations Schedule • Maintenance Schedule • Monitor Meteorological Forecasts (long & short range) • Monitor Flood Forecast Models • Follow EAP Guidance for Flood Operation Triggers • Flood Operations • Mobilize, Monitor & Forecast • EAP Response Guidance for Warnings & Evacuations • Update Forecasts • After-action Debriefs • Revise Plans as Appropriate
  • 90.
  • 91.
    92 92 • Flood recoverydata • Policy development • Mitigation planning • Mitigation implementation • Knowledge sharing Major steps forward
  • 92.
    93 Many citizens lookfor leadership from the government
  • 93.
    94 Policies established todaywill establish future resiliency of the Province Risk communication to the public is essential for proper individual actions Transparency on projects is crucial for public support Monitor, Measure, Report, Repeat Summary

Editor's Notes

  • #2 AECOM recently was asked to participate in the UN session on Water and Disaster for the UN Post 2015 Development Agenda. Significant progress has been made in the world to reduce poverty and increase literacy rates. One of the top threats to this progress is natural disasters. It is being seen that when a disaster occurs poverty rates increase and literacy rates decrease as resources are diverted to response needs. AECOM was asked to represent global private industry and how private industry can help nations reduce the risk towards disasters.
  • #5 3567 in Canada609 in Alberrta
  • #15 The old saying that “an ounce of prevention is worth a pound of cure” has never been truer. For every $1 spent on planning and prevention, between $4 and $7 can be saved on the response.
  • #25 Could be 5 ft vertically higher or 7 ft vertically lower
  • #30 The 1% or 100-year has a 26% chance of occurring in a 30 year mortgageThe 2% of 50-year has a 45% chance of occurringThe 10% or 10-year floodplain has a 96% chance of occurring
  • #34 Resist: Protect with gates, levees and hard structuresReinforce: Protect what we mustRestrict: Upgrade Building Codes/OrdinancesRetreat: Where it’s too difficult or impossible to protectInvestigate and Study