Download to read offline
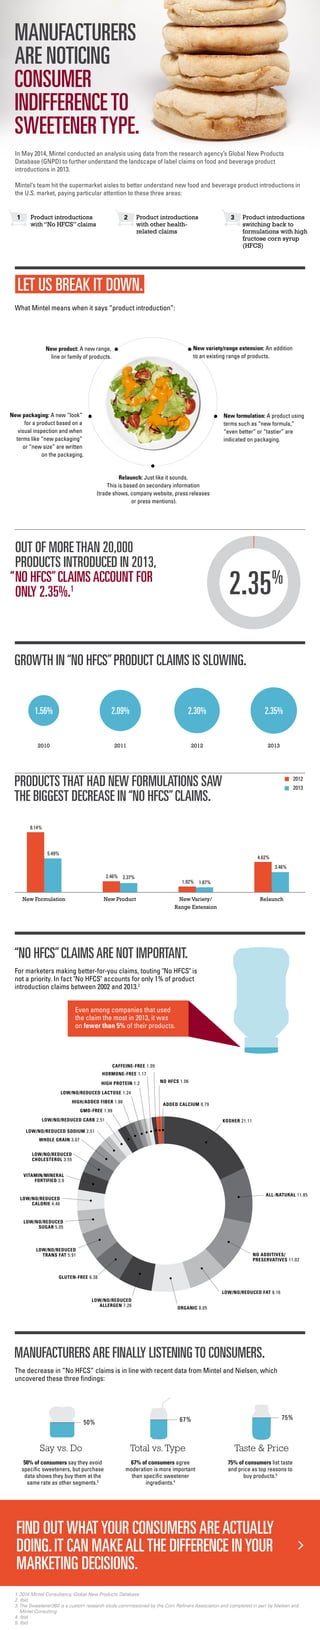

Manufacturers are observing a decline in consumer emphasis on sweetener types, particularly 'no HFCS' claims, which constitute only 2.35% of new product introductions in the U.S. for 2013. Despite an initial rise, the growth of 'no HFCS' claims is slowing, and many manufacturers are shifting focus to consumer preferences for taste and price rather than specific ingredient claims. As per consumer data, 75% prioritize taste and price, underscoring the importance of understanding actual purchasing behaviors over claimed preferences.