Mining Twitter Data with Resource Constraints 
Geoge Valkanas, Ioannis Katakis, 
Dimitrios Gunopulos, Anthony Stefanidis 
August 12, 2015 
Valkanas et al (UoA and GMU) Mining Twitter with Resource Constraints August 12, 2015 1 / 18
Research Question 
Is the 1% sample provided by the Twitter API sucient for 
spatio-temporal analysis tasks? ... which tasks? 
! We compare with the 10% sample (Garden Hose) 
Valkanas et al (UoA and GMU) Mining Twitter with Resource Constraints August 12, 2015 2 / 18
Outline 
1 Problem and Motivation 
2 Data Collection 
3 Experiments in Various Tasks 
Geo-location Coverage 
Sentiment Analysis 
Popular Topic Detection 
Graph Evolution 
4 Conclusions 
Valkanas et al (UoA and GMU) Mining Twitter with Resource Constraints August 12, 2015 3 / 18
Introduction 
Twitter Samples 
Two ways to access the stream 
Public Stream: 1% Sample 
Garden Hose: 10% Sample 
... in both cases, we don't know details about the sampling method. 
Valkanas et al (UoA and GMU) Mining Twitter with Resource Constraints August 12, 2015 4 / 18
Introduction 
Constraints 
Financial cost 
Licences of larger samples, are costly and dicult to obtain. 
Computational cost 
7 Giga Bytes per minute 
O the shelf approaches are unable to operate in such settings 
In practice: those who engage in social media analytical tasks have 
practically no choice but to resort to the downsized information. However, 
being only a small fraction of the entire stream, it is unclear how reliable 
this information is for each type of application. 
Valkanas et al (UoA and GMU) Mining Twitter with Resource Constraints August 12, 2015 5 / 18
Introduction 
A more concrete example 
The INSIGHT Project: Improve understanding, prediction and warning of 
emergencies through real-time processing of data streams including social 
data. 
(a) Floods in Germany (2013) (b) Control Center in Dublin CC 
How much data are ecient for our task? 
Valkanas et al (UoA and GMU) Mining Twitter with Resource Constraints August 12, 2015 6 / 18
Introduction 
Tasks we look into... 
Sentiment Analysis 
Geo-located information 
Popular tweets 
Social Graph Evolution 
Linguistic Analysis 
Valkanas et al (UoA and GMU) Mining Twitter with Resource Constraints August 12, 2015 7 / 18
Data 
The data 
10M 
1M 
100K 
Default Gardenhose 
0 20 40 60 80 100 
Tweet Count 
Hours 
(c) All tweets 
100K 
10K 
1K 
Default Gardenhose 
0 20 40 60 80 100 
GPS Tweet Count 
Hours 
(d) GPS-tagged tweets 
Figure : Comparing default and gardenhose samples for volume over time 
4 day period - November 2013 
The two samples dier by an order of magnitude 
Exhibit the same temporal pattern 
Geotagged tweets are between 1-2% of their respective sampled data 
Geotagged are more 
attened out 
Valkanas et al (UoA and GMU) Mining Twitter with Resource Constraints August 12, 2015 8 / 18
Experiments 
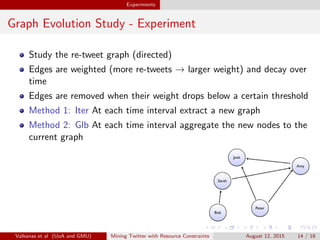
Geo-location coverage - Experiment 1 
Bounding Box 
Twitter also allows its users to ask for geotagged information. 
The user provides a bounding box, by specifying 4 coordinates in the 
form [(latmin; lonmin)(latmax ; lonmax )], and Twitter returns tweets that 
fall within this region. 
25 
0 
−25 
−50 
60 90 120 150 
lon 
lat 
. In this particular case, where geotagged tweets are asked for instead of a 
general sample, the volume of the returned results is the same for the two 
samples!. 
Valkanas et al (UoA and GMU) Mining Twitter with Resource Constraints August 12, 2015 9 / 18
Experiments 
Geo-location coverage - Experiment 2 
4 dierent crawls in London area 
Loc1 Loc2 Loc3 Loc4 
1400 
1200 
1000 
800 
600 
400 
200 
0 
0 5 10 15 20 25 30 35 40 45 
Count 
Half-Hour Interval 
. As the overlap increases between the bounding boxes, so does the 
similarity between two dierent crawls. 
Valkanas et al (UoA and GMU) Mining Twitter with Resource Constraints August 12, 2015 10 / 18
Experiments 
Sentiment Analysis 
0.35 
0.3 
0.25 
0.2 
0.15 
0.1 
0.05 
0 
Sample 1% Sample10% 
0 20 40 60 80 100 
Ratio 
Hour 
0.18 
0.16 
0.14 
0.12 
0.1 
0.08 
0.06 
0.04 
0.02 
0 
Sample 1% Sample10% 
0 20 40 60 80 100 
Ratio 
Hour 
Positive and Negative Sentiment Ratio 
0.18 
0.16 
0.14 
0.12 
0.1 
0.08 
0.06 
0.04 
0 20 40 60 80 100 
Ratio 
Hours 
Pos 1% 
Neg 1% 
Pos 10% 
Neg 10% 
- Dictionary based 
sentiment analysis 
- Ratio of tweets is 
the same in both 
samples 
- Ratios in geo-tagged 
tweets are lower, 
meaning that 
geottagged tweets 
oer less 
sentiment-oriented 
information 
Valkanas et al (UoA and GMU) Mining Twitter with Resource Constraints August 12, 2015 11 / 18
Experiments 
Popular Topic Detection - Experiment 
1 Extract the top-k most retweeted posts, that appear in our data 
(both samples). 
2 Compare the two lists (Kendall Correlation) 
3 Compare the two lists with the ground truth (= actual retweet count 
information included in the tweet) 
Valkanas et al (UoA and GMU) Mining Twitter with Resource Constraints August 12, 2015 12 / 18
Experiments 
Popular Topic Detection - Results 
1 
0.98 
0.96 
0.94 
0.92 
0.9 
0.88 
0.86 
10 100 1000 10000 
Kendall Correl. 
List Items 
S1-S10 
S1-S10P1 
S1-S10P2 
S10P1-S10P2 
S1-S1P1 
(a) Kendall 
1 
0.99 
0.98 
0.97 
0.96 
0.95 
0.94 
10 100 1000 10000 
Common Items (%) 
List Items 
S1-S10 
S1-S10P1 
S1-S10P2 
S10P1-S10P2 
S1-S1P1 
(b) Common Items 
1 
0.9 
0.8 
0.7 
0.6 
0.5 
0.4 
0.3 
0.2 
0.1 
0 
Sample 1% Sample 10% 
1 
5 
10 
100 
500 
1000 
2500 
5000 
7500 
10000 
Kendall Correl. 
Iteration 
(c) Vs the ground truth 
Figure : Comparing the top-N most retweeted items 
Conclusions 
For up to 10 items, 1% is adequate. That is not however the case for 
list with more than 1000 items. 
Comparison with Ground Truth: 10% has higher correlation. 
Valkanas et al (UoA and GMU) Mining Twitter with Resource Constraints August 12, 2015 13 / 18
Experiments 
Graph Evolution Study - Experiment 
Study the re-tweet graph (directed) 
Edges are weighted (more re-tweets ! larger weight) and decay over 
time 
Edges are removed when their weight drops below a certain threshold 
Method 1: Iter At each time interval extract a new graph 
Method 2: Glb At each time interval aggregate the new nodes to the 
current graph 
Valkanas et al (UoA and GMU) Mining Twitter with Resource Constraints August 12, 2015 14 / 18
Experiments 
Results 
300000 
250000 
200000 
150000 
100000 
50000 
0 
0 200 400 600 800 1000 1200 
Value 
Iteration 
Iter 1% 
Glb 1% 
Iter 10% 
Glb 10% 
(a) Size 
100 
90 
80 
70 
60 
50 
40 
30 
20 
10 
0 
Glb 1% Glb 10% 
0 200 400 600 800 1000 1200 
Value 
Iteration 
(b) Lar. Con. Comp. Size 
0.08 
0.07 
0.06 
0.05 
0.04 
0.03 
0.02 
0.01 
0 
0 200 400 600 800 1000 1200 
Value 
Iteration 
Iter 1% 
Glb 1% 
Iter 10% 
Glb 10% 
(c) Clustering Coecient 
Figure : Statistical properties of the extracted retweet graph, over time 
Conclusions 
No signi
cant dierences between the two samples 
LCC does not follow the 24-hour pattern 
Clustering coecient of 10% similar 100% 
Valkanas et al (UoA and GMU) Mining Twitter with Resource Constraints August 12, 2015 15 / 18
Experiments 
More on the paper... 
Retweet Burstiness 
The rate at which users retweet information plays an important role 
in capturing trending topics 
We investigate wether there is a dierence between the rates of 
receiving retweets in both samples 
Linguistic Analysis 
Is there a correlation between the spoken languages in Twitter, and 
the ground truth obtained from studies in the physical world? 
What are the dierences between the two samples in this context? 
We use language detection tools and ground truth information from 
Wikipedia. 
Valkanas et al (UoA and GMU) Mining Twitter with Resource Constraints August 12, 2015 16 / 18
Summary and Conclusions 
Conclusions 
Research question: Is the default sample sucient? For which tasks? 
Focused on spatio-temporal tasks 
We compared 1% with 10% sample 
The samples have quite similar properties 
However when you get into the details (less popular re-tweets) the 
bigger sample is better 
Valkanas et al (UoA and GMU) Mining Twitter with Resource Constraints August 12, 2015 17 / 18

Mining Twitter Data with Resource Constraints - IEEE/ACM Conference on Web Intelligence 2014

  • 1.
    Mining Twitter Datawith Resource Constraints Geoge Valkanas, Ioannis Katakis, Dimitrios Gunopulos, Anthony Stefanidis August 12, 2015 Valkanas et al (UoA and GMU) Mining Twitter with Resource Constraints August 12, 2015 1 / 18
  • 2.
    Research Question Isthe 1% sample provided by the Twitter API sucient for spatio-temporal analysis tasks? ... which tasks? ! We compare with the 10% sample (Garden Hose) Valkanas et al (UoA and GMU) Mining Twitter with Resource Constraints August 12, 2015 2 / 18
  • 3.
    Outline 1 Problemand Motivation 2 Data Collection 3 Experiments in Various Tasks Geo-location Coverage Sentiment Analysis Popular Topic Detection Graph Evolution 4 Conclusions Valkanas et al (UoA and GMU) Mining Twitter with Resource Constraints August 12, 2015 3 / 18
  • 4.
    Introduction Twitter Samples Two ways to access the stream Public Stream: 1% Sample Garden Hose: 10% Sample ... in both cases, we don't know details about the sampling method. Valkanas et al (UoA and GMU) Mining Twitter with Resource Constraints August 12, 2015 4 / 18
  • 5.
    Introduction Constraints Financialcost Licences of larger samples, are costly and dicult to obtain. Computational cost 7 Giga Bytes per minute O the shelf approaches are unable to operate in such settings In practice: those who engage in social media analytical tasks have practically no choice but to resort to the downsized information. However, being only a small fraction of the entire stream, it is unclear how reliable this information is for each type of application. Valkanas et al (UoA and GMU) Mining Twitter with Resource Constraints August 12, 2015 5 / 18
  • 6.
    Introduction A moreconcrete example The INSIGHT Project: Improve understanding, prediction and warning of emergencies through real-time processing of data streams including social data. (a) Floods in Germany (2013) (b) Control Center in Dublin CC How much data are ecient for our task? Valkanas et al (UoA and GMU) Mining Twitter with Resource Constraints August 12, 2015 6 / 18
  • 7.
    Introduction Tasks welook into... Sentiment Analysis Geo-located information Popular tweets Social Graph Evolution Linguistic Analysis Valkanas et al (UoA and GMU) Mining Twitter with Resource Constraints August 12, 2015 7 / 18
  • 8.
    Data The data 10M 1M 100K Default Gardenhose 0 20 40 60 80 100 Tweet Count Hours (c) All tweets 100K 10K 1K Default Gardenhose 0 20 40 60 80 100 GPS Tweet Count Hours (d) GPS-tagged tweets Figure : Comparing default and gardenhose samples for volume over time 4 day period - November 2013 The two samples dier by an order of magnitude Exhibit the same temporal pattern Geotagged tweets are between 1-2% of their respective sampled data Geotagged are more attened out Valkanas et al (UoA and GMU) Mining Twitter with Resource Constraints August 12, 2015 8 / 18
  • 9.
    Experiments Geo-location coverage- Experiment 1 Bounding Box Twitter also allows its users to ask for geotagged information. The user provides a bounding box, by specifying 4 coordinates in the form [(latmin; lonmin)(latmax ; lonmax )], and Twitter returns tweets that fall within this region. 25 0 −25 −50 60 90 120 150 lon lat . In this particular case, where geotagged tweets are asked for instead of a general sample, the volume of the returned results is the same for the two samples!. Valkanas et al (UoA and GMU) Mining Twitter with Resource Constraints August 12, 2015 9 / 18
  • 10.
    Experiments Geo-location coverage- Experiment 2 4 dierent crawls in London area Loc1 Loc2 Loc3 Loc4 1400 1200 1000 800 600 400 200 0 0 5 10 15 20 25 30 35 40 45 Count Half-Hour Interval . As the overlap increases between the bounding boxes, so does the similarity between two dierent crawls. Valkanas et al (UoA and GMU) Mining Twitter with Resource Constraints August 12, 2015 10 / 18
  • 11.
    Experiments Sentiment Analysis 0.35 0.3 0.25 0.2 0.15 0.1 0.05 0 Sample 1% Sample10% 0 20 40 60 80 100 Ratio Hour 0.18 0.16 0.14 0.12 0.1 0.08 0.06 0.04 0.02 0 Sample 1% Sample10% 0 20 40 60 80 100 Ratio Hour Positive and Negative Sentiment Ratio 0.18 0.16 0.14 0.12 0.1 0.08 0.06 0.04 0 20 40 60 80 100 Ratio Hours Pos 1% Neg 1% Pos 10% Neg 10% - Dictionary based sentiment analysis - Ratio of tweets is the same in both samples - Ratios in geo-tagged tweets are lower, meaning that geottagged tweets oer less sentiment-oriented information Valkanas et al (UoA and GMU) Mining Twitter with Resource Constraints August 12, 2015 11 / 18
  • 12.
    Experiments Popular TopicDetection - Experiment 1 Extract the top-k most retweeted posts, that appear in our data (both samples). 2 Compare the two lists (Kendall Correlation) 3 Compare the two lists with the ground truth (= actual retweet count information included in the tweet) Valkanas et al (UoA and GMU) Mining Twitter with Resource Constraints August 12, 2015 12 / 18
  • 13.
    Experiments Popular TopicDetection - Results 1 0.98 0.96 0.94 0.92 0.9 0.88 0.86 10 100 1000 10000 Kendall Correl. List Items S1-S10 S1-S10P1 S1-S10P2 S10P1-S10P2 S1-S1P1 (a) Kendall 1 0.99 0.98 0.97 0.96 0.95 0.94 10 100 1000 10000 Common Items (%) List Items S1-S10 S1-S10P1 S1-S10P2 S10P1-S10P2 S1-S1P1 (b) Common Items 1 0.9 0.8 0.7 0.6 0.5 0.4 0.3 0.2 0.1 0 Sample 1% Sample 10% 1 5 10 100 500 1000 2500 5000 7500 10000 Kendall Correl. Iteration (c) Vs the ground truth Figure : Comparing the top-N most retweeted items Conclusions For up to 10 items, 1% is adequate. That is not however the case for list with more than 1000 items. Comparison with Ground Truth: 10% has higher correlation. Valkanas et al (UoA and GMU) Mining Twitter with Resource Constraints August 12, 2015 13 / 18
  • 14.
    Experiments Graph EvolutionStudy - Experiment Study the re-tweet graph (directed) Edges are weighted (more re-tweets ! larger weight) and decay over time Edges are removed when their weight drops below a certain threshold Method 1: Iter At each time interval extract a new graph Method 2: Glb At each time interval aggregate the new nodes to the current graph Valkanas et al (UoA and GMU) Mining Twitter with Resource Constraints August 12, 2015 14 / 18
  • 15.
    Experiments Results 300000 250000 200000 150000 100000 50000 0 0 200 400 600 800 1000 1200 Value Iteration Iter 1% Glb 1% Iter 10% Glb 10% (a) Size 100 90 80 70 60 50 40 30 20 10 0 Glb 1% Glb 10% 0 200 400 600 800 1000 1200 Value Iteration (b) Lar. Con. Comp. Size 0.08 0.07 0.06 0.05 0.04 0.03 0.02 0.01 0 0 200 400 600 800 1000 1200 Value Iteration Iter 1% Glb 1% Iter 10% Glb 10% (c) Clustering Coecient Figure : Statistical properties of the extracted retweet graph, over time Conclusions No signi
  • 16.
    cant dierences betweenthe two samples LCC does not follow the 24-hour pattern Clustering coecient of 10% similar 100% Valkanas et al (UoA and GMU) Mining Twitter with Resource Constraints August 12, 2015 15 / 18
  • 17.
    Experiments More onthe paper... Retweet Burstiness The rate at which users retweet information plays an important role in capturing trending topics We investigate wether there is a dierence between the rates of receiving retweets in both samples Linguistic Analysis Is there a correlation between the spoken languages in Twitter, and the ground truth obtained from studies in the physical world? What are the dierences between the two samples in this context? We use language detection tools and ground truth information from Wikipedia. Valkanas et al (UoA and GMU) Mining Twitter with Resource Constraints August 12, 2015 16 / 18
  • 18.
    Summary and Conclusions Conclusions Research question: Is the default sample sucient? For which tasks? Focused on spatio-temporal tasks We compared 1% with 10% sample The samples have quite similar properties However when you get into the details (less popular re-tweets) the bigger sample is better Valkanas et al (UoA and GMU) Mining Twitter with Resource Constraints August 12, 2015 17 / 18