This document summarizes a study characterizing patients with mild cognitive impairment (MCI) both cross-sectionally and longitudinally. The study found that:
1) Patients with MCI performed similarly to healthy controls on tests of general cognition but scored significantly worse than controls on memory tests, though they performed better than patients with very mild Alzheimer's disease.
2) Over about 4 years of follow-up, 12% of patients with MCI converted to dementia per year, compared to a 1-2% conversion rate in healthy controls.
3) Patients with MCI declined more slowly on cognitive tests than patients with Alzheimer's disease but faster than healthy controls.
![AD on measures of general cognition and other non-
memory indexes. While there may have been mild
impairments in some of the domains of cognition, eg,
full-scale IQ, the actual raw score difference was suffi-
ciently small, eg, a full-scale IQ of 101.8 vs 98.0 for
controls and subjects with MCI, respectively, to not be
clinically meaningful. That is, it is doubtful that most
clinicians would say that a subject with a full-scale IQ
of 98 was demented on the basis of this measure. The
subjects with MCI performed more poorly than the
control subjects on the Controlled Oral Word Associa-
tion Test, but once again, the performance of the sub-
jects with MCI was in the normal range for age based
on our community studies.35
This is not to say, how-
ever, that these subjects may not have incipient clinical
AD; rather, most clinicians would be reluctant to make
the diagnosis of AD at this stage. In addition, it is not
likely that these subjects have a significant functional
deficit since their mean CDR sum of box scores was 1.5
with most of the decline being accounted for by
memory deficits. However, the patients with very mild
AD (CDR 0.5) had a mean CDR sum of the box score of
3.3 that reflected these subjects’ impairment in func-
tional domains.
From a memory perspective, the subjects with MCI
appeared more like the patients with AD than the con-
trol subjects. Again, this is not surprising considering the
selection criteria, but these data lend quantitation to these
criteria. In fact, if the clinician sees a patient with im-
paired delayed recall performance or difficulty benefit-
30
10
20
0
MMSE
16
4
2
10
8
6
14
12
0
Controls
0CDR
MCI
0.5
AD
0.5
AD
1
Logical Memory II
110
85
90
95
100
105
75
80
Full-Scale IQ
18
16
4
2
10
8
6
14
12
0
Controls
0CDR
MCI
0.5
AD
0.5
AD
1
Visual Reproductions II
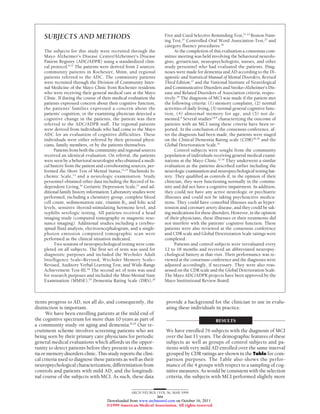
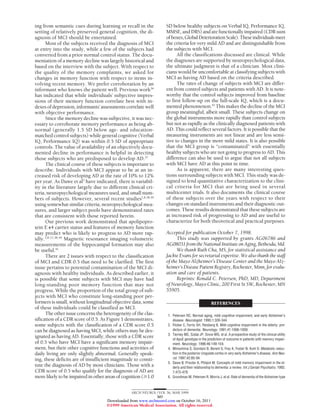
Figure 1. Relative performance among 4 groups: controls, subjects with mild cognitive impairment (MCI) (Clinical Dementia Rating [CDR] 0.5), and patients with
Alzheimer disease (AD) (CDR 0.5; CDR 1), on measures of global cognitive functioning, Mini-Mental State Examination (MMSE), and full-scale IQ compared with
performance on measures of delayed recall for verbal materials (Logical Memory II) and nonverbal materials (Visual Reproductions II).
60
40
20
100
80
0
Initial Examination
MCI,%
12
mo
24 36 48
MCI Alzheimer Disease
Figure 2. Annual rates of conversion from mild cognitive impairment (MCI)
to dementia over 48 months.
0
–2
–3
–1
–4
2
–10
–4
–6
–8
0
–2
–12
Dementia Rating Scale
1.0
0.4
0.2
0.8
0.6
0.0
Controls
0CDR
MCI
0.5
AD
0.5
AD
1
Global Deterioration Scale
MMSE
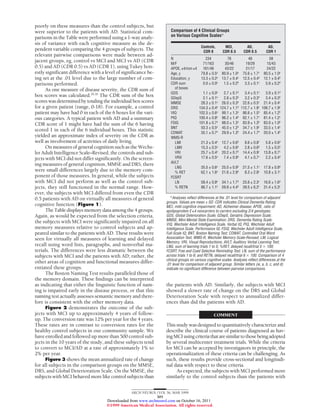
Figure 3. Annual rates of change on 3 measures of global function for
controls, subjects with mild cognitive impairment (MCI) (Clinical Dementia
Rating [CDR] 0.5), and patients with Alzheimer disease (AD) (CDR 0.5;
CDR 1). MMSE indicates Mini-Mental State Examination.
ARCH NEUROL/VOL 56, MAR 1999
306
©1999 American Medical Association. All rights reserved.
on October 16, 2011www.archneurol.comDownloaded from](https://image.slidesharecdn.com/mildcognitiveimpairment-130524173241-phpapp01/85/Mild-cognitive-impairment-4-320.jpg)
![(DAT) in subjects with mild cognitive impairment [abstract]. Neurology. 1996;
46:A403.
7. Morris JC, McKeel DW, Storandt M, et al. Very mild Alzheimer’s disease: infor-
mant based clinical, psychometric, and pathologic distinction from normal ag-
ing. Neurology. 1991;41:469-478.
8. Petersen RC, Smith GE, Ivnik RJ, et al. Apolipoprotein E status as a predictor of
the development of Alzheimer’s disease in memory-impaired individuals. JAMA.
1995;273:1274-1278.
9. Petersen RC, Waring SC, Smith GE, Tangalos EG, Thibodeau SN. Predictive value
of APOE genotyping in incipient Alzheimer’s disease. Ann N Y Acad Sci. 1996;
802:58-69.
10. Petersen RC, Kokmen E, Tangalos E, Ivnik RJ, Kurland LT. Mayo Clinic Alzhei-
mer’s Disease Patient Registry. Aging. 1990;2:408-415.
11. Petersen RC, Smith G, Kokmen E, Ivnik RJ, Tangalos EG. Memory function in
normal aging. Neurology. 1992;42:396-401.
12. Petersen RC, Smith GE, Ivnik RJ, Kokmen E, Tangalos EG. Memory function in
very early Alzheimer’s disease. Neurology. 1994;44:867-872.
13. Kokmen E, Naessens JM, Offord KP. A Short Test of Mental Status: description
and preliminary results. Mayo Clin Proc. 1987;62:281-288.
14. Kokmen E, Smith GE, Petersen RC, Tangalos E, Ivnik RJ. The short test of men-
tal status: correlations with standardized psychometric testing.Arch Neurol. 1991;
48:725-728.
15. Rosen W, Terry R. Pathological verification of ischemic score differentiation of
dementias. Ann Neurol. 1980;7:486-488.
16. Weintraub S. The record of independent living: an informant-completed mea-
sure of activities of daily living and behavior in elderly patients with cognitive
impairment. Am J Alzheimer Care Rel Disord. 1986;7:35-39.
17. Sheikh JI, Yesavage JA. Geriatric Depression Scale (GDS): recent evidence and
development of a shorter version. In: Brink TL, ed. Clinical Gerontology: A Guide to
AssessmentandIntervention. Binghamton, NY: Haworth Press Inc; 1986:165-173.
18. Lezak MD. Neuropsychological Assessment, Third Edition. New York, NY: Ox-
ford University Press Inc; 1995.
19. Folstein MF, Folstein SE, McHugh PR. “Mini-Mental State”: a practical method
for grading the cognitive state of patients for the clinician. J Psychiatr Res. 1975;
12:189-198.
20. Mattis S. Dementia Rating Scale: Professional Manual. Odessa, Fla: Psychologi-
cal Assessment Resources Inc; 1988.
21. Grober E, Buschke H. Genuine memory deficits in dementia. Dev Neuropsychol.
1987;3:13-36.
22. Buschke H. Cued recall in amnesia. J Clin Neurophysiol. 1984;6:433-440.
23. Buschke H. Control of cognitive processing. In: Squire LR, Butters N, eds. Neu-
ropsychology of Memory. New York, NY: Guilford Press; 1984:37-40.
24. Kaplan EF, Goodglass H, Weintraub S. The Boston Naming Test. Boston, Mass:
E Kaplan & H Goodglass; 1978.
25. Benton AL, Hamsher K, Varney NR, Spreen O. Contributions to Neuropsycho-
logical Assessment. New York, NY: Oxford University Press Inc; 1983.
26. Monsch AU, Bondi MW, Butters N, et al. A comparison of category and letter
fluency in Alzheimer’s disease and Huntington’s disease. Neuropsychology. 1994;
8:25-30.
27. American Psychiatric Association. Diagnostic and Statistical Manual of Mental
Disorders, Revised Third Edition. Washington, DC: American Psychiatric Asso-
ciation; 1987.
28. McKhann G, Drachman D, Folstein M, Katzman R, Price D, Stadlan EM. Clinical
Diagnosis of Alzheimer’s Disease: report of the NINCDS-ADRDA Work Group un-
der the auspices of Department of Health and Human Services Task Force on
Alzheimer’s Disease. Neurology. 1984;34:939-944.
29. Morris JC. The Clinical Dementia Rating (CDR): current version and scoring rules.
Neurology. 1993;43:2412-2414.
30. Berg L. Clinical Dementia Rating (CDR). Psychopharm Bull. 1988;24:637-639.
31. Reisberg B, Ferris S, deLeon MJ, Crook T. The Global Deterioration Scale for as-
sessment of primary degenerative dementia. Am J Psychiatry. 1982;130:
1136-1139.
32. Ivnik RJ, Malec JF, Smith GE, et al. Mayo’s Older Americans Normative Studies:
WAIS-R norms for ages 56 to 97. Clin Neuropsychol. 1992;6(suppl):1-30.
33. Ivnik RJ, Malec JF, Smith GE, et al. Mayo’s Older Americans Normative Studies:
WMS-R norms for ages 56 to 94. Clin Neuropsychol. 1992;6(suppl):49-82.
34. Ivnik RJ, Smith GE, Tangalos EG, Petersen RC, Kokmen E, Kurland LT. Wechs-
ler Memory Scale (WMS): I.Q. dependent norms for persons ages 65-97 years:
Psychological Assessment: J Consult Clin Psychol. 1991;3:156-161.
35. Ivnik RJ, Malec JF, Smith GE, Tangalos EG, Petersen RC. Neuropsychological
tests’ norms above age 55: COWAT, BNT, MAE Token, WRAT-R Reading,
AMNART, STROOP, TMT and JLO. Clin Neuropsychol. 1996;10:262-278.
36. McGlone J, Gupta S, Humphrey D, Oppenheimer S, Mirsen T, Evans DR. Screen-
ing for early dementia using memory complaints from patients and relatives. Arch
Neurol. 1990;47:1189-1193.
37. Morris JC, Storandt M, McKeel DW, et al. Cerebral amyloid deposition and dif-
fuse plaques in “normal” aging. Neurology. 1996;46:707-719.
38. Tierney MC, Szalai JP, Snow WG, et al. Prediction of probable Alzheimer’s dis-
ease in memory-impaired patients: a prospective longitudinal study. Neurology.
1996;46:661-665.
39. Bowen J, Teri L, Kukull W, McCormick W, McCurry S, Larson E. Progression to
dementia in patients with isolated memory loss. Lancet. 1997;349:763-765.
40. Petersen RC, Smith GE, Kokmen E, Ivnik RJ, Tangalos EG. Memory function in
normal aging. Neurology. 1992;42:396-401.
41. Jack CR, Petersen RC, Xu Y-C, et al. Medial temporal atrophy on MRI in normal
aging and very mild Alzheimer’s disease. Neurology. 1997;49:786-794.
42. Lemsky C, Chulune G, Ferman TJ, Ivnik RJ. Detecting clinically relevant memory
changes in elderly patients. J Int Neuropsychol Soc. 1998;4:53.
ARCH NEUROL/VOL 56, MAR 1999
308
©1999 American Medical Association. All rights reserved.
on October 16, 2011www.archneurol.comDownloaded from](https://image.slidesharecdn.com/mildcognitiveimpairment-130524173241-phpapp01/85/Mild-cognitive-impairment-6-320.jpg)